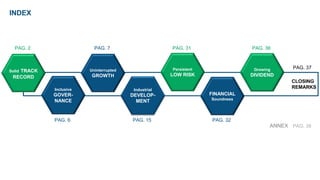
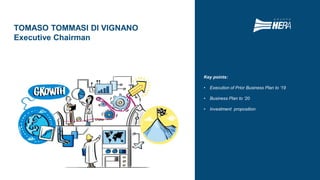
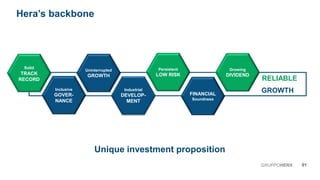
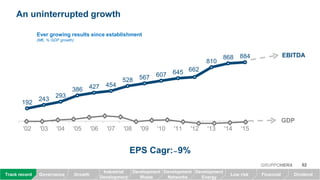
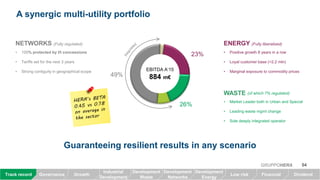
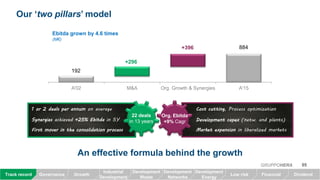
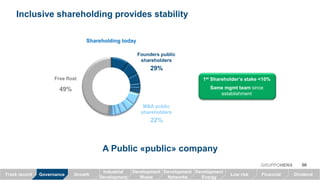
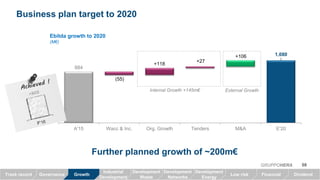
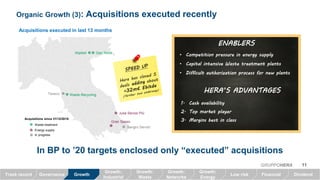
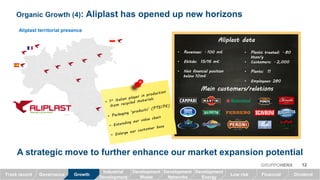
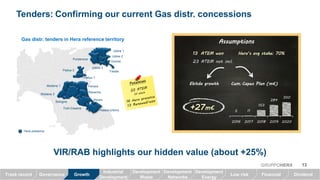
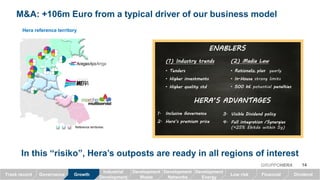
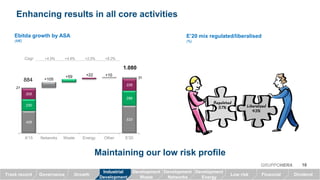
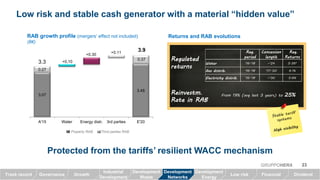
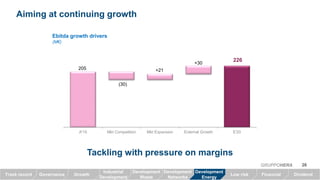
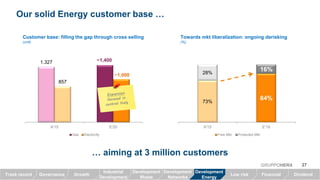
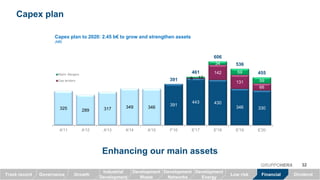
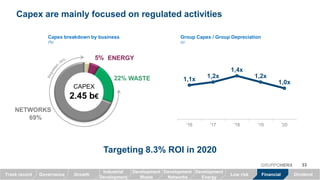
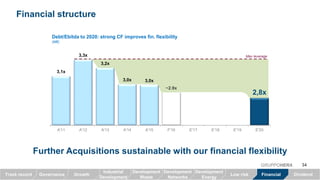
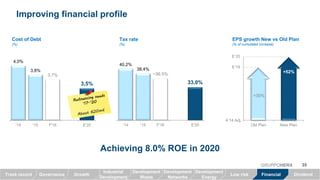
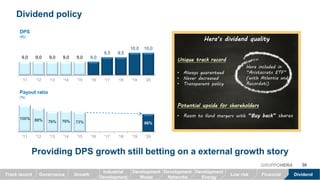
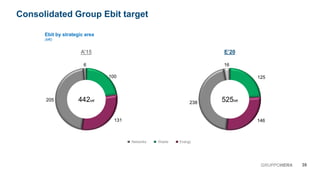
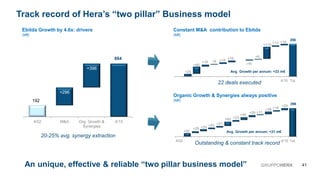
INDEX
CLOSING
REMARKS
ANNEX
Industrial
DEVELOP-
MENT
Solid TRACK
RECORD
Inclusive
GOVER-
NANCE
Persistent
LOW RISK
FINANCIAL
Soundness
Growing
DIVIDEND
Uninterrupted
GROWTH
PAG. 2 PAG. 31
PAG. 6 PAG. 32
PAG. 37
PAG. 38
PAG. 7
PAG. 15
PAG. 36
GRUPPOHERA
TOMASO TOMMASI DI VIGNANO
Executive Chairman
Key points:
• Execution of Prior Business Plan to ‘19
• Business Plan to ‘20
• Investment proposition
Hera backbone
01GRUPPOHERA
Unique investment proposition
RELIABLE
GROWTHIndustrial
DEVELOP-
MENT
Solid
TRACK
RECORD
Inclusive
GOVER-
NANCE
Persistent
LOW RISK
FINANCIAL
Soundness
Growing
DIVIDEND
Uninterrupted
GROWTH
02GRUPPOHERA
An uninterrupted growth
EPS Cagr: ̴ 9%
192
243
293
386 427 454
528 567 607 645 662
810
868 884
'02 '03 '04 '05 '06 '07 '08 '09 '10 '11 '12 '13 '14 '15
Ever growing results since establishment
(M€, % GDP growth)
EBITDA
GDP
Growth
Development
Waste
Track record Governance Low risk
Development
Networks
Development
Energy
Financial Dividend
Industrial
Development
03GRUPPOHERA
Expanding presence in the North-East
Leadership achieved in all sectors
Our footprint todayOur footprint todayOur footprint todayOur footprint today Market position (Market position (Market position (Market position (2015201520152015))))
FriuliFriuliFriuliFriuli
VenetoVenetoVenetoVeneto
Emilia RomagnaEmilia RomagnaEmilia RomagnaEmilia Romagna
MarcheMarcheMarcheMarche
TrentinoTrentinoTrentinoTrentino
LombardyLombardyLombardyLombardy
PiedmontPiedmontPiedmontPiedmont
LiguriaLiguriaLiguriaLiguria
TuscanyTuscanyTuscanyTuscany
UmbriaUmbriaUmbriaUmbria
GrowthTrack record Governance Low risk Financial Dividend
Industrial
Development
Development
Waste
Development
Networks
Development
Energy
04GRUPPOHERA
A synergic multi-utility portfolio
Guaranteeing resilient results in any scenario
(of which 7% regulated)
23%
49%
NETWORKS (Fully regulated)
WASTE
EBITDA A‘15
884 m€
ENERGY (Fully liberalised)
• 100% protected by l/t concessions
• Tariffs set for the next 3 years
• Strong contiguity in geographical scope
• Market Leader both in Urban and Special
• Leading waste mgmt change
• Sole deeply integrated operator
• Positive growth 8 years in a row
• Loyal customer base (>2.2 mln)
• Marginal exposure to commodity prices
26%
GrowthTrack record Governance Low risk Financial Dividend
Industrial
Development
Development
Waste
Development
Networks
Development
Energy
05GRUPPOHERA
Our ‘two pillars’ model
An effective formula behind the growth
192
884
+296
+396
A'02 M&A Org. Growth & Synergies A'15
Ebitda grown by 4.6 times
(M€)
1 or 2 deals per annum1 or 2 deals per annum1 or 2 deals per annum1 or 2 deals per annum on average
SynergiesSynergiesSynergiesSynergies achieved +25%+25%+25%+25% EbitdaEbitdaEbitdaEbitda in 5Y
First mover in the consolidation processFirst mover in the consolidation processFirst mover in the consolidation processFirst mover in the consolidation process
Cost cuttingCost cuttingCost cuttingCost cutting, Process optimization
Development capexDevelopment capexDevelopment capexDevelopment capex (netw. and plants)
Market expansionMarket expansionMarket expansionMarket expansion in liberalized markets
22 deals
in 13 years
Org. Ebitda
+9% Cagr
GrowthTrack record Governance Low risk Financial Dividend
Industrial
Development
Development
Waste
Development
Networks
Development
Energy
06GRUPPOHERA
Inclusive shareholding provides stability
A PUBLIC «public» company
Shareholding today
Free float
Founders public
shareholders
49%
29%
M&A public
shareholders
22%
1st Shareholder’s stake <10%
Same mgmt team since
establishment
GrowthTrack record Governance Low risk Financial Dividend
Industrial
Development
Development
Waste
Development
Networks
Development
Energy
Old BP to ’19: execution well on track
Forecast ’16 Ebitda
(M€)
841
>905
1.030
43
>61
(40)
A'14 Growth
A'15
Growth
F'16
Wacc&Inc.
F'16
F'16 BP E'19
Further ‘16 on top of targetsFurther ‘16 on top of targetsFurther ‘16 on top of targetsFurther ‘16 on top of targets
• Default gas supply won tenders
• Liability management
• Trading performance/asset mgmt
07GRUPPOHERA
GrowthTrack record Governance Low risk Financial Dividend
Forecast’Forecast’Forecast’Forecast’16161616 full yearfull yearfull yearfull year EbitdaEbitdaEbitdaEbitda
• Growth above +61 m€ offsetting negative
effects of:
• Wacc cut: 25 m€
• Incentive expired: >15 m€
Ebitda growth ‘15/’16 in line with targets
with almost all negative effects deployed in 2016
Industrial
Development
Development
Waste
Development
Networks
Development
Energy
08GRUPPOHERA
Business plan target to 2020
Further planned growth of ~200m€
884
1,080
(55)
+27
+118
+106
A'15 Wacc & Inc. Org. Growth Tenders M&A E'20
Internal Growth +145m€ External Growth
Ebitda growth to 2020
(M€)
GrowthTrack record Governance Low risk Financial Dividend
Industrial
Development
Development
Waste
Development
Networks
Development
Energy
09GRUPPOHERA
Organic growth: several levers to put at work
Deploying our expertise to squeeze additional value
Internal Growth Ebitda contribution
(M€)
+80
+118
Efficiencies Dev. Growth/Syn. E'20
GrowthTrack record Governance Low risk Financial Dividend
+38
Industrial
Development
Development
Waste
Development
Networks
Development
Energy
Organic Growth (2): focus on efficiencies
Efficiencies
+80 m€
NETWORKS
+20.4 m€
WASTE
+31.0 m€
ENERGY
10.9 m€
CORPORATE
+17.9 m€
10GRUPPOHERA
Several projects at work in all Group units
Efficiencies breakdown
(M€)
Growth:
Waste
Growth:
Networks
Growth:
Energy
Growth:
Industrial
GrowthTrack record Governance Low risk Financial Dividend
Industrial
Development
Development
Waste
Development
Networks
Development
Energy
• Competition pressure in energy supplyCompetition pressure in energy supplyCompetition pressure in energy supplyCompetition pressure in energy supply
• Capital intensive Waste treatment plantsCapital intensive Waste treatment plantsCapital intensive Waste treatment plantsCapital intensive Waste treatment plants
• DifficultDifficultDifficultDifficult authorization process for new plantsauthorization process for new plantsauthorization process for new plantsauthorization process for new plants
Organic Growth (3): acquisitions executed recently
In BP to ’20 targets enclosed only “executed” acquisitions
11GRUPPOHERA
Waste treatment
Energy supply
In progress
Gran Sasso
Julia Servizi Più
Waste Recycling
Geo Nova
Acquisitions since 31/12/2015:
1.1.1.1. Cash availabilityCash availabilityCash availabilityCash availability
2.2.2.2. Top market playerTop market playerTop market playerTop market player
3.3.3.3. Margins best in classMargins best in classMargins best in classMargins best in class
ENABLERSENABLERSENABLERSENABLERS
HERA’S ADVANTAGESHERA’S ADVANTAGESHERA’S ADVANTAGESHERA’S ADVANTAGES
Aliplast
Acquisitions executed in the last 13 months
Growth
Growth:
Waste
Track record Governance Low risk
Growth:
Networks
Growth:
Energy
Financial Dividend
Growth:
Industrial
Sangro Servizi
Teseco
AliplastAliplastAliplastAliplast datadatadatadata
Organic Growth (4): Aliplast has opened up new horizons
A strategic move to further enhance our market expansion potential
12GRUPPOHERA
Main customers/relationsMain customers/relationsMain customers/relationsMain customers/relations
• RevenuesRevenuesRevenuesRevenues:::: ̴ 100100100100 mmmm€€€€
• EbitdaEbitdaEbitdaEbitda:::: 15151515////16161616 mmmm€€€€
• Net financial positionNet financial positionNet financial positionNet financial position
belowbelowbelowbelow 10101010mmmm€€€€
• Plastic treated:Plastic treated:Plastic treated:Plastic treated: ̴ 80808080
ktonktonktonkton/y/y/y/y
• Customers:Customers:Customers:Customers: ̴ 2222,,,,000000000000
• Plants:Plants:Plants:Plants: 11111111
• Employees:Employees:Employees:Employees: 280280280280
Aliplast territorial presence
GrowthTrack record Governance Low risk Financial Dividend
Industrial
Development
Development
Waste
Development
Networks
Development
Energy
Tenders: confirming our current Gas distr. concessions
AssumptionsAssumptionsAssumptionsAssumptions
13131313 ATEM wonATEM wonATEM wonATEM won
9 ATEM not incl.
Hera’sHera’sHera’sHera’s avgavgavgavg stake:stake:stake:stake: 70707070%%%%
Hera presence
5 11
153
284
350
2016 2017 2018 2019 2020
CumCumCumCum. CapexCapexCapexCapex Plan (mPlan (mPlan (mPlan (m€€€€))))
13GRUPPOHERA
VIR/RAB highlights our hidden value (about +25%)
Modena 1
Modena 2
Bologna
Ferrara
Ravenna
Forlì-Cesena
Rimini
Pesaro-Urbino
Padua 1
Padua 2
Udine 1
Udine 2
Udine 3
Pordenone
Gorizia
Trieste
EbitdaEbitdaEbitdaEbitda growthgrowthgrowthgrowth
++++27272727mmmm€€€€
Gas distr. tenders in Hera reference territory
GrowthTrack record Governance Low risk Financial Dividend
Industrial
Development
Development
Waste
Development
Networks
Development
Energy
14GRUPPOHERA
M&A: +106m Euro from a typical driver of our business model
In this “risiko”, Hera’s outposts are ready in all regions of interest
ENABLERSENABLERSENABLERSENABLERS
HERA’S ADVANTAGESHERA’S ADVANTAGESHERA’S ADVANTAGESHERA’S ADVANTAGES
((((1111) Industry trends) Industry trends) Industry trends) Industry trends
• TendersTendersTendersTenders
• HigherHigherHigherHigher investmentsinvestmentsinvestmentsinvestments
• Higher qualityHigher qualityHigher qualityHigher quality stdstdstdstd
(2)(2)(2)(2) MadiaMadiaMadiaMadia LawLawLawLaw
• RationalizRationalizRationalizRationaliz. planplanplanplan yearly
• InInInIn----HouseHouseHouseHouse strong limits
• 500 k500 k500 k500 k€€€€ potential penaltiespenaltiespenaltiespenalties
Reference territories
3.3.3.3. Visible Dividend policyVisible Dividend policyVisible Dividend policyVisible Dividend policy
4.4.4.4. Full integration /SynergiesFull integration /SynergiesFull integration /SynergiesFull integration /Synergies
(+25% Ebitda within 5y)
1.1.1.1. Inclusive GovernanceInclusive GovernanceInclusive GovernanceInclusive Governance
2.2.2.2. Hera’s premium priceHera’s premium priceHera’s premium priceHera’s premium price
Hera reference territory
GrowthTrack record Governance Low risk Financial Dividend
Industrial
Development
Development
Waste
Development
Networks
Development
Energy
GrowthTrack record Governance
Growth:
Industrial
STEFANO VENIER
CEO
Key points:
• Solid strategic framework
• Move to enhance market positioning
• Growth down to bottom line
• Further ahead on sustainability
GrowthTrack record Governance
Growth:
Industrial
Low risk Financial DividendGrowthTrack record Governance
Industrial
Development
Development
Waste
Development
Networks
Development
Energy
Low risk Financial Dividend
15GRUPPOHERA
Circular economy
Customer experience
Industry (Utility) 4.0
Our levers …New trends
Waste Energy
Networks Other
Multi-utility
GROWTHGROWTHGROWTHGROWTH
EFFICIENCYEFFICIENCYEFFICIENCYEFFICIENCY
EXCELLENCEEXCELLENCEEXCELLENCEEXCELLENCE
INNOVATIONINNOVATIONINNOVATIONINNOVATION
AGILITYAGILITYAGILITYAGILITY
Confirming market leadership exploiting new opportunities
Hera strategic focus
GrowthTrack record Governance
Industrial
Development
Development
Waste
Development
Networks
Development
Energy
16GRUPPOHERA
+4.5% +4.6% +2.0% +8.2%Cagr
428
533
230
+105
+59
289
205
+22
226
21
+10
31
A'15 Networks Waste Energy Other E'20
884
1.080
Enhancing results in all core activities
Maintaining our low risk profile
Ebitda growth by ASA
(M€)
E’20 mix regulated/liberalized
(%)
RegulatedRegulatedRegulatedRegulated
57575757%%%% LiberalizedLiberalizedLiberalizedLiberalized
43434343%%%%
GrowthTrack record Governance Low risk Financial Dividend
Industrial
Development
Development
Waste
Development
Networks
Development
Energy
GRUPPOHERA
WASTE
The braces of our strategy:
• Growth
• Agility
• Innovation
• Excellence
• Efficiency
289
230
+16
+73
(30)
A'15 Collection Treatment Incentives E'20
A further expansion in a growing market
Deploying a solid platform and expertise
Ebitda growth by business
(M€)
GRUPPOHERA 17
GrowthTrack record Governance Low risk Financial Dividend
Industrial
Development
Development
Waste
Development
Networks
Development
Energy
A'15 E'20
Saved plant
capacity
275k ton
55% 66%
Sorted Urb. W. increase freeing plant capacity Hera vs EU sustainability targets
Recycling
Energy Recovery45%
34%
Regulated urban waste just achieved further savings
Beyond UN agenda and EU targets on sustainability
18GRUPPOHERA
HeraHeraHeraHeraEU targetEU targetEU targetEU target
Urban WUrban WUrban WUrban W. inininin
landfillslandfillslandfillslandfills
Below 10%
within 2030 Already today
PackagingPackagingPackagingPackaging
recyclingrecyclingrecyclingrecycling
Above 65%
within 2025 5Y in advance
Urban WUrban WUrban WUrban W.
recycledrecycledrecycledrecycled
65%
within 2030 10Y in advance
CIRCULAR ECONOMYCIRCULAR ECONOMYCIRCULAR ECONOMYCIRCULAR ECONOMY
GrowthTrack record Governance Low risk Financial Dividend
Industrial
Development
Development
Waste
Development
Networks
Development
Energy
143
230
A'15 E'16 E'17 E'18 E'19 E'20
«One stop shop» for all customer’s issuesItalian treatment Infrastructure shortage
Single service
Benefit from an integrated platform and a growing demand
Growing Special Waste exploiting market potentials
19GRUPPOHERA
Waste mgmt “crisis”
Proper infrastr.
HeraHeraHeraHera
Full service Business customers
Waste emergency
• Extensive landfill use
prohibited
• Shortage of other
treatm. plants
• UE penalties increased
• Difficult authorization
process for new plants
GrowthTrack record Governance Low risk Financial Dividend
Industrial
Development
Development
Waste
Development
Networks
Development
Energy
New horizons of our waste management
20GRUPPOHERA
GrowthTrack record Governance Low risk Financial Dividend
Industrial
Development
Development
Waste
Development
Networks
Development
Energy
Pioneering transformation of Biogas into methaneAliplast: a step ahead in circular economy
Contributing to Energy & Resource efficiency
Business Customers
Industrial Waste Products
Biodigester
Organic waste
Cracking
BiogasNaturalgas
7mcm/Y
URBANURBANURBANURBAN
WASTEWASTEWASTEWASTE
SPECIALSPECIALSPECIALSPECIAL
WASTEWASTEWASTEWASTE
ENERGY RECOVER
MATERIAL RECOVERMATERIAL RECOVERMATERIAL RECOVERMATERIAL RECOVER
REUSE
SORTED COLLECTION
OPTIMIZING
PRODUCTIVE
PROCESSES
SPECIAL WASTE
RECYCLE
TREATMENT AND DISPOSAL
Inerting systems
(che-phy., WTE)
On the black board: further move towards a Circular Economy paradigm
… developing our leadership
21GRUPPOHERA
GrowthTrack record Governance Low risk Financial Dividend
Industrial
Development
Development
Waste
Development
Networks
Development
Energy
66%66%66%66%
GRUPPOHERA
NETWORKS
The braces of our strategy:
• Efficiency
• Innovation
• Growth
• Excellence
533
428 +10
+41
(25)
+27
+52
A'15 Synergies Org. growth Wacc Tenders M&A E'20
Strengthening our regulated asset base
Growing despite stable tariffs
Ebitda growth drivers
(M€)
22GRUPPOHERA
GrowthTrack record Governance Low risk Financial Dividend
Industrial
Development
Development
Waste
Development
Networks
Development
Energy
RegRegRegReg.
periodperiodperiodperiod
ConcessionConcessionConcessionConcession
lengthlengthlengthlength
RegRegRegReg.
ReturnsReturnsReturnsReturns
WaterWaterWaterWater ‘16-’18 ~’24 5.3%*
GasGasGasGas distribdistribdistribdistrib. ‘16-’18 ‘17-’20 6.1%
ElectricityElectricityElectricityElectricity distribdistribdistribdistrib. ‘16-’18 ~’30 5.6%
3.07
3.48
0.27
+0.11
0.37
+0,10
+0,30
A'15 Water Energy distr. 3rd parties E'20
3.9
3.3
Protected from the tariffs’ resilient WACC mechanism
RAB growth profile (mergers’ effect not included)
(B€)
RegulatedRegulatedRegulatedRegulated
returnsreturnsreturnsreturns
23GRUPPOHERA
ReinvestmReinvestmReinvestmReinvestm.
Rate in RABRate in RABRate in RABRate in RAB
From 19% (avg last 3 years) to 25%25%25%25%
Returns and RAB evolutions
GrowthTrack record Governance Low risk Financial Dividend
Industrial
Development
Development
Waste
Development
Networks
Development
Energy
Property RAB Third parties RAB
Low risk and stable cash generator with a material hidden value
Advanced Network
monitoring
Satellite scanning
Radiometric measurem.
Algorithm analysis
Smart App interface
Smart Water
Modelling
HergoReti OSCAR control
system
Pilot project to control
sewerage water
Sophisticated air
conditioning to reduce
nitrogen residuals
Low energy consumptions
Pilot project in FE for real
time mgmt decision
making
Predictive system on
networks function
Prevention from critical
operating conditions
High tech content underpinning efficiency gains
Exploiting synergies from Nets, big data and “smart” technologies
24GRUPPOHERA
Hergoreti, new IT integrated
system, improve all the
scheduled and non-
scheduled operating
activities on plants and gas,
water, energy, remote
heating networks
GrowthTrack record Governance Low risk Financial Dividend
Industrial
Development
Development
Waste
Development
Networks
Development
Energy
On the black board: Industry (Utility) 4.0 trends add value…
… to our main tangible assets
25GRUPPOHERA
GrowthTrack record Governance Low risk Financial Dividend
Industrial
Development
Development
Waste
Development
Networks
Development
Energy
GRUPPOHERA
ENERGY
The braces of our strategy:
• Growth
• Intangible assets
• Agility
• Innovation
Aiming at continuing growth
Tackling with pressure on margins
226
205
(30)
+21
+30
A'15 Mkt Competition Mkt Expansion External Growth E'20
Ebitda growth drivers
(M€)
26GRUPPOHERA
GrowthTrack record Governance Low risk Financial Dividend
Industrial
Development
Development
Waste
Development
Networks
Development
Energy
Our solid Energy customer base …
… aiming at 3 million customers
1.327
857
A'15 E'20
Gas Electricity
Customer base: filling the gap through cross selling
(unit)
Towards mkt liberalization: ongoing derisking
(%)
73%
84%
28%
16%
A'15 E'18
Free Mkt Protected Mkt
27GRUPPOHERA
GrowthTrack record Governance Low risk Financial Dividend
Industrial
Development
Development
Waste
Development
Networks
Development
Energy
~1,400
~1,000
• Cost to serve (€/POD)
• +200k Energy
customers in the
next 5Y
• 25% digital
customers
Evolving our CRM to enhance the customer experience
More potentials to our proactive marketing actions
28GRUPPOHERA
Proactive
Problem
solving
KPIs evolving considering
more and more “soft”
skills
Tailored offers
… at work
enabling better
assistance and
cross selling
Fast & Smart
Strong language ID
Customer Relationship Management system
GrowthTrack record Governance Low risk Financial Dividend
Industrial
Development
Development
Waste
Development
Networks
Development
Energy
23,824,1 + 1.2
( 1.5)
A'15 Inflation Efficiency E'20
Hera
Enel
Safeguarded Elect. and Default gas supply in 11 regions
Mkt expansion leveraging upon our nationwide presence
Next 2 years results underpinned by won tenders
Hera
Enel
29GRUPPOHERA
Energy Ebitda curve ‘15-E’20 expected
(M€)
205
226
A '15 E'16 E'17 E'18 E'19 E'20
GrowthTrack record Governance Low risk Financial Dividend
Industrial
Development
Development
Waste
Development
Networks
Development
Energy
New
tenders
Expanding the value of our main intangible asset
On the black board: focusing on Customer Experience
30GRUPPOHERA
GrowthTrack record Governance Low risk Financial Dividend
Industrial
Development
Development
Waste
Development
Networks
Development
Energy
Sensitivity to PUN pricesSensitivity to PUN pricesSensitivity to PUN pricesSensitivity to PUN prices
(plus or minus 1€/MWh, impact in M€, % impact on Group Ebitda)
GROUP EBITDAGROUP EBITDAGROUP EBITDAGROUP EBITDA
Sensitivity to GDPSensitivity to GDPSensitivity to GDPSensitivity to GDP
(plus or minus 1%, impact in M€, % impact on Group Ebitda)
Sensitivity to Gas pricesSensitivity to Gas pricesSensitivity to Gas pricesSensitivity to Gas prices
(plus or minus 1 Eurocent per cubic meter, impact in M€, %
impact on Group Ebitda)
GROUP EBITDAGROUP EBITDAGROUP EBITDAGROUP EBITDA
1111$/Barrel$/Barrel$/Barrel$/Barrel 1%1%1%1%
1111€€€€////MWhMWhMWhMWh 1111cccc€€€€/M/M/M/M3333
GROUP EBITDAGROUP EBITDAGROUP EBITDAGROUP EBITDA
Sensitivity to oil pricesSensitivity to oil pricesSensitivity to oil pricesSensitivity to oil prices
(dollar per barrel impact in M€, % impact on Group Ebitda)
31GRUPPOHERA
Sensitivity highlights a resilient portfolio mix
Low risk profile is core in our strategy
GrowthTrack record Governance Low risk Financial Dividend
<0.05M€
<0<0<0<0.01%01%01%01%
4.00M€
0000.38383838%%%%
0.70M€
0000,,,,07070707%%%%
0.50M€
0000.05050505%%%%
Industrial
Development
Development
Waste
Development
Networks
Development
Energy
325 289 317 349 346
391
443 430
346 330
6
142
131
66
12
34
59
59391
461
606
536
455
A'11 A'12 A'13 A'14 A'15 F'16 E'17 E'18 E'19 E'20
Maint. Mergers
Gas tenders
Capex plan
Capex plan to 2020: 2.45 b€ to grow and strengthen assets
(M€)
32GRUPPOHERA
Enhancing our main assets
GrowthTrack record Governance Low risk Financial Dividend
Industrial
Development
Development
Waste
Development
Networks
Development
Energy
Capex are mainly focused on regulated activities
Targeting 8.3% ROI in 2020
22%
5%
69%
NETWORKS
WASTE
CAPEX
2.45 b€
ENERGY
1,1x 1,2x
1,4x
1,2x
1,0x
'16 '17 '18 '19 '20
Capex breakdown by business
(%)
Group Capex / Group Depreciation
(x)
33GRUPPOHERA
GrowthTrack record Governance Low risk Financial Dividend
Industrial
Development
Development
Waste
Development
Networks
Development
Energy
Debt/Ebitda to 2020: strong CF improves fin. flexibility
(M€)
34GRUPPOHERA
Further Acquisitions sustainable with our financial flexibility
Growth:
Waste
Growth:
Networks
Growth:
Energy
Growth:
Industrial
GrowthTrack record Governance Low risk Financial Dividend
Max leverage
Industrial
Development
Development
Waste
Development
Networks
Development
Energy
3,1x
3,3x
3,2x
3,0x 3,0x
~2.9x
2,8x
A'11 A'12 A'13 A'14 A'15 F'16 E'17 E'18 E'19 E'20
Financial structure
Improving financial profile
Achieving 8.0% ROE in 2020
Cost of Debt
(%)
Tax rate
(%)
4,0%
3,8%
3,7%
3,5%
'14 '15 F'16 E'20
40,2%
38,4%
~36.5%
33,0%
'14 '15 F'16 E'20
35GRUPPOHERA
EPS growth New vs Old Plan
(% of cumulated increase)
GrowthTrack record Governance Low risk Financial Dividend
2014
2015
2016
2017
2018
2019
2020
Old Plan New Plan
E’20
E’19
A’14 Adj.
+30%
+52%
Industrial
Development
Development
Waste
Development
Networks
Development
Energy
GRUPPOHERA
TOMASO TOMMASI DI VIGNANO
Executive Chairman
Key points:
• Dividend Policy
• Closing remarks
9,0 9,0 9,0 9,0 9,0 9,0
9,5 9,5
10,0 10,0
'11 '12 '13 '14 '15 '16 '17 '18 '19 '20
Dividend policy
100% 88% 76% 79% 73% 66%
'11 '12 '13 '14 '15 '16 '17 '18 '19 '20
DPS
(€c)
Payout ratio
(%)
36GRUPPOHERA
Providing DPS growth still betting on an external growth story
Hera’s dividend qualityHera’s dividend qualityHera’s dividend qualityHera’s dividend quality
Unique track recordUnique track recordUnique track recordUnique track record
• Always guaranteed
• Never decreased
• Transparent policy
Potential upside for shareholdersPotential upside for shareholdersPotential upside for shareholdersPotential upside for shareholders
• Room to fund mergers with “Buy back”“Buy back”“Buy back”“Buy back” shares
Hera included in
“Aristocrats ETF”
(with Atlantia and
Recordati)
GrowthTrack record Governance Low risk Financial Dividend
Industrial
Development
Development
Waste
Development
Networks
Development
Energy
Closing remarks
Investor Relations contacts:
Mail: ir@gruppohera.it
+39 051 287040
Head of IR
Jens Klint Hansen
jens.hansen@gruppohera.it
• Solid premises to lead industry
changes
• Continuing a safe growth through
our “two pillar” business model
• High visibility on growing
shareholders return
GRUPPOHERA
GrowthTrack record Governance Low risk Financial Dividend
Industrial
Development
Development
Waste
Development
Networks
Development
Energy
37
Annex
GRUPPOHERA
Main assumptionsMain assumptionsMain assumptionsMain assumptions
A’A’A’A’14141414 A’15A’15A’15A’15 E’20E’20E’20E’20
BrentBrentBrentBrent (Dollar/Barrel) 99.5 53.7 55.0
Exchange ratioExchange ratioExchange ratioExchange ratio €/$ 1.33 1.11 1.10
PUNPUNPUNPUN (€/MWh) 52.1 52.3 52.5
InflationInflationInflationInflation (5Y moving average) 0.2% 0% 1.0%
Green certificateGreen certificateGreen certificateGreen certificate –––– biomass plantsbiomass plantsbiomass plantsbiomass plants (€/MWh) 97.4 99.5 80.3
Green certificateGreen certificateGreen certificateGreen certificate –––– other plantsother plantsother plantsother plants (€/MWh) 97.4 99.5 101.0
White certificatesWhite certificatesWhite certificatesWhite certificates (€/TEP) 106.2 106.1 115.5
COCOCOCO2222 certificatescertificatescertificatescertificates (€/ton) 7.2 8.2 11.0
Tax rateTax rateTax rateTax rate (%) 40.2% 38.4% 33%
Cost of DebtCost of DebtCost of DebtCost of Debt (%) 4.0% 3.8% 3.5%
38GRUPPOHERA
Business Plan main assumptions
Ebit by strategic area
(M€)
100
131
205
6
442M€
A’15 E’20
125
146
238
16
525M€
Waste EnergyNetworks
39GRUPPOHERA
Consolidated Group Ebit target
40,0 659,970,8
52,5
448,0 48,6
2.593,7 3,253.6
'16 '17 '18 '19 '20 Post Gross
Debt
Gross debt maturities
(M€)
Interest rate breakdown in 2020
(%)
36%
64%
Variable Fixed
Rates
40GRUPPOHERA
Financial Debt
2,594
An unique, effective & reliable “two pillar business model”
192
884
+296
+396
A'02 M&A Org. Growth &
Synergies
A'15
Ebitda Growth by 4.6x: drivers
(M€)
20-25% avg. synergy extraction
Organic Growth & Synergies always positive
(M€)
396
+50
+25 +29
+23 +21
+60 +23
+40
+29 +11
+38 +18
+29
A'02 A'15 Tot.
296
+25
+65
+18 +6 +15 +16
(16)
+6
+110
+13 +14
A'15 Tot.
Avg. Growth per annum: +31 m€
Avg. Growth per annum: +23 m€
Constant M&A contribution to Ebitda
(M€)
22 deals executed
Outstanding & constant track record
41GRUPPOHERA
Track record of Hera’s “two pillar” Business model
WaterWaterWaterWater
Awarded with
quality
premium
More efficient
sewerage water
plants (new in
Trieste and
Rimini e 6
other plants
refurbished)
Energy efficiency &Energy efficiency &Energy efficiency &Energy efficiency &
Climate changeClimate changeClimate changeClimate change
Energy connsumptions -5%
within ‘20
Offers to assist customers
deploying our expertice
Bio-digester to produce “bio-
methane” with lower emissions
EnvironmentEnvironmentEnvironmentEnvironment
65% of urban waste
recycling within ‘20
+4% CAGR elect.
generation from
renewables (70% of
total generation)
WorkWorkWorkWork
• New welfare system
• Internal climate:
65/100
• -3% accidents
42GRUPPOHERA
Some more sustainability ahead (’20 targets)
EconomicsEconomicsEconomicsEconomics
(M€)
Capex E’16-E’20: 545 m€
(M€)
Ebitda Breakdown
(M€)
Highlights
(M€)
A'15 E'16 E'17 E'18 E'19 E'20
230
289
A'15 E'20
Collection Treatment * Excluding volumes from M&A
A’15A’15A’15A’15 E’20E’20E’20E’20
EBITDAEBITDAEBITDAEBITDA 230.0 288288288288.6666
EBITEBITEBITEBIT 99.0 125125125125.0000
A’15 E’20
Waste treated 6,226 7,774
Urban 2,041 1,963
Special 2,002 3,217
by products 2,183 2,593
43GRUPPOHERA
Waste business
A'15 E'16 E'17 E'18 E'19 E'20
Capex E’16-E’20: 745 m€
(M€)
Volumes sold
(Mmc)
RAB
(M€)
EconomicsEconomicsEconomicsEconomics
(M€)
A’A’A’A’15151515 E’20E’20E’20E’20
EBITDAEBITDAEBITDAEBITDA 232.5 283283283283.5555
EBITEBITEBITEBIT 117.1 114114114114.5555
A’15 E’20
RAB* 1,407 1,507
300 295
A'15 E'20
*Numbers exclude M&A
44GRUPPOHERA
Water business
*Numbers exclude M&A
M€ 2014 Adj. E2019 Cagr
Ebitda 269.7 308.9 +2.8%
Ebit 171.2 175.3 +0.5%
A'15 E'16 E'17 E'18 E'19 E'20
Capex Gas Tenders
Economics
(M€)
Capex E’16-E’20: 924 m€
(M€)
Ebitda Breakdown
(M€)
296
348
A'15 E'20
Gas distribution Gas sales District Heating Heat Management
*Numbers include gas tenders and exclude M&A and third parties RAB
EconomicsEconomicsEconomicsEconomics
(M€)
A’A’A’A’15151515 E’20E’20E’20E’20
EBITDAEBITDAEBITDAEBITDA 295.8 348348348348.4444
EBITEBITEBITEBIT 181.1 198198198198.0000
Highlights
A’15 E’20
Volume Sales &Trading (Mcm) 3,383 3,224
RAB* (gas distr.+D.H. in m€) 1,266 1,579
45GRUPPOHERA
Gas business
A'15 E'16 E'17 E'18 E'19 E'20
Capex E’16-E’20: 159 m€
(M€)
Ebitda Breakdown
(M€)
Highlights
A'15 E'20
EE Distribution EE Sales Other
A’15A’15A’15A’15 E’20E’20E’20E’20
EBITDAEBITDAEBITDAEBITDA 101.0 127127127127.5555
EBITEBITEBITEBIT 38.2 71717171.6666
A’15 E’20
Volume Sold (TWh) 9.6 9.4
RAB* (m€) 361 351
105
127
EconomicsEconomicsEconomicsEconomics
(M€)
*Numbers exclude M&A
46GRUPPOHERA
Electricity business
This presentation contains forward-looking statements regarding future events (which impact the Hera Group’s future
results) that are based on current expectations, estimates and opinions of management.
These forward-looking statements are subject to risks, uncertainties and events that are unpredictable and depend on
circumstances that might change in future.
As a result, any expectation on Group results and estimates set out in this presentation may differ significantly depending
on changes in the unpredictable circumstances on which they are based.
Therefore, any forward -looking statement made by or on behalf of the Hera Group refer on the date they are made.
The Hera Group shall not undertake to update forward-looking statements to reflect any changes in the Group’s
expectations or in the events, conditions or circumstances on which any such statements are based.
Nevertheless, the Hera Group has a “profit warning policy” , in accordance with Italian laws, that shall notify the market
(under “price-sensitive” communication rules) regarding any “sensible change” that might occur in Group expectations on
future results.
47GRUPPOHERA
Disclaimer

Analyst presentation: business plan to 2020

  • 2.
  • 3.
    GRUPPOHERA TOMASO TOMMASI DIVIGNANO Executive Chairman Key points: • Execution of Prior Business Plan to ‘19 • Business Plan to ‘20 • Investment proposition
  • 4.
    Hera backbone 01GRUPPOHERA Unique investmentproposition RELIABLE GROWTHIndustrial DEVELOP- MENT Solid TRACK RECORD Inclusive GOVER- NANCE Persistent LOW RISK FINANCIAL Soundness Growing DIVIDEND Uninterrupted GROWTH
  • 5.
    02GRUPPOHERA An uninterrupted growth EPSCagr: ̴ 9% 192 243 293 386 427 454 528 567 607 645 662 810 868 884 '02 '03 '04 '05 '06 '07 '08 '09 '10 '11 '12 '13 '14 '15 Ever growing results since establishment (M€, % GDP growth) EBITDA GDP Growth Development Waste Track record Governance Low risk Development Networks Development Energy Financial Dividend Industrial Development
  • 6.
    03GRUPPOHERA Expanding presence inthe North-East Leadership achieved in all sectors Our footprint todayOur footprint todayOur footprint todayOur footprint today Market position (Market position (Market position (Market position (2015201520152015)))) FriuliFriuliFriuliFriuli VenetoVenetoVenetoVeneto Emilia RomagnaEmilia RomagnaEmilia RomagnaEmilia Romagna MarcheMarcheMarcheMarche TrentinoTrentinoTrentinoTrentino LombardyLombardyLombardyLombardy PiedmontPiedmontPiedmontPiedmont LiguriaLiguriaLiguriaLiguria TuscanyTuscanyTuscanyTuscany UmbriaUmbriaUmbriaUmbria GrowthTrack record Governance Low risk Financial Dividend Industrial Development Development Waste Development Networks Development Energy
  • 7.
    04GRUPPOHERA A synergic multi-utilityportfolio Guaranteeing resilient results in any scenario (of which 7% regulated) 23% 49% NETWORKS (Fully regulated) WASTE EBITDA A‘15 884 m€ ENERGY (Fully liberalised) • 100% protected by l/t concessions • Tariffs set for the next 3 years • Strong contiguity in geographical scope • Market Leader both in Urban and Special • Leading waste mgmt change • Sole deeply integrated operator • Positive growth 8 years in a row • Loyal customer base (>2.2 mln) • Marginal exposure to commodity prices 26% GrowthTrack record Governance Low risk Financial Dividend Industrial Development Development Waste Development Networks Development Energy
  • 8.
    05GRUPPOHERA Our ‘two pillars’model An effective formula behind the growth 192 884 +296 +396 A'02 M&A Org. Growth & Synergies A'15 Ebitda grown by 4.6 times (M€) 1 or 2 deals per annum1 or 2 deals per annum1 or 2 deals per annum1 or 2 deals per annum on average SynergiesSynergiesSynergiesSynergies achieved +25%+25%+25%+25% EbitdaEbitdaEbitdaEbitda in 5Y First mover in the consolidation processFirst mover in the consolidation processFirst mover in the consolidation processFirst mover in the consolidation process Cost cuttingCost cuttingCost cuttingCost cutting, Process optimization Development capexDevelopment capexDevelopment capexDevelopment capex (netw. and plants) Market expansionMarket expansionMarket expansionMarket expansion in liberalized markets 22 deals in 13 years Org. Ebitda +9% Cagr GrowthTrack record Governance Low risk Financial Dividend Industrial Development Development Waste Development Networks Development Energy
  • 9.
    06GRUPPOHERA Inclusive shareholding providesstability A PUBLIC «public» company Shareholding today Free float Founders public shareholders 49% 29% M&A public shareholders 22% 1st Shareholder’s stake <10% Same mgmt team since establishment GrowthTrack record Governance Low risk Financial Dividend Industrial Development Development Waste Development Networks Development Energy
  • 10.
    Old BP to’19: execution well on track Forecast ’16 Ebitda (M€) 841 >905 1.030 43 >61 (40) A'14 Growth A'15 Growth F'16 Wacc&Inc. F'16 F'16 BP E'19 Further ‘16 on top of targetsFurther ‘16 on top of targetsFurther ‘16 on top of targetsFurther ‘16 on top of targets • Default gas supply won tenders • Liability management • Trading performance/asset mgmt 07GRUPPOHERA GrowthTrack record Governance Low risk Financial Dividend Forecast’Forecast’Forecast’Forecast’16161616 full yearfull yearfull yearfull year EbitdaEbitdaEbitdaEbitda • Growth above +61 m€ offsetting negative effects of: • Wacc cut: 25 m€ • Incentive expired: >15 m€ Ebitda growth ‘15/’16 in line with targets with almost all negative effects deployed in 2016 Industrial Development Development Waste Development Networks Development Energy
  • 11.
    08GRUPPOHERA Business plan targetto 2020 Further planned growth of ~200m€ 884 1,080 (55) +27 +118 +106 A'15 Wacc & Inc. Org. Growth Tenders M&A E'20 Internal Growth +145m€ External Growth Ebitda growth to 2020 (M€) GrowthTrack record Governance Low risk Financial Dividend Industrial Development Development Waste Development Networks Development Energy
  • 12.
    09GRUPPOHERA Organic growth: severallevers to put at work Deploying our expertise to squeeze additional value Internal Growth Ebitda contribution (M€) +80 +118 Efficiencies Dev. Growth/Syn. E'20 GrowthTrack record Governance Low risk Financial Dividend +38 Industrial Development Development Waste Development Networks Development Energy
  • 13.
    Organic Growth (2):focus on efficiencies Efficiencies +80 m€ NETWORKS +20.4 m€ WASTE +31.0 m€ ENERGY 10.9 m€ CORPORATE +17.9 m€ 10GRUPPOHERA Several projects at work in all Group units Efficiencies breakdown (M€) Growth: Waste Growth: Networks Growth: Energy Growth: Industrial GrowthTrack record Governance Low risk Financial Dividend Industrial Development Development Waste Development Networks Development Energy
  • 14.
    • Competition pressurein energy supplyCompetition pressure in energy supplyCompetition pressure in energy supplyCompetition pressure in energy supply • Capital intensive Waste treatment plantsCapital intensive Waste treatment plantsCapital intensive Waste treatment plantsCapital intensive Waste treatment plants • DifficultDifficultDifficultDifficult authorization process for new plantsauthorization process for new plantsauthorization process for new plantsauthorization process for new plants Organic Growth (3): acquisitions executed recently In BP to ’20 targets enclosed only “executed” acquisitions 11GRUPPOHERA Waste treatment Energy supply In progress Gran Sasso Julia Servizi Più Waste Recycling Geo Nova Acquisitions since 31/12/2015: 1.1.1.1. Cash availabilityCash availabilityCash availabilityCash availability 2.2.2.2. Top market playerTop market playerTop market playerTop market player 3.3.3.3. Margins best in classMargins best in classMargins best in classMargins best in class ENABLERSENABLERSENABLERSENABLERS HERA’S ADVANTAGESHERA’S ADVANTAGESHERA’S ADVANTAGESHERA’S ADVANTAGES Aliplast Acquisitions executed in the last 13 months Growth Growth: Waste Track record Governance Low risk Growth: Networks Growth: Energy Financial Dividend Growth: Industrial Sangro Servizi Teseco
  • 15.
    AliplastAliplastAliplastAliplast datadatadatadata Organic Growth(4): Aliplast has opened up new horizons A strategic move to further enhance our market expansion potential 12GRUPPOHERA Main customers/relationsMain customers/relationsMain customers/relationsMain customers/relations • RevenuesRevenuesRevenuesRevenues:::: ̴ 100100100100 mmmm€€€€ • EbitdaEbitdaEbitdaEbitda:::: 15151515////16161616 mmmm€€€€ • Net financial positionNet financial positionNet financial positionNet financial position belowbelowbelowbelow 10101010mmmm€€€€ • Plastic treated:Plastic treated:Plastic treated:Plastic treated: ̴ 80808080 ktonktonktonkton/y/y/y/y • Customers:Customers:Customers:Customers: ̴ 2222,,,,000000000000 • Plants:Plants:Plants:Plants: 11111111 • Employees:Employees:Employees:Employees: 280280280280 Aliplast territorial presence GrowthTrack record Governance Low risk Financial Dividend Industrial Development Development Waste Development Networks Development Energy
  • 16.
    Tenders: confirming ourcurrent Gas distr. concessions AssumptionsAssumptionsAssumptionsAssumptions 13131313 ATEM wonATEM wonATEM wonATEM won 9 ATEM not incl. Hera’sHera’sHera’sHera’s avgavgavgavg stake:stake:stake:stake: 70707070%%%% Hera presence 5 11 153 284 350 2016 2017 2018 2019 2020 CumCumCumCum. CapexCapexCapexCapex Plan (mPlan (mPlan (mPlan (m€€€€)))) 13GRUPPOHERA VIR/RAB highlights our hidden value (about +25%) Modena 1 Modena 2 Bologna Ferrara Ravenna Forlì-Cesena Rimini Pesaro-Urbino Padua 1 Padua 2 Udine 1 Udine 2 Udine 3 Pordenone Gorizia Trieste EbitdaEbitdaEbitdaEbitda growthgrowthgrowthgrowth ++++27272727mmmm€€€€ Gas distr. tenders in Hera reference territory GrowthTrack record Governance Low risk Financial Dividend Industrial Development Development Waste Development Networks Development Energy
  • 17.
    14GRUPPOHERA M&A: +106m Eurofrom a typical driver of our business model In this “risiko”, Hera’s outposts are ready in all regions of interest ENABLERSENABLERSENABLERSENABLERS HERA’S ADVANTAGESHERA’S ADVANTAGESHERA’S ADVANTAGESHERA’S ADVANTAGES ((((1111) Industry trends) Industry trends) Industry trends) Industry trends • TendersTendersTendersTenders • HigherHigherHigherHigher investmentsinvestmentsinvestmentsinvestments • Higher qualityHigher qualityHigher qualityHigher quality stdstdstdstd (2)(2)(2)(2) MadiaMadiaMadiaMadia LawLawLawLaw • RationalizRationalizRationalizRationaliz. planplanplanplan yearly • InInInIn----HouseHouseHouseHouse strong limits • 500 k500 k500 k500 k€€€€ potential penaltiespenaltiespenaltiespenalties Reference territories 3.3.3.3. Visible Dividend policyVisible Dividend policyVisible Dividend policyVisible Dividend policy 4.4.4.4. Full integration /SynergiesFull integration /SynergiesFull integration /SynergiesFull integration /Synergies (+25% Ebitda within 5y) 1.1.1.1. Inclusive GovernanceInclusive GovernanceInclusive GovernanceInclusive Governance 2.2.2.2. Hera’s premium priceHera’s premium priceHera’s premium priceHera’s premium price Hera reference territory GrowthTrack record Governance Low risk Financial Dividend Industrial Development Development Waste Development Networks Development Energy
  • 18.
    GrowthTrack record Governance Growth: Industrial STEFANOVENIER CEO Key points: • Solid strategic framework • Move to enhance market positioning • Growth down to bottom line • Further ahead on sustainability GrowthTrack record Governance Growth: Industrial Low risk Financial DividendGrowthTrack record Governance Industrial Development Development Waste Development Networks Development Energy
  • 19.
    Low risk FinancialDividend 15GRUPPOHERA Circular economy Customer experience Industry (Utility) 4.0 Our levers …New trends Waste Energy Networks Other Multi-utility GROWTHGROWTHGROWTHGROWTH EFFICIENCYEFFICIENCYEFFICIENCYEFFICIENCY EXCELLENCEEXCELLENCEEXCELLENCEEXCELLENCE INNOVATIONINNOVATIONINNOVATIONINNOVATION AGILITYAGILITYAGILITYAGILITY Confirming market leadership exploiting new opportunities Hera strategic focus GrowthTrack record Governance Industrial Development Development Waste Development Networks Development Energy
  • 20.
    16GRUPPOHERA +4.5% +4.6% +2.0%+8.2%Cagr 428 533 230 +105 +59 289 205 +22 226 21 +10 31 A'15 Networks Waste Energy Other E'20 884 1.080 Enhancing results in all core activities Maintaining our low risk profile Ebitda growth by ASA (M€) E’20 mix regulated/liberalized (%) RegulatedRegulatedRegulatedRegulated 57575757%%%% LiberalizedLiberalizedLiberalizedLiberalized 43434343%%%% GrowthTrack record Governance Low risk Financial Dividend Industrial Development Development Waste Development Networks Development Energy
  • 21.
    GRUPPOHERA WASTE The braces ofour strategy: • Growth • Agility • Innovation • Excellence • Efficiency
  • 22.
    289 230 +16 +73 (30) A'15 Collection TreatmentIncentives E'20 A further expansion in a growing market Deploying a solid platform and expertise Ebitda growth by business (M€) GRUPPOHERA 17 GrowthTrack record Governance Low risk Financial Dividend Industrial Development Development Waste Development Networks Development Energy
  • 23.
    A'15 E'20 Saved plant capacity 275kton 55% 66% Sorted Urb. W. increase freeing plant capacity Hera vs EU sustainability targets Recycling Energy Recovery45% 34% Regulated urban waste just achieved further savings Beyond UN agenda and EU targets on sustainability 18GRUPPOHERA HeraHeraHeraHeraEU targetEU targetEU targetEU target Urban WUrban WUrban WUrban W. inininin landfillslandfillslandfillslandfills Below 10% within 2030 Already today PackagingPackagingPackagingPackaging recyclingrecyclingrecyclingrecycling Above 65% within 2025 5Y in advance Urban WUrban WUrban WUrban W. recycledrecycledrecycledrecycled 65% within 2030 10Y in advance CIRCULAR ECONOMYCIRCULAR ECONOMYCIRCULAR ECONOMYCIRCULAR ECONOMY GrowthTrack record Governance Low risk Financial Dividend Industrial Development Development Waste Development Networks Development Energy
  • 24.
    143 230 A'15 E'16 E'17E'18 E'19 E'20 «One stop shop» for all customer’s issuesItalian treatment Infrastructure shortage Single service Benefit from an integrated platform and a growing demand Growing Special Waste exploiting market potentials 19GRUPPOHERA Waste mgmt “crisis” Proper infrastr. HeraHeraHeraHera Full service Business customers Waste emergency • Extensive landfill use prohibited • Shortage of other treatm. plants • UE penalties increased • Difficult authorization process for new plants GrowthTrack record Governance Low risk Financial Dividend Industrial Development Development Waste Development Networks Development Energy
  • 25.
    New horizons ofour waste management 20GRUPPOHERA GrowthTrack record Governance Low risk Financial Dividend Industrial Development Development Waste Development Networks Development Energy Pioneering transformation of Biogas into methaneAliplast: a step ahead in circular economy Contributing to Energy & Resource efficiency Business Customers Industrial Waste Products Biodigester Organic waste Cracking BiogasNaturalgas 7mcm/Y
  • 26.
    URBANURBANURBANURBAN WASTEWASTEWASTEWASTE SPECIALSPECIALSPECIALSPECIAL WASTEWASTEWASTEWASTE ENERGY RECOVER MATERIAL RECOVERMATERIALRECOVERMATERIAL RECOVERMATERIAL RECOVER REUSE SORTED COLLECTION OPTIMIZING PRODUCTIVE PROCESSES SPECIAL WASTE RECYCLE TREATMENT AND DISPOSAL Inerting systems (che-phy., WTE) On the black board: further move towards a Circular Economy paradigm … developing our leadership 21GRUPPOHERA GrowthTrack record Governance Low risk Financial Dividend Industrial Development Development Waste Development Networks Development Energy 66%66%66%66%
  • 27.
    GRUPPOHERA NETWORKS The braces ofour strategy: • Efficiency • Innovation • Growth • Excellence
  • 28.
    533 428 +10 +41 (25) +27 +52 A'15 SynergiesOrg. growth Wacc Tenders M&A E'20 Strengthening our regulated asset base Growing despite stable tariffs Ebitda growth drivers (M€) 22GRUPPOHERA GrowthTrack record Governance Low risk Financial Dividend Industrial Development Development Waste Development Networks Development Energy
  • 29.
    RegRegRegReg. periodperiodperiodperiod ConcessionConcessionConcessionConcession lengthlengthlengthlength RegRegRegReg. ReturnsReturnsReturnsReturns WaterWaterWaterWater ‘16-’18 ~’245.3%* GasGasGasGas distribdistribdistribdistrib. ‘16-’18 ‘17-’20 6.1% ElectricityElectricityElectricityElectricity distribdistribdistribdistrib. ‘16-’18 ~’30 5.6% 3.07 3.48 0.27 +0.11 0.37 +0,10 +0,30 A'15 Water Energy distr. 3rd parties E'20 3.9 3.3 Protected from the tariffs’ resilient WACC mechanism RAB growth profile (mergers’ effect not included) (B€) RegulatedRegulatedRegulatedRegulated returnsreturnsreturnsreturns 23GRUPPOHERA ReinvestmReinvestmReinvestmReinvestm. Rate in RABRate in RABRate in RABRate in RAB From 19% (avg last 3 years) to 25%25%25%25% Returns and RAB evolutions GrowthTrack record Governance Low risk Financial Dividend Industrial Development Development Waste Development Networks Development Energy Property RAB Third parties RAB Low risk and stable cash generator with a material hidden value
  • 30.
    Advanced Network monitoring Satellite scanning Radiometricmeasurem. Algorithm analysis Smart App interface Smart Water Modelling HergoReti OSCAR control system Pilot project to control sewerage water Sophisticated air conditioning to reduce nitrogen residuals Low energy consumptions Pilot project in FE for real time mgmt decision making Predictive system on networks function Prevention from critical operating conditions High tech content underpinning efficiency gains Exploiting synergies from Nets, big data and “smart” technologies 24GRUPPOHERA Hergoreti, new IT integrated system, improve all the scheduled and non- scheduled operating activities on plants and gas, water, energy, remote heating networks GrowthTrack record Governance Low risk Financial Dividend Industrial Development Development Waste Development Networks Development Energy
  • 31.
    On the blackboard: Industry (Utility) 4.0 trends add value… … to our main tangible assets 25GRUPPOHERA GrowthTrack record Governance Low risk Financial Dividend Industrial Development Development Waste Development Networks Development Energy
  • 32.
    GRUPPOHERA ENERGY The braces ofour strategy: • Growth • Intangible assets • Agility • Innovation
  • 33.
    Aiming at continuinggrowth Tackling with pressure on margins 226 205 (30) +21 +30 A'15 Mkt Competition Mkt Expansion External Growth E'20 Ebitda growth drivers (M€) 26GRUPPOHERA GrowthTrack record Governance Low risk Financial Dividend Industrial Development Development Waste Development Networks Development Energy
  • 34.
    Our solid Energycustomer base … … aiming at 3 million customers 1.327 857 A'15 E'20 Gas Electricity Customer base: filling the gap through cross selling (unit) Towards mkt liberalization: ongoing derisking (%) 73% 84% 28% 16% A'15 E'18 Free Mkt Protected Mkt 27GRUPPOHERA GrowthTrack record Governance Low risk Financial Dividend Industrial Development Development Waste Development Networks Development Energy ~1,400 ~1,000
  • 35.
    • Cost toserve (€/POD) • +200k Energy customers in the next 5Y • 25% digital customers Evolving our CRM to enhance the customer experience More potentials to our proactive marketing actions 28GRUPPOHERA Proactive Problem solving KPIs evolving considering more and more “soft” skills Tailored offers … at work enabling better assistance and cross selling Fast & Smart Strong language ID Customer Relationship Management system GrowthTrack record Governance Low risk Financial Dividend Industrial Development Development Waste Development Networks Development Energy 23,824,1 + 1.2 ( 1.5) A'15 Inflation Efficiency E'20
  • 36.
    Hera Enel Safeguarded Elect. andDefault gas supply in 11 regions Mkt expansion leveraging upon our nationwide presence Next 2 years results underpinned by won tenders Hera Enel 29GRUPPOHERA Energy Ebitda curve ‘15-E’20 expected (M€) 205 226 A '15 E'16 E'17 E'18 E'19 E'20 GrowthTrack record Governance Low risk Financial Dividend Industrial Development Development Waste Development Networks Development Energy New tenders
  • 37.
    Expanding the valueof our main intangible asset On the black board: focusing on Customer Experience 30GRUPPOHERA GrowthTrack record Governance Low risk Financial Dividend Industrial Development Development Waste Development Networks Development Energy
  • 38.
    Sensitivity to PUNpricesSensitivity to PUN pricesSensitivity to PUN pricesSensitivity to PUN prices (plus or minus 1€/MWh, impact in M€, % impact on Group Ebitda) GROUP EBITDAGROUP EBITDAGROUP EBITDAGROUP EBITDA Sensitivity to GDPSensitivity to GDPSensitivity to GDPSensitivity to GDP (plus or minus 1%, impact in M€, % impact on Group Ebitda) Sensitivity to Gas pricesSensitivity to Gas pricesSensitivity to Gas pricesSensitivity to Gas prices (plus or minus 1 Eurocent per cubic meter, impact in M€, % impact on Group Ebitda) GROUP EBITDAGROUP EBITDAGROUP EBITDAGROUP EBITDA 1111$/Barrel$/Barrel$/Barrel$/Barrel 1%1%1%1% 1111€€€€////MWhMWhMWhMWh 1111cccc€€€€/M/M/M/M3333 GROUP EBITDAGROUP EBITDAGROUP EBITDAGROUP EBITDA GROUP EBITDAGROUP EBITDAGROUP EBITDAGROUP EBITDA Sensitivity to oil pricesSensitivity to oil pricesSensitivity to oil pricesSensitivity to oil prices (dollar per barrel impact in M€, % impact on Group Ebitda) 31GRUPPOHERA Sensitivity highlights a resilient portfolio mix Low risk profile is core in our strategy GrowthTrack record Governance Low risk Financial Dividend <0.05M€ <0<0<0<0.01%01%01%01% 4.00M€ 0000.38383838%%%% 0.70M€ 0000,,,,07070707%%%% 0.50M€ 0000.05050505%%%% Industrial Development Development Waste Development Networks Development Energy
  • 39.
    325 289 317349 346 391 443 430 346 330 6 142 131 66 12 34 59 59391 461 606 536 455 A'11 A'12 A'13 A'14 A'15 F'16 E'17 E'18 E'19 E'20 Maint. Mergers Gas tenders Capex plan Capex plan to 2020: 2.45 b€ to grow and strengthen assets (M€) 32GRUPPOHERA Enhancing our main assets GrowthTrack record Governance Low risk Financial Dividend Industrial Development Development Waste Development Networks Development Energy
  • 40.
    Capex are mainlyfocused on regulated activities Targeting 8.3% ROI in 2020 22% 5% 69% NETWORKS WASTE CAPEX 2.45 b€ ENERGY 1,1x 1,2x 1,4x 1,2x 1,0x '16 '17 '18 '19 '20 Capex breakdown by business (%) Group Capex / Group Depreciation (x) 33GRUPPOHERA GrowthTrack record Governance Low risk Financial Dividend Industrial Development Development Waste Development Networks Development Energy
  • 41.
    Debt/Ebitda to 2020:strong CF improves fin. flexibility (M€) 34GRUPPOHERA Further Acquisitions sustainable with our financial flexibility Growth: Waste Growth: Networks Growth: Energy Growth: Industrial GrowthTrack record Governance Low risk Financial Dividend Max leverage Industrial Development Development Waste Development Networks Development Energy 3,1x 3,3x 3,2x 3,0x 3,0x ~2.9x 2,8x A'11 A'12 A'13 A'14 A'15 F'16 E'17 E'18 E'19 E'20 Financial structure
  • 42.
    Improving financial profile Achieving8.0% ROE in 2020 Cost of Debt (%) Tax rate (%) 4,0% 3,8% 3,7% 3,5% '14 '15 F'16 E'20 40,2% 38,4% ~36.5% 33,0% '14 '15 F'16 E'20 35GRUPPOHERA EPS growth New vs Old Plan (% of cumulated increase) GrowthTrack record Governance Low risk Financial Dividend 2014 2015 2016 2017 2018 2019 2020 Old Plan New Plan E’20 E’19 A’14 Adj. +30% +52% Industrial Development Development Waste Development Networks Development Energy
  • 43.
    GRUPPOHERA TOMASO TOMMASI DIVIGNANO Executive Chairman Key points: • Dividend Policy • Closing remarks
  • 44.
    9,0 9,0 9,09,0 9,0 9,0 9,5 9,5 10,0 10,0 '11 '12 '13 '14 '15 '16 '17 '18 '19 '20 Dividend policy 100% 88% 76% 79% 73% 66% '11 '12 '13 '14 '15 '16 '17 '18 '19 '20 DPS (€c) Payout ratio (%) 36GRUPPOHERA Providing DPS growth still betting on an external growth story Hera’s dividend qualityHera’s dividend qualityHera’s dividend qualityHera’s dividend quality Unique track recordUnique track recordUnique track recordUnique track record • Always guaranteed • Never decreased • Transparent policy Potential upside for shareholdersPotential upside for shareholdersPotential upside for shareholdersPotential upside for shareholders • Room to fund mergers with “Buy back”“Buy back”“Buy back”“Buy back” shares Hera included in “Aristocrats ETF” (with Atlantia and Recordati) GrowthTrack record Governance Low risk Financial Dividend Industrial Development Development Waste Development Networks Development Energy
  • 45.
    Closing remarks Investor Relationscontacts: Mail: ir@gruppohera.it +39 051 287040 Head of IR Jens Klint Hansen jens.hansen@gruppohera.it • Solid premises to lead industry changes • Continuing a safe growth through our “two pillar” business model • High visibility on growing shareholders return GRUPPOHERA GrowthTrack record Governance Low risk Financial Dividend Industrial Development Development Waste Development Networks Development Energy 37
  • 46.
  • 47.
    Main assumptionsMain assumptionsMainassumptionsMain assumptions A’A’A’A’14141414 A’15A’15A’15A’15 E’20E’20E’20E’20 BrentBrentBrentBrent (Dollar/Barrel) 99.5 53.7 55.0 Exchange ratioExchange ratioExchange ratioExchange ratio €/$ 1.33 1.11 1.10 PUNPUNPUNPUN (€/MWh) 52.1 52.3 52.5 InflationInflationInflationInflation (5Y moving average) 0.2% 0% 1.0% Green certificateGreen certificateGreen certificateGreen certificate –––– biomass plantsbiomass plantsbiomass plantsbiomass plants (€/MWh) 97.4 99.5 80.3 Green certificateGreen certificateGreen certificateGreen certificate –––– other plantsother plantsother plantsother plants (€/MWh) 97.4 99.5 101.0 White certificatesWhite certificatesWhite certificatesWhite certificates (€/TEP) 106.2 106.1 115.5 COCOCOCO2222 certificatescertificatescertificatescertificates (€/ton) 7.2 8.2 11.0 Tax rateTax rateTax rateTax rate (%) 40.2% 38.4% 33% Cost of DebtCost of DebtCost of DebtCost of Debt (%) 4.0% 3.8% 3.5% 38GRUPPOHERA Business Plan main assumptions
  • 48.
    Ebit by strategicarea (M€) 100 131 205 6 442M€ A’15 E’20 125 146 238 16 525M€ Waste EnergyNetworks 39GRUPPOHERA Consolidated Group Ebit target
  • 49.
    40,0 659,970,8 52,5 448,0 48,6 2.593,73,253.6 '16 '17 '18 '19 '20 Post Gross Debt Gross debt maturities (M€) Interest rate breakdown in 2020 (%) 36% 64% Variable Fixed Rates 40GRUPPOHERA Financial Debt 2,594
  • 50.
    An unique, effective& reliable “two pillar business model” 192 884 +296 +396 A'02 M&A Org. Growth & Synergies A'15 Ebitda Growth by 4.6x: drivers (M€) 20-25% avg. synergy extraction Organic Growth & Synergies always positive (M€) 396 +50 +25 +29 +23 +21 +60 +23 +40 +29 +11 +38 +18 +29 A'02 A'15 Tot. 296 +25 +65 +18 +6 +15 +16 (16) +6 +110 +13 +14 A'15 Tot. Avg. Growth per annum: +31 m€ Avg. Growth per annum: +23 m€ Constant M&A contribution to Ebitda (M€) 22 deals executed Outstanding & constant track record 41GRUPPOHERA Track record of Hera’s “two pillar” Business model
  • 51.
    WaterWaterWaterWater Awarded with quality premium More efficient seweragewater plants (new in Trieste and Rimini e 6 other plants refurbished) Energy efficiency &Energy efficiency &Energy efficiency &Energy efficiency & Climate changeClimate changeClimate changeClimate change Energy connsumptions -5% within ‘20 Offers to assist customers deploying our expertice Bio-digester to produce “bio- methane” with lower emissions EnvironmentEnvironmentEnvironmentEnvironment 65% of urban waste recycling within ‘20 +4% CAGR elect. generation from renewables (70% of total generation) WorkWorkWorkWork • New welfare system • Internal climate: 65/100 • -3% accidents 42GRUPPOHERA Some more sustainability ahead (’20 targets)
  • 52.
    EconomicsEconomicsEconomicsEconomics (M€) Capex E’16-E’20: 545m€ (M€) Ebitda Breakdown (M€) Highlights (M€) A'15 E'16 E'17 E'18 E'19 E'20 230 289 A'15 E'20 Collection Treatment * Excluding volumes from M&A A’15A’15A’15A’15 E’20E’20E’20E’20 EBITDAEBITDAEBITDAEBITDA 230.0 288288288288.6666 EBITEBITEBITEBIT 99.0 125125125125.0000 A’15 E’20 Waste treated 6,226 7,774 Urban 2,041 1,963 Special 2,002 3,217 by products 2,183 2,593 43GRUPPOHERA Waste business
  • 53.
    A'15 E'16 E'17E'18 E'19 E'20 Capex E’16-E’20: 745 m€ (M€) Volumes sold (Mmc) RAB (M€) EconomicsEconomicsEconomicsEconomics (M€) A’A’A’A’15151515 E’20E’20E’20E’20 EBITDAEBITDAEBITDAEBITDA 232.5 283283283283.5555 EBITEBITEBITEBIT 117.1 114114114114.5555 A’15 E’20 RAB* 1,407 1,507 300 295 A'15 E'20 *Numbers exclude M&A 44GRUPPOHERA Water business *Numbers exclude M&A
  • 54.
    M€ 2014 Adj.E2019 Cagr Ebitda 269.7 308.9 +2.8% Ebit 171.2 175.3 +0.5% A'15 E'16 E'17 E'18 E'19 E'20 Capex Gas Tenders Economics (M€) Capex E’16-E’20: 924 m€ (M€) Ebitda Breakdown (M€) 296 348 A'15 E'20 Gas distribution Gas sales District Heating Heat Management *Numbers include gas tenders and exclude M&A and third parties RAB EconomicsEconomicsEconomicsEconomics (M€) A’A’A’A’15151515 E’20E’20E’20E’20 EBITDAEBITDAEBITDAEBITDA 295.8 348348348348.4444 EBITEBITEBITEBIT 181.1 198198198198.0000 Highlights A’15 E’20 Volume Sales &Trading (Mcm) 3,383 3,224 RAB* (gas distr.+D.H. in m€) 1,266 1,579 45GRUPPOHERA Gas business
  • 55.
    A'15 E'16 E'17E'18 E'19 E'20 Capex E’16-E’20: 159 m€ (M€) Ebitda Breakdown (M€) Highlights A'15 E'20 EE Distribution EE Sales Other A’15A’15A’15A’15 E’20E’20E’20E’20 EBITDAEBITDAEBITDAEBITDA 101.0 127127127127.5555 EBITEBITEBITEBIT 38.2 71717171.6666 A’15 E’20 Volume Sold (TWh) 9.6 9.4 RAB* (m€) 361 351 105 127 EconomicsEconomicsEconomicsEconomics (M€) *Numbers exclude M&A 46GRUPPOHERA Electricity business
  • 56.
    This presentation containsforward-looking statements regarding future events (which impact the Hera Group’s future results) that are based on current expectations, estimates and opinions of management. These forward-looking statements are subject to risks, uncertainties and events that are unpredictable and depend on circumstances that might change in future. As a result, any expectation on Group results and estimates set out in this presentation may differ significantly depending on changes in the unpredictable circumstances on which they are based. Therefore, any forward -looking statement made by or on behalf of the Hera Group refer on the date they are made. The Hera Group shall not undertake to update forward-looking statements to reflect any changes in the Group’s expectations or in the events, conditions or circumstances on which any such statements are based. Nevertheless, the Hera Group has a “profit warning policy” , in accordance with Italian laws, that shall notify the market (under “price-sensitive” communication rules) regarding any “sensible change” that might occur in Group expectations on future results. 47GRUPPOHERA Disclaimer