Download to read offline
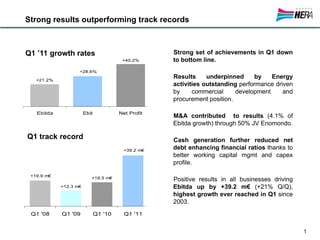
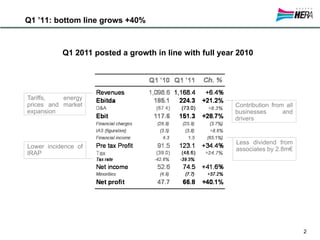
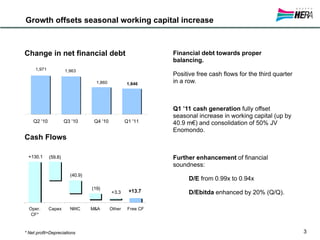
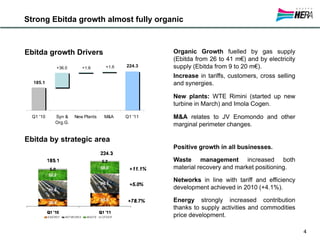
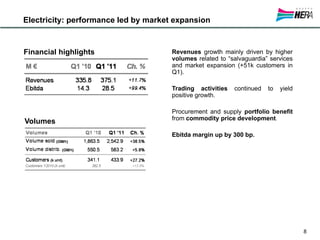
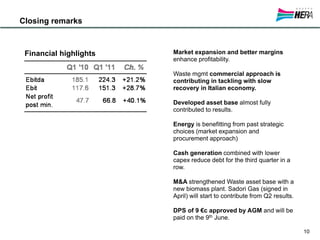

Hera Group reported strong Q1 2011 results that outperformed previous records. EBITDA grew 21% compared to Q1 2010, driven by outstanding performance in energy activities from commercial development and procurement. M&A also contributed to growth. Positive results across all business areas led to higher profits and cash flows that reduced net debt and strengthened financial ratios.


