Download as PDF, PPTX

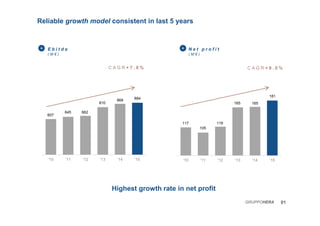
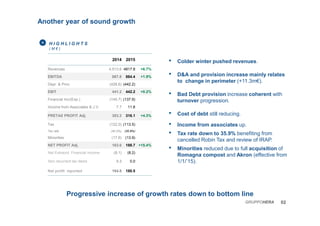
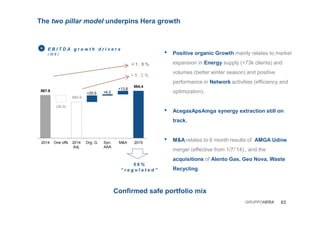
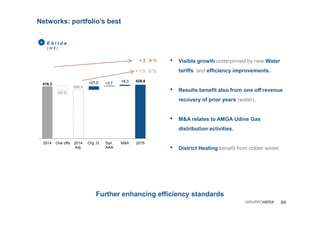
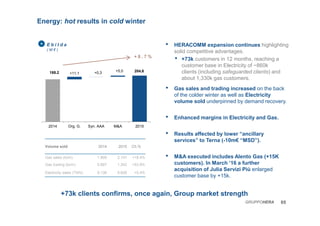
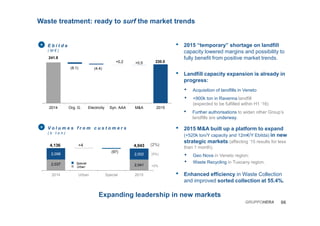
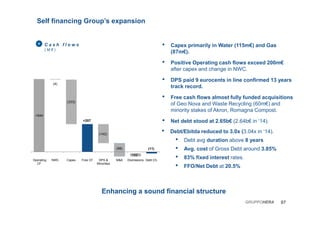


- Hera Group reported another year of sound growth in 2015, with revenues increasing 6.7% to €4.8 billion and net profit rising 15.4% to €188.7 million. - EBITDA grew 1.9% to €884.4 million, driven by organic growth, synergies from acquisitions, and contributions from recent M&A activity. - The results demonstrate the reliability of Hera's growth model, with consistent increases in key financial figures over the past 5 years.


