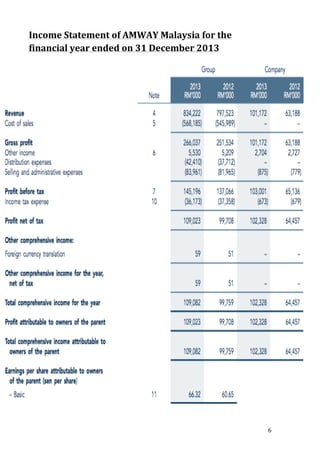
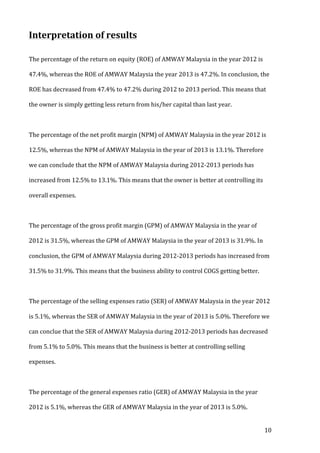
1 
SCHOOL 
OF 
ARCHITECTURE, 
BUILDING 
AND 
DESIGN 
FOUNDATION 
IN 
NATURAL 
AND 
BUILT 
ENVIRONMENT 
FEBRUARY 
2014 
/ 
SEMESTER 
2 
STUDENTS 
NAME: 
-­‐ 
DARREN 
LOONG 
CHI 
YOONG 
(0318029) 
-­‐ 
TAN 
ZHAO 
MING 
(0318724) 
-­‐ 
HOOI 
ZHAO 
HONG 
(0318524) 
MODULE: 
BASIC 
ACCOUNTING 
(ACC30205) 
LECTURER: 
MR. 
CHANG 
JAU 
HO 
ASSIGNMENT 
TITLE: 
FINANCIAL 
RATIO 
ANALYSIS 
(AMWAY 
MALAYSIA) 
WORD 
COUNT: 
1162 
SUBMISSION 
DATE: 
13TH 
NOVEMBER 
2014
2 
CONTENTS 
History and Recent Developments ……………………………………… 3 
Income Statement and Balance Sheet …………………………………… 4 - 7 
Profitability Ratios ......………………………………………………....... 8 
Stability Ratios ........................................................................................... 9 
Interpretation of Results ............................................................................. 10 -11 
Price/Earning Ratio & Investment Recommendation................................. 12 -13 
References.................................................................................................... 14
History 
of 
AMWAY 
Malaysia 
Amway 
Malaysia 
started 
its 
distribution 
services 
in 
1976 
with 
only 
five 
staffs 
in 
a 
small 
office 
and 
warehouse 
facility 
in 
Jalan 
Ipoh. 
In 
that 
year, 
Amway 
Malaysia 
was 
one 
of 
the 
earliest 
direct 
selling 
industries 
in 
the 
country. 
AMWAY 
Malaysia 
was 
the 
first 
direct 
selling 
company 
to 
be 
listed 
on 
the 
Main 
Board 
of 
the 
Kuala 
Lumpur 
Stock 
Exchange 
in 
1996. 
On 
the 
other 
hand, 
the 
Ministry 
of 
Domestic 
Cooperatives 
and 
Consumerism 
awarded 
a 
10-­‐year 
Direct 
Selling 
License 
AMWAY 
Malaysia 
in 
2010, 
being 
the 
first 
to 
achieve 
this 
feat. 
3 
Recent 
Developments 
One 
of 
the 
most 
recent 
developments 
by 
AMWAY 
Malaysia 
is 
the 
new 
smartphone 
application 
create 
by 
them, 
which 
is 
called 
‘AMWAY 
Central 
App’. 
The 
main 
function 
of 
the 
application 
is 
to 
provide 
updates 
and 
tools 
of 
AMWAY 
products. 
For 
example, 
for 
AMWAY 
users 
that 
owns 
an 
eSpring, 
which 
is 
a 
water 
filtration 
system 
by 
AMWAY, 
the 
application 
provides 
tips 
for 
the 
users 
to 
maintain 
the 
functioning 
of 
their 
eSpring 
system 
and 
to 
also 
enhance 
the 
knowledge 
of 
users 
to 
know 
the 
importance 
of 
clean 
water 
and 
share 
it 
with 
others 
that 
does 
not 
own 
an 
eSpring 
yet. 
AMWAY 
Malaysia 
will 
also 
be 
celebrating 
the 
Amway 
Universal 
Children's 
Day 
on 
20th 
November 
2013, 
having 
to 
launch 
the 
AMWAY 
One 
By 
One 
campaign 
back 
in 
2003. 
Through 
the 
campaign, 
many 
of 
AMWAY's 
distributors 
and 
employees 
have 
travelled 
to 
over 
50 
countries 
where 
the 
children 
are 
in 
need 
of 
help. 
They 
have 
conducted 
over 
300 
projects 
to 
brighten 
the 
children's 
future 
by 
building 
homes 
for 
them, 
giving 
them 
free 
education 
and 
all 
physiological 
needs.
4 
Income 
Statement 
of 
AMWAY 
Malaysia 
for 
the 
financial 
year 
ended 
at 
31 
December 
2012
5 
Balance 
Sheet 
of 
AMWAY 
Malaysia 
as 
at 
31 
December 
2012
6 
Income 
Statement 
of 
AMWAY 
Malaysia 
for 
the 
financial 
year 
ended 
on 
31 
December 
2013
7 
Balance 
Sheet 
of 
AMWAY 
Malaysia 
as 
at 
31 
December 
2013
8 
Profitability 
Ratios 
Profiability 
ratio 
2012 
2013 
Return 
on 
Equity 
(ROE) 
99708000 
(227971000 + 192322000)/2 
× 100% 
= 
47.4% 
109023000 
234311000 + 227971000/2 
× 100% 
= 
47.2% 
Net 
Profit 
Margin 
(NPM) 
99708000 
797523000 
× 100% 
= 
12.5% 
109023000 
834222000 
×100% 
= 
13.1% 
Gross 
Profit 
Margin 
(GPM) 
251534000 
797523000 
× 100% 
= 
31.5% 
266037000 
834222000 
×100% 
= 
31.9% 
Selling 
Expense 
Ratio 
(SER) 
81965000/2 
797523000 
× 100% 
= 
5.1% 
83961000/2 
834222000 
×100% 
= 
5.0% 
General 
Expense 
Ratio 
(GER) 
81965000/2 
797523000 
× 100% 
= 
5.1% 
83961000/2 
834222000 
×100% 
= 
5.0%
9 
Stability 
Ratios 
Stability 
ratios 
2012 
2013 
Working 
Capital 
(WCR) 
248629000 
106591000 
= 
2.33 
: 
1 
247743000 
94599000 
= 
2.62 
: 
1 
Total 
Debt 
(TDR) 
106617000 
334588000 
×100% 
= 
31.9% 
94629000 
328940000 
×100% 
= 
28.8% 
Stock 
Turnover 
(ITR) 
365 
days 
÷ 
!"!#$#%%% 
(!"#$%###!!"#$%&&&)/! 
= 45.6 days 
365 
days 
÷ 
!"#$#!%%% 
(!"!#$%%%!!"#$%###)/! 
= 
42.6 
days
10 
Interpretation 
of 
results 
The 
percentage 
of 
the 
return 
on 
equity 
(ROE) 
of 
AMWAY 
Malaysia 
in 
the 
year 
2012 
is 
47.4%, 
whereas 
the 
ROE 
of 
AMWAY 
Malaysia 
the 
year 
2013 
is 
47.2%. 
In 
conclusion, 
the 
ROE 
has 
decreased 
from 
47.4% 
to 
47.2% 
during 
2012 
to 
2013 
period. 
This 
means 
that 
the 
owner 
is 
simply 
getting 
less 
return 
from 
his/her 
capital 
than 
last 
year. 
The 
percentage 
of 
the 
net 
profit 
margin 
(NPM) 
of 
AMWAY 
Malaysia 
in 
the 
year 
2012 
is 
12.5%, 
whereas 
the 
NPM 
of 
AMWAY 
Malaysia 
in 
the 
year 
of 
2013 
is 
13.1%. 
Therefore 
we 
can 
conclude 
that 
the 
NPM 
of 
AMWAY 
Malaysia 
during 
2012-­‐2013 
periods 
has 
increased 
from 
12.5% 
to 
13.1%. 
This 
means 
that 
the 
owner 
is 
better 
at 
controlling 
its 
overall 
expenses. 
The 
percentage 
of 
the 
gross 
profit 
margin 
(GPM) 
of 
AMWAY 
Malaysia 
in 
the 
year 
of 
2012 
is 
31.5%, 
whereas 
the 
GPM 
of 
AMWAY 
Malaysia 
in 
the 
year 
of 
2013 
is 
31.9%. 
In 
conclusion, 
the 
GPM 
of 
AMWAY 
Malaysia 
during 
2012-­‐2013 
periods 
has 
increased 
from 
31.5% 
to 
31.9%. 
This 
means 
that 
the 
business 
ability 
to 
control 
COGS 
getting 
better. 
The 
percentage 
of 
the 
selling 
expenses 
ratio 
(SER) 
of 
AMWAY 
Malaysia 
in 
the 
year 
2012 
is 
5.1%, 
whereas 
the 
SER 
of 
AMWAY 
Malaysia 
in 
the 
year 
of 
2013 
is 
5.0%. 
Therefore 
we 
can 
conclue 
that 
the 
SER 
of 
AMWAY 
Malaysia 
during 
2012-­‐2013 
periods 
has 
decreased 
from 
5.1% 
to 
5.0%. 
This 
means 
that 
the 
business 
is 
better 
at 
controlling 
selling 
expenses. 
The 
percentage 
of 
the 
general 
expenses 
ratio 
(GER) 
of 
AMWAY 
Malaysia 
in 
the 
year 
2012 
is 
5.1%, 
whereas 
the 
GER 
of 
AMWAY 
Malaysia 
in 
the 
year 
of 
2013 
is 
5.0%.
Therefore 
we 
can 
conclue 
that 
the 
GER 
of 
AMWAY 
Malaysia 
during 
2012-­‐2013 
periods 
has 
decreased 
from 
5.1% 
to 
5.0%. 
This 
means 
that 
the 
business 
is 
better 
at 
controlling 
general 
expenses. 
The 
Ratio 
of 
the 
working 
capital 
(WCR) 
of 
AMWAY 
Malaysia 
in 
the 
year 
2012 
is 
2.33:1, 
whereas 
the 
WCR 
of 
AMWAY 
Malaysia 
in 
the 
year 
of 
2013 
is 
2.62:1. 
In 
conclusion, 
the 
WCR 
of 
AMWAY 
Malaysia 
during 
2012-­‐2013 
periods 
has 
increased 
from 
2.33:1 
to 
2.62:1. 
This 
means 
that 
the 
business 
ability 
to 
pay 
current 
liabilities 
with 
current 
assets 
is 
getting 
better. 
In 
addition, 
it 
does 
satisfy 
the 
minimum 
payment 
of 
2:1. 
11 
The 
percentage 
of 
total 
Debt 
(TDR) 
of 
AMWAY 
Malaysia 
in 
the 
year 
2012 
is 
31.9%, 
whereas 
the 
TDR 
of 
AMWAY 
Malaysia 
in 
the 
year 
of 
2013 
is 
28.8%. 
In 
conclusion 
the 
TDR 
of 
AMWAY 
Malaysia 
during 
2012-­‐2013 
periods 
has 
decreased 
from 
31.9% 
to 
28.8%. 
This 
means 
that 
the 
business 
overall 
liability 
has 
reduced. 
Therefore 
it 
is 
not 
over 
50% 
maximum 
limit. 
The 
days 
of 
stock 
turnover 
(ITR) 
of 
AMWAY 
Malaysia 
in 
the 
year 
2012 
is 
45.6 
days, 
whereas 
the 
ITR 
of 
AMWAY 
Malaysia 
in 
the 
year 
of 
2013 
is 
42.6 
days. 
In 
conclusion 
the 
ITR 
of 
AMWAY 
Malaysia 
during 
2012-­‐2013 
periods 
has 
decreased 
from 
45.6 
days 
to 
42.6 
days. 
This 
means 
the 
business 
is 
selling 
it's 
product 
at 
a 
faster 
rate.
12 
Price/Earning 
(P/E) 
Ratio 
Share 
price 
of 
AMWAY 
Malaysia 
as 
at 
12th 
November 
2014: 
RM 
11.560 
Earnings 
per 
share 
of 
AMWAY 
Malaysia 
as 
at 
12th 
November 
2014: 
RM 
0.64 
!" !!.!" 
!" !.!" 
= 
P/E 
Ratio= 
18.06 
times 
Interpretation: 
As 
it 
can 
be 
seen 
from 
the 
P/E 
ratio 
calculated 
above, 
the 
outcome 
is 
18.06 
times. 
This 
means 
that 
the 
share 
price 
of 
AMWAY 
Malaysia 
is 
high 
and 
if 
an 
investor 
purchases 
the 
share 
of 
AMWAY 
Malaysia, 
he 
would 
have 
to 
wait 
for 
18 
years 
to 
recoup 
his 
investment. 
Investment 
Recommendation 
Based 
on 
the 
profitability 
ratios 
calculated, 
most 
of 
the 
ratios 
have 
good 
outcomes 
and 
it 
has 
improved 
during 
the 
2012-­‐2013 
period, 
except 
for 
the 
return 
on 
equity, 
where 
the 
shareholder 
is 
getting 
less 
from 
his 
capital. 
Looking 
at 
the 
other 
ratios, 
such 
as 
the 
net 
profit 
margin, 
gross 
profit 
margin, 
selling 
expenses 
ratio 
and 
general 
expenses 
ratio, 
the 
overall 
profitability 
ratio 
seems 
to 
be 
stable 
and 
the 
shareholder 
are 
benefiting 
based 
on 
the 
calculation 
of 
the 
ratios. 
As 
for 
the 
stability 
ratios 
on 
the 
other 
hand, 
the 
calculation 
shows 
that 
there 
are 
good 
outcomes 
of 
the 
working 
capital, 
total 
debt 
as 
well 
as 
the 
stock 
turnover. 
All 
of 
the 
outcomes 
are 
getting 
better 
during 
the 
2012-­‐2013 
period. 
Based 
on 
both 
the 
profitability 
ratios 
and 
the 
stability 
ratios, 
it 
can 
be 
seen 
that 
AMWAY 
Malaysia 
has 
not 
made 
much 
loss 
during 
the 
2012-­‐2013 
period. 
Finally, 
the 
share 
price 
of 
AMWAY 
Malaysia 
seems 
to 
be 
high 
at 
RM 
11.56. 
The 
earnings 
per 
share 
are 
also 
considered 
low. 
Having 
a 
high 
share 
price 
and 
low 
earnings 
per 
share 
can 
result 
in 
a 
high 
P/E 
ratio. 
The 
current 
P/E 
ratio 
of 
AMWAY 
Malaysia 
is 
18.06 
times. 
If 
an 
investor 
were 
to 
purchase 
the 
shares 
of 
AMWAY 
Malaysia, 
he 
would 
have 
to 
wait 
for 
18 
years 
to 
recoup 
his 
investment. 
A 
conservative 
investor 
would 
purchase 
a 
share 
with 
a 
P/E 
ratio 
of 
15 
times 
or 
less.
In 
conclusion, 
an 
investment 
in 
AMWAY 
Malaysia 
doesn't 
look 
as 
bad 
as 
it 
is 
because 
overall 
the 
company 
is 
doing 
very 
well 
year 
by 
year 
and 
they 
always 
strive 
to 
improve 
every 
period. 
The 
stability 
ratios 
and 
profitabilty 
ratios 
has 
proved 
it. 
The 
biggest 
downside 
of 
investing 
in 
AMWAY 
Malaysia 
is 
to 
have 
a 
high 
P/E 
ratio. 
Overall, 
we 
would 
not 
recommend 
an 
investment 
in 
AMWAY 
Malaysia 
because 
the 
share 
price 
is 
high, 
which 
makes 
the 
P/E 
ratio 
too 
high 
for 
a 
good 
investment. 
13
References 
1. 
AMWAY 
Malaysia 
Annual 
Report 
2012 
-­‐ 
http://announcements.bursamalaysia.com/EDMS/subweb.nsf/all/F19737F1 
6D107C2648257B5D00355F68/$File/AMWAY-­‐AnnualReport2012.pdf. 
14 
Site 
accessed 
on 
10th 
November 
2014. 
2. 
AMWAY 
Malaysia 
Annual 
Report 
2013 
-­‐ 
http://announcements.bursamalaysia.com/EDMS/subweb.nsf/all/A85A5F06 
21D3395948257CBB0032ED02/$File/AMWAY-­‐AnnualReport2013.pdf. 
Site 
accessed 
on 
10th 
November 
2014 
3. 
AMWAY 
Malaysia 
Share 
Price 
-­‐ 
http://www.bursamalaysia.com/market/listed-­‐companies/list-­‐of-­‐ 
companies/plc-­‐profile.html?stock_code=6351. 
Site 
accessed 
on 
11th 
November 
2014 
4. 
AMWAY 
Malaysia 
Share 
Price 
and 
Financial 
Information 
-­‐ 
http://www.malaysiastock.biz/Corporate-­‐ 
Infomation.aspx?type=A&value=A&securityCode=6351. 
Site 
accessed 
on 
12th 
November 
2014

Basic accounting assignment

  • 1.
    1 SCHOOL OF ARCHITECTURE, BUILDING AND DESIGN FOUNDATION IN NATURAL AND BUILT ENVIRONMENT FEBRUARY 2014 / SEMESTER 2 STUDENTS NAME: -­‐ DARREN LOONG CHI YOONG (0318029) -­‐ TAN ZHAO MING (0318724) -­‐ HOOI ZHAO HONG (0318524) MODULE: BASIC ACCOUNTING (ACC30205) LECTURER: MR. CHANG JAU HO ASSIGNMENT TITLE: FINANCIAL RATIO ANALYSIS (AMWAY MALAYSIA) WORD COUNT: 1162 SUBMISSION DATE: 13TH NOVEMBER 2014
  • 2.
    2 CONTENTS Historyand Recent Developments ……………………………………… 3 Income Statement and Balance Sheet …………………………………… 4 - 7 Profitability Ratios ......………………………………………………....... 8 Stability Ratios ........................................................................................... 9 Interpretation of Results ............................................................................. 10 -11 Price/Earning Ratio & Investment Recommendation................................. 12 -13 References.................................................................................................... 14
  • 3.
    History of AMWAY Malaysia Amway Malaysia started its distribution services in 1976 with only five staffs in a small office and warehouse facility in Jalan Ipoh. In that year, Amway Malaysia was one of the earliest direct selling industries in the country. AMWAY Malaysia was the first direct selling company to be listed on the Main Board of the Kuala Lumpur Stock Exchange in 1996. On the other hand, the Ministry of Domestic Cooperatives and Consumerism awarded a 10-­‐year Direct Selling License AMWAY Malaysia in 2010, being the first to achieve this feat. 3 Recent Developments One of the most recent developments by AMWAY Malaysia is the new smartphone application create by them, which is called ‘AMWAY Central App’. The main function of the application is to provide updates and tools of AMWAY products. For example, for AMWAY users that owns an eSpring, which is a water filtration system by AMWAY, the application provides tips for the users to maintain the functioning of their eSpring system and to also enhance the knowledge of users to know the importance of clean water and share it with others that does not own an eSpring yet. AMWAY Malaysia will also be celebrating the Amway Universal Children's Day on 20th November 2013, having to launch the AMWAY One By One campaign back in 2003. Through the campaign, many of AMWAY's distributors and employees have travelled to over 50 countries where the children are in need of help. They have conducted over 300 projects to brighten the children's future by building homes for them, giving them free education and all physiological needs.
  • 4.
    4 Income Statement of AMWAY Malaysia for the financial year ended at 31 December 2012
  • 5.
    5 Balance Sheet of AMWAY Malaysia as at 31 December 2012
  • 6.
    6 Income Statement of AMWAY Malaysia for the financial year ended on 31 December 2013
  • 7.
    7 Balance Sheet of AMWAY Malaysia as at 31 December 2013
  • 8.
    8 Profitability Ratios Profiability ratio 2012 2013 Return on Equity (ROE) 99708000 (227971000 + 192322000)/2 × 100% = 47.4% 109023000 234311000 + 227971000/2 × 100% = 47.2% Net Profit Margin (NPM) 99708000 797523000 × 100% = 12.5% 109023000 834222000 ×100% = 13.1% Gross Profit Margin (GPM) 251534000 797523000 × 100% = 31.5% 266037000 834222000 ×100% = 31.9% Selling Expense Ratio (SER) 81965000/2 797523000 × 100% = 5.1% 83961000/2 834222000 ×100% = 5.0% General Expense Ratio (GER) 81965000/2 797523000 × 100% = 5.1% 83961000/2 834222000 ×100% = 5.0%
  • 9.
    9 Stability Ratios Stability ratios 2012 2013 Working Capital (WCR) 248629000 106591000 = 2.33 : 1 247743000 94599000 = 2.62 : 1 Total Debt (TDR) 106617000 334588000 ×100% = 31.9% 94629000 328940000 ×100% = 28.8% Stock Turnover (ITR) 365 days ÷ !"!#$#%%% (!"#$%###!!"#$%&&&)/! = 45.6 days 365 days ÷ !"#$#!%%% (!"!#$%%%!!"#$%###)/! = 42.6 days
  • 10.
    10 Interpretation of results The percentage of the return on equity (ROE) of AMWAY Malaysia in the year 2012 is 47.4%, whereas the ROE of AMWAY Malaysia the year 2013 is 47.2%. In conclusion, the ROE has decreased from 47.4% to 47.2% during 2012 to 2013 period. This means that the owner is simply getting less return from his/her capital than last year. The percentage of the net profit margin (NPM) of AMWAY Malaysia in the year 2012 is 12.5%, whereas the NPM of AMWAY Malaysia in the year of 2013 is 13.1%. Therefore we can conclude that the NPM of AMWAY Malaysia during 2012-­‐2013 periods has increased from 12.5% to 13.1%. This means that the owner is better at controlling its overall expenses. The percentage of the gross profit margin (GPM) of AMWAY Malaysia in the year of 2012 is 31.5%, whereas the GPM of AMWAY Malaysia in the year of 2013 is 31.9%. In conclusion, the GPM of AMWAY Malaysia during 2012-­‐2013 periods has increased from 31.5% to 31.9%. This means that the business ability to control COGS getting better. The percentage of the selling expenses ratio (SER) of AMWAY Malaysia in the year 2012 is 5.1%, whereas the SER of AMWAY Malaysia in the year of 2013 is 5.0%. Therefore we can conclue that the SER of AMWAY Malaysia during 2012-­‐2013 periods has decreased from 5.1% to 5.0%. This means that the business is better at controlling selling expenses. The percentage of the general expenses ratio (GER) of AMWAY Malaysia in the year 2012 is 5.1%, whereas the GER of AMWAY Malaysia in the year of 2013 is 5.0%.
  • 11.
    Therefore we can conclue that the GER of AMWAY Malaysia during 2012-­‐2013 periods has decreased from 5.1% to 5.0%. This means that the business is better at controlling general expenses. The Ratio of the working capital (WCR) of AMWAY Malaysia in the year 2012 is 2.33:1, whereas the WCR of AMWAY Malaysia in the year of 2013 is 2.62:1. In conclusion, the WCR of AMWAY Malaysia during 2012-­‐2013 periods has increased from 2.33:1 to 2.62:1. This means that the business ability to pay current liabilities with current assets is getting better. In addition, it does satisfy the minimum payment of 2:1. 11 The percentage of total Debt (TDR) of AMWAY Malaysia in the year 2012 is 31.9%, whereas the TDR of AMWAY Malaysia in the year of 2013 is 28.8%. In conclusion the TDR of AMWAY Malaysia during 2012-­‐2013 periods has decreased from 31.9% to 28.8%. This means that the business overall liability has reduced. Therefore it is not over 50% maximum limit. The days of stock turnover (ITR) of AMWAY Malaysia in the year 2012 is 45.6 days, whereas the ITR of AMWAY Malaysia in the year of 2013 is 42.6 days. In conclusion the ITR of AMWAY Malaysia during 2012-­‐2013 periods has decreased from 45.6 days to 42.6 days. This means the business is selling it's product at a faster rate.
  • 12.
    12 Price/Earning (P/E) Ratio Share price of AMWAY Malaysia as at 12th November 2014: RM 11.560 Earnings per share of AMWAY Malaysia as at 12th November 2014: RM 0.64 !" !!.!" !" !.!" = P/E Ratio= 18.06 times Interpretation: As it can be seen from the P/E ratio calculated above, the outcome is 18.06 times. This means that the share price of AMWAY Malaysia is high and if an investor purchases the share of AMWAY Malaysia, he would have to wait for 18 years to recoup his investment. Investment Recommendation Based on the profitability ratios calculated, most of the ratios have good outcomes and it has improved during the 2012-­‐2013 period, except for the return on equity, where the shareholder is getting less from his capital. Looking at the other ratios, such as the net profit margin, gross profit margin, selling expenses ratio and general expenses ratio, the overall profitability ratio seems to be stable and the shareholder are benefiting based on the calculation of the ratios. As for the stability ratios on the other hand, the calculation shows that there are good outcomes of the working capital, total debt as well as the stock turnover. All of the outcomes are getting better during the 2012-­‐2013 period. Based on both the profitability ratios and the stability ratios, it can be seen that AMWAY Malaysia has not made much loss during the 2012-­‐2013 period. Finally, the share price of AMWAY Malaysia seems to be high at RM 11.56. The earnings per share are also considered low. Having a high share price and low earnings per share can result in a high P/E ratio. The current P/E ratio of AMWAY Malaysia is 18.06 times. If an investor were to purchase the shares of AMWAY Malaysia, he would have to wait for 18 years to recoup his investment. A conservative investor would purchase a share with a P/E ratio of 15 times or less.
  • 13.
    In conclusion, an investment in AMWAY Malaysia doesn't look as bad as it is because overall the company is doing very well year by year and they always strive to improve every period. The stability ratios and profitabilty ratios has proved it. The biggest downside of investing in AMWAY Malaysia is to have a high P/E ratio. Overall, we would not recommend an investment in AMWAY Malaysia because the share price is high, which makes the P/E ratio too high for a good investment. 13
  • 14.
    References 1. AMWAY Malaysia Annual Report 2012 -­‐ http://announcements.bursamalaysia.com/EDMS/subweb.nsf/all/F19737F1 6D107C2648257B5D00355F68/$File/AMWAY-­‐AnnualReport2012.pdf. 14 Site accessed on 10th November 2014. 2. AMWAY Malaysia Annual Report 2013 -­‐ http://announcements.bursamalaysia.com/EDMS/subweb.nsf/all/A85A5F06 21D3395948257CBB0032ED02/$File/AMWAY-­‐AnnualReport2013.pdf. Site accessed on 10th November 2014 3. AMWAY Malaysia Share Price -­‐ http://www.bursamalaysia.com/market/listed-­‐companies/list-­‐of-­‐ companies/plc-­‐profile.html?stock_code=6351. Site accessed on 11th November 2014 4. AMWAY Malaysia Share Price and Financial Information -­‐ http://www.malaysiastock.biz/Corporate-­‐ Infomation.aspx?type=A&value=A&securityCode=6351. Site accessed on 12th November 2014