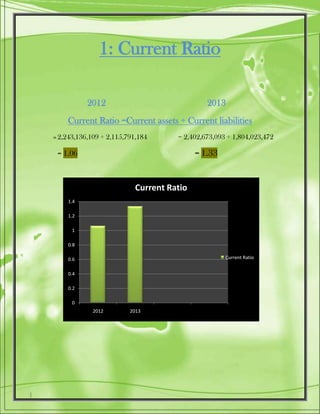
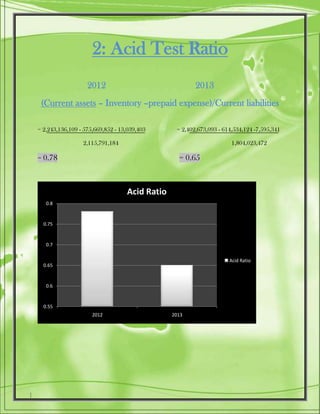
Syeda Wajiha Zaidi
ID# 8424
Subject: Finance For managers
Submitted to: Sir Muhammad Farhan
Date: 8/04/2014
COMPANY PROFILE
Kohinoor Mills Limited's vision is to achieve and then remain as the most progressive and
profitable textile organization in Pakistan. Incorporated in 1987 as a small weaving mill, today
Kohinoor Mills broadly undertakes three major businesses, weaving, dyeing and power generation.
It has, and continues to develop, a portfolio of businesses that are major players within their
respective industries. Bringing together outstanding knowledge of customer needs with leading
edge technology platforms your company undertakes to provide superior products to its
customers.
With an annual turnover of over Rs. 8 billion, today Kohinoor Mills Limited employs over 1,400
employees. It aims to create superior value for Kohinoor's customers and stakeholders without
compromising its commitment to safety, environment and health for the communities in which it
operates. Its products range from greige fabric to processed fabric.
MISSION & VISION STATEMENT
The Kohinoor Mills Limited's stated mission is to become and then remain
as the most progressive and profitable company in Pakistan in terms of industry standards
and stakeholders interest.
The Company shall achieve its mission through a continuous process of having sourced,
developed, implemented and managed the best leading edge technology, industry best
practices, human resource and innovative products and services and sold these to its
customers, suppliers and stakeholders.
BUSINESS ACTIVITIES
The Company is principally engaged in the business of textile manufacturing covering
weaving, bleaching, dyeing, buying and selling and otherwise dealing in yarn, cloth and
other goods and fabrics made from raw cotton and synthetic fiber and to generate,
distribute, supply and sell electricity.
1: Current Ratio
2012 2013
Current Ratio =Current assets ÷ Current liabilities
2,243,136,109 ÷ 2,115,791,184 = 2,402,673,093 ÷ 1,804,023,472
= 1.06 = 1.33
0
0.2
0.4
0.6
0.8
1
1.2
1.4
2012 2013
Current Ratio
Current Ratio
2: Acid Test Ratio
2012 2013
(Current assets – Inventory –prepaid expense)/Current liabilities
= 2,243,136,109 - 575,669,852 - 13,039,403 = 2,402,673,093 - 614,534,124 -7,595,341
2,115,791,184 1,804,023,472
= 0.78 = 0.65
0.55
0.6
0.65
0.7
0.75
0.8
2012 2013
Acid Ratio
Acid Ratio
3: Financial Leverage Rate
(i)Debt to Equity
2012 2013
Total Debt ÷ Shareholder Equity
= 5,538,428,218 ÷ (570,525,902) = 4,553,171,845 ÷ 521,434,442
= 9.70 = 8.73
8.2
8.4
8.6
8.8
9
9.2
9.4
9.6
9.8
2012 2013
Debt to equity
Debt to equity
(ii)Debt to total Assets
Total debt ÷ total assets
2012 2013
= 5,538,428,218 ÷ 5,823,301,472 = 4,553,171,845 ÷ 5,860,064,788
= 0.95 = 0.77
0
0.1
0.2
0.3
0.4
0.5
0.6
0.7
0.8
0.9
1
2013 2012
debt to total assets
Total Capitalization
Long term debt ÷ total capitalization
2012 2013
= 3,422,637,034 ÷ 2,852,111,132 = 2,749,148,373 ÷ 3,270,582,815
= 1.20 = 8.40
0
1
2
3
4
5
6
7
8
9
2013 2012
total capitalization
Coverage Ratio
(i)Interest coverage
EBIT ÷ Interest Charges
2012 2013
= 689,070,687 ÷ 348,032,232 = 1,087,211,849 ÷ 505,422,696
= 1.97 = 2.15
1.85
1.9
1.95
2
2.05
2.1
2.15
2.2
2013 2012
Interest coverage
Interest coverage
Activity Ratio
Sales ÷ Receivables
2012 2013
= 6,261,867,722 ÷ 190,653,753 = 8,451,770,781 ÷ 237,728,166
= 32.8 = 35.5
31
31.5
32
32.5
33
33.5
34
34.5
35
35.5
36
2013 2012
activity ratio
activity ratio
Average collectivity period
Days in year ÷ Receivable turnover
2012 2013
= 365 ÷ 38.2 = 365 ÷ 35.5
= 11 days = 10 days
9.4
9.6
9.8
10
10.2
10.4
10.6
10.8
11
11.2
2013 2012
Avg collection period
Payable turnover
Credit Purchases ÷ Accounts payable
2012 2013
= 3,354,453,055 ÷ 682,165,263 = 4,729,503,889 ÷ 814,538,309
= 4.91 = 5.80
4.4
4.6
4.8
5
5.2
5.4
5.6
5.8
6
2013 2012
Payable turnover
Payable turnover
Payable turnover in days
Days in year ÷ payable turnover
2012 2013
= 365 ÷ 4.91 = 365 ÷ 5.80
= 74 days = 63 days
56
58
60
62
64
66
68
70
72
74
76
2013 2012
Payable turnover in days
Inventory Turnover
Cost of Goods Sold ÷ Inventory
2012 2013
= 5,342,992,987 ÷ 575,669,852 = 7,073,457,332 ÷ 614,534,124
= 9.2 = 11.5
0
2
4
6
8
10
12
14
2013 2012
Inventory Turnover
Inventory Turnover
Total Assets Turnover
Net Sales ÷ total Assets
2012 2013
= 6,261,867,722 ÷ 5,823,301,472 = 8,451,770,781 ÷ 5,860,064,788
= 1.07 = 1.44
0
0.2
0.4
0.6
0.8
1
1.2
1.4
1.6
2013 2012
Total Assets turnover
Profitability ratios
Gross Profit Margin
Gross Profit ÷ net sales × 100
2012 2013
= 918,874,735 ÷ 6,261,867,722 × 100 = 1,378,313,449 ÷ 8,451,770,781 × 100
= 14.6% = 16.3 %
13.5
14
14.5
15
15.5
16
16.5
2013 2012
gross profit margin
gross profit margin
Net profit margin
Net Profit after Tax ÷ net Sales × 100
2012 2013
= 629,488,518 ÷ 6,261,867,722 × 100 = 1,008,666,682 ÷ 8,451,770,781× 100
= 10 % = 11.9 %
9
9.5
10
10.5
11
11.5
12
12.5
2013 2012
Net Profit margin
Net Profit margin
Return on investment
Net profit after tax ÷ total assets
2012 2013
= 629,488,518 ÷ 5,823,301,472 = 1,008,666,682 ÷ 5,860,064,788
= 0.10 = 0.17
0
0.02
0.04
0.06
0.08
0.1
0.12
0.14
0.16
0.18
2013 2012
Return on investment
RETURN ON EQUITY
Net profit after tax ÷ Shareholder equity
2012 2013
= 629,488,518 ÷ (570,525,902) = 1,008,666,682 ÷ 521,434,442
= 1.1 = 1.9
0
0.2
0.4
0.6
0.8
1
1.2
1.4
1.6
1.8
2
2013 2012
return on equity
return on equity
After analyzing financial statement of Kohinoor Mills limited it is
concluded that companies financial is very strong its profit increase
in 2013 by 60.2% i.e. from 6,29M to 1,008M also their sale is
increased from 6,261M to 8,451M which caused increase in Gross
profit to 50% which mainly because of a cost cutting strategy of
management.
Total Reserve of Kohinoor Mills Limited increased from -570M
(which is due to negative reserve) to 521M which is a result of
increase in total reserves as well as increase in accumulated profit
as above mention. Their long term liability is also decreased in 2013
by 19.6% i.e. from 3,422M to 2,749M where as current liability is
decreased to 14.7% so this decrease in total liability is a great sign
for company as they are paying off all their debts. The total asset of
company is not much increase it is just increased to 0.63% where as
long term asset is decreased which is mainly because of
depreciation of their fixed assets.
As far as ratios are concern their current asset in 2013 is 1.33 which
means that they have 1.33 rupees of asset for every 1 rupees of
liability. Moreover they have acid test ratio of 0.65 which is not a
good sign as they couldn’t spontaneously fulfill their all current
liability by current liquid assets.
While debt to equity ratio is also not good it is 8.73 which means
their debt is 8.73 times more than their shareholders equity. Their
total debt is 0.77 times less then total assets. They also have
decreased their average collection period from 11 to 10 days which
leads to good cash conversion cycle.

Ratio Analysis Report

  • 1.
    Syeda Wajiha Zaidi ID#8424 Subject: Finance For managers Submitted to: Sir Muhammad Farhan Date: 8/04/2014
  • 2.
    COMPANY PROFILE Kohinoor MillsLimited's vision is to achieve and then remain as the most progressive and profitable textile organization in Pakistan. Incorporated in 1987 as a small weaving mill, today Kohinoor Mills broadly undertakes three major businesses, weaving, dyeing and power generation. It has, and continues to develop, a portfolio of businesses that are major players within their respective industries. Bringing together outstanding knowledge of customer needs with leading edge technology platforms your company undertakes to provide superior products to its customers. With an annual turnover of over Rs. 8 billion, today Kohinoor Mills Limited employs over 1,400 employees. It aims to create superior value for Kohinoor's customers and stakeholders without compromising its commitment to safety, environment and health for the communities in which it operates. Its products range from greige fabric to processed fabric. MISSION & VISION STATEMENT The Kohinoor Mills Limited's stated mission is to become and then remain as the most progressive and profitable company in Pakistan in terms of industry standards and stakeholders interest. The Company shall achieve its mission through a continuous process of having sourced, developed, implemented and managed the best leading edge technology, industry best practices, human resource and innovative products and services and sold these to its customers, suppliers and stakeholders. BUSINESS ACTIVITIES The Company is principally engaged in the business of textile manufacturing covering weaving, bleaching, dyeing, buying and selling and otherwise dealing in yarn, cloth and other goods and fabrics made from raw cotton and synthetic fiber and to generate, distribute, supply and sell electricity.
  • 3.
    1: Current Ratio 20122013 Current Ratio =Current assets ÷ Current liabilities 2,243,136,109 ÷ 2,115,791,184 = 2,402,673,093 ÷ 1,804,023,472 = 1.06 = 1.33 0 0.2 0.4 0.6 0.8 1 1.2 1.4 2012 2013 Current Ratio Current Ratio
  • 4.
    2: Acid TestRatio 2012 2013 (Current assets – Inventory –prepaid expense)/Current liabilities = 2,243,136,109 - 575,669,852 - 13,039,403 = 2,402,673,093 - 614,534,124 -7,595,341 2,115,791,184 1,804,023,472 = 0.78 = 0.65 0.55 0.6 0.65 0.7 0.75 0.8 2012 2013 Acid Ratio Acid Ratio
  • 5.
    3: Financial LeverageRate (i)Debt to Equity 2012 2013 Total Debt ÷ Shareholder Equity = 5,538,428,218 ÷ (570,525,902) = 4,553,171,845 ÷ 521,434,442 = 9.70 = 8.73 8.2 8.4 8.6 8.8 9 9.2 9.4 9.6 9.8 2012 2013 Debt to equity Debt to equity
  • 6.
    (ii)Debt to totalAssets Total debt ÷ total assets 2012 2013 = 5,538,428,218 ÷ 5,823,301,472 = 4,553,171,845 ÷ 5,860,064,788 = 0.95 = 0.77 0 0.1 0.2 0.3 0.4 0.5 0.6 0.7 0.8 0.9 1 2013 2012 debt to total assets debt to total assets
  • 7.
    Total Capitalization Long termdebt ÷ total capitalization 2012 2013 = 3,422,637,034 ÷ 2,852,111,132 = 2,749,148,373 ÷ 3,270,582,815 = 1.20 = 8.40 0 1 2 3 4 5 6 7 8 9 2013 2012 total capitalization total capitalization
  • 8.
    Coverage Ratio (i)Interest coverage EBIT÷ Interest Charges 2012 2013 = 689,070,687 ÷ 348,032,232 = 1,087,211,849 ÷ 505,422,696 = 1.97 = 2.15 1.85 1.9 1.95 2 2.05 2.1 2.15 2.2 2013 2012 Interest coverage Interest coverage
  • 9.
    Activity Ratio Sales ÷Receivables 2012 2013 = 6,261,867,722 ÷ 190,653,753 = 8,451,770,781 ÷ 237,728,166 = 32.8 = 35.5 31 31.5 32 32.5 33 33.5 34 34.5 35 35.5 36 2013 2012 activity ratio activity ratio
  • 10.
    Average collectivity period Daysin year ÷ Receivable turnover 2012 2013 = 365 ÷ 38.2 = 365 ÷ 35.5 = 11 days = 10 days 9.4 9.6 9.8 10 10.2 10.4 10.6 10.8 11 11.2 2013 2012 Avg collection period Avg collection period
  • 11.
    Payable turnover Credit Purchases÷ Accounts payable 2012 2013 = 3,354,453,055 ÷ 682,165,263 = 4,729,503,889 ÷ 814,538,309 = 4.91 = 5.80 4.4 4.6 4.8 5 5.2 5.4 5.6 5.8 6 2013 2012 Payable turnover Payable turnover
  • 12.
    Payable turnover indays Days in year ÷ payable turnover 2012 2013 = 365 ÷ 4.91 = 365 ÷ 5.80 = 74 days = 63 days 56 58 60 62 64 66 68 70 72 74 76 2013 2012 Payable turnover in days Payable turnover in days
  • 13.
    Inventory Turnover Cost ofGoods Sold ÷ Inventory 2012 2013 = 5,342,992,987 ÷ 575,669,852 = 7,073,457,332 ÷ 614,534,124 = 9.2 = 11.5 0 2 4 6 8 10 12 14 2013 2012 Inventory Turnover Inventory Turnover
  • 14.
    Total Assets Turnover NetSales ÷ total Assets 2012 2013 = 6,261,867,722 ÷ 5,823,301,472 = 8,451,770,781 ÷ 5,860,064,788 = 1.07 = 1.44 0 0.2 0.4 0.6 0.8 1 1.2 1.4 1.6 2013 2012 Total Assets turnover Total Assets turnover
  • 15.
    Profitability ratios Gross ProfitMargin Gross Profit ÷ net sales × 100 2012 2013 = 918,874,735 ÷ 6,261,867,722 × 100 = 1,378,313,449 ÷ 8,451,770,781 × 100 = 14.6% = 16.3 % 13.5 14 14.5 15 15.5 16 16.5 2013 2012 gross profit margin gross profit margin
  • 16.
    Net profit margin NetProfit after Tax ÷ net Sales × 100 2012 2013 = 629,488,518 ÷ 6,261,867,722 × 100 = 1,008,666,682 ÷ 8,451,770,781× 100 = 10 % = 11.9 % 9 9.5 10 10.5 11 11.5 12 12.5 2013 2012 Net Profit margin Net Profit margin
  • 17.
    Return on investment Netprofit after tax ÷ total assets 2012 2013 = 629,488,518 ÷ 5,823,301,472 = 1,008,666,682 ÷ 5,860,064,788 = 0.10 = 0.17 0 0.02 0.04 0.06 0.08 0.1 0.12 0.14 0.16 0.18 2013 2012 Return on investment Return on investment
  • 18.
    RETURN ON EQUITY Netprofit after tax ÷ Shareholder equity 2012 2013 = 629,488,518 ÷ (570,525,902) = 1,008,666,682 ÷ 521,434,442 = 1.1 = 1.9 0 0.2 0.4 0.6 0.8 1 1.2 1.4 1.6 1.8 2 2013 2012 return on equity return on equity
  • 19.
    After analyzing financialstatement of Kohinoor Mills limited it is concluded that companies financial is very strong its profit increase in 2013 by 60.2% i.e. from 6,29M to 1,008M also their sale is increased from 6,261M to 8,451M which caused increase in Gross profit to 50% which mainly because of a cost cutting strategy of management. Total Reserve of Kohinoor Mills Limited increased from -570M (which is due to negative reserve) to 521M which is a result of increase in total reserves as well as increase in accumulated profit as above mention. Their long term liability is also decreased in 2013 by 19.6% i.e. from 3,422M to 2,749M where as current liability is decreased to 14.7% so this decrease in total liability is a great sign for company as they are paying off all their debts. The total asset of company is not much increase it is just increased to 0.63% where as long term asset is decreased which is mainly because of depreciation of their fixed assets. As far as ratios are concern their current asset in 2013 is 1.33 which means that they have 1.33 rupees of asset for every 1 rupees of liability. Moreover they have acid test ratio of 0.65 which is not a good sign as they couldn’t spontaneously fulfill their all current liability by current liquid assets. While debt to equity ratio is also not good it is 8.73 which means their debt is 8.73 times more than their shareholders equity. Their total debt is 0.77 times less then total assets. They also have decreased their average collection period from 11 to 10 days which leads to good cash conversion cycle.