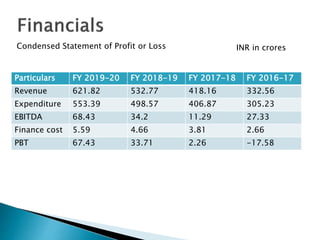
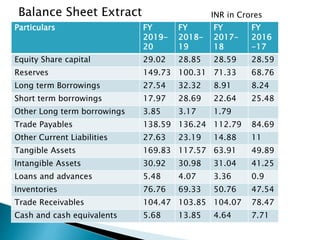
This document provides an overview of a paint manufacturing company that is planning an IPO. It discusses the company's history since 2000, product portfolio, financial performance from 2016-2020, and plans for utilizing funds raised from the IPO. Key details include steady revenue growth, increasing profits and cash flows, a diverse product range offered under the brand "Indigo", and plans to use IPO proceeds for expansion and debt repayment.
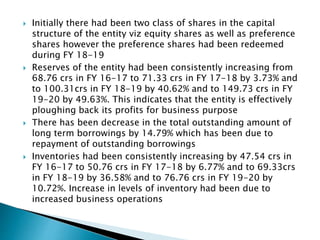
![ Strengths-1]Fifth largest market cap in the paints
Industry
2]Stronger EPS Growth and Profitability
3]Favourable Asset and Inventory Turnover Ratio
4]Company low on debt
5]Efficient Product development mechanisms
6]Increasing cashflows from operating business
Weakness-1]Company unable to generate
positive net cashflows
2]Declining Share price](https://image.slidesharecdn.com/indigopaintsltd-210318070353/85/Indigo-paints-ltd-IPO-5-320.jpg)
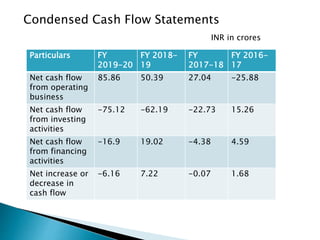
![ Exterior Emulsions-
a] Indigo Multicolor Emulsion
b] Premium Sheen Interior Paint
c] Luxury Interior Paint and many more…
Interior Emulsions-
a] Premium XT Exterior Paint
b] Dirt proof and water proof exterior paint and
many more…](https://image.slidesharecdn.com/indigopaintsltd-210318070353/85/Indigo-paints-ltd-IPO-7-320.jpg)
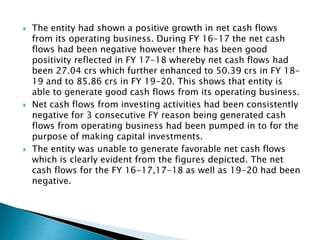
![ Putties and Primers-
a] Universal Primer
b] Waterproof wall putting and many more…
Enamels-
a]Satin Enamel
b]PU super Glossy Enamel and many more…
Wood Coatings-
a] Interior and exterior single water based PU
b] Anti termite solution
c] Interior Sanding sealer and many more….](https://image.slidesharecdn.com/indigopaintsltd-210318070353/85/Indigo-paints-ltd-IPO-8-320.jpg)
![ Others-
a] Bright Ceiling Paint
b] PU Floor Coating Paint
c] Aluminium Paint
d] Roof Glossy Paint and many more…](https://image.slidesharecdn.com/indigopaintsltd-210318070353/85/Indigo-paints-ltd-IPO-9-320.jpg)
![ Issue size is Rs.1176 crores which comprise of fresh issue of
Rs.300 crores and Rs.876 crores of offer for sale by selling
shareholders
The offer includes reservation of up to 70000 equity shares
for subscription by eligible employees of the entity at a
discount of Rs.148 per share.
The proceeds of issue will be utilized as follows- a] Rs.150
crores towards capital expenditure for expansion of existing
manufacturing facility at Pudukkottai Tamilnadu by setting up
an additional unit adjacent to existing facility
b] Rs.50 crores for purchase of machineries and gyroshakers
c] Rs.25 crores for Repayment or prepayment of borrowings
so far taken by the entity](https://image.slidesharecdn.com/indigopaintsltd-210318070353/85/Indigo-paints-ltd-IPO-20-320.jpg)
![ d] Balance of funds to be utilized for
corporate purpose.
Issue open date- 20/01/2021
Issue close date- 22/01/2021
Issue allotment date- 28/01/2021
Date of refund of excess sum- 29/01/2021
Date of credit to Demat A/c- 01/02/2021
Date of listing – 02/02/2021
Offer Price Band- Rs.1488-1490 per share
Lot size- 10 equity shares per bid
Issue type- Book Building Issue](https://image.slidesharecdn.com/indigopaintsltd-210318070353/85/Indigo-paints-ltd-IPO-21-320.jpg)
![ IPO lead managers-
a] Edelweiss Financial Services Ltd.
b] ICICI Securities Ltd
c] Kotak Mahindra Capital Ltd
The share price post IPO has been trading at 60%
premium over upper band issue price
The shares had been subscribed by 117 times](https://image.slidesharecdn.com/indigopaintsltd-210318070353/85/Indigo-paints-ltd-IPO-22-320.jpg)


