SlideShare a Scribd company logo
An integrated scenario-based multi-criteria decision support system for water
resources management and planning – A case study in the Haihe River Basin
S.Q. Weng a,1
, G.H. Huang a,b,*, Y.P. Li b,2
a
Environmental Systems Engineering Program, Faculty of Engineering, University of Regina, Regina, Sask, Canada S4S 0A2
b
Research Academy of Energy and Environmental Studies, North China Electric Power University, Beijing 102206, China
a r t i c l e i n f o
Keywords:
Decision making
Haihe River Basin
Multiobjective
MCDM
Policy
Scenario analysis
Water resources
a b s t r a c t
In this study, an integrated scenario-based multi-criteria decision support system (SMC-DSS) is devel-
oped for planning water resources management in the Haihe River Basin. The SMC-DSS incorporates
techniques of scenario analysis, multiobjective programming (MOP), and multi-criteria decision analysis
(MCDA) within a decision support systems (DSS) framework. The system components include system
composition, scenario generation, scenario quantification, multiobjective optimization, and scenario
evaluation. SMC-DSS can solve complex water resources management planning problem which may
involve several conflict objectives, and can deal with uncertainties expressed as possible outcomes.
The SMC-DSS can be used for assessing management policy impacts on socio-economic and environmen-
tal sectors and supporting the formulation of relevant management policies under uncertainty. It is effec-
tive for large-scale problems with thousands of parameters and variables and in association with
uncertain features. The developed SMC-DSS is then applied to planning water resources management
in the Haihe River Basin, China. A number of scenarios based on different water resources management
policies are conducted. The results indicate that different water management policies could lead to varied
patterns for regional economic development and environmental protection. The results obtained are
valuable for identifying desired water resources management policies and planning sustainable regional
development patterns.
Ó 2010 Elsevier Ltd. All rights reserved.
1. Introduction
Water resources management is a complicated issue, which in-
volves socio-economic and environmental impacts, as well as var-
ious natural and human-disturbing factors (e.g., hydrologic and
hydraulic condition, human activities); moreover, watersheds are
usually characterized by various uncertainties associated with
hydrological exogenous inflows and human demand patterns in
the future. When water resources decision-making models are
repeatedly simulated from a long-term perspective, thousands of
constraints and variables are needed to be handled and decision
makers are often overburdened by quantity and complexity of
information generated by models. These complexities could
become further amplified when various uncertainties must be con-
sidered in developing any model (Li, Huang, & Nie, 2006). There-
fore, designing a sound system for better addressing such
complexities can help decision makers to manage water resources
effectively and efficiently.
Consequently, in the past decades, many systems analysis
methods were developed in response to these complexities (Bashir,
Tanakamaru, & Tada, 2009; Billionnet, 2009; Chang, Wen, Chen, &
Yong, 1996a, 1996b; Foran & Wardle, 1995; Huang, 1996, 1998; Li
& Huang, 2009; Li, Huang, Nie, & Liu, 2008; Li, Yang, Huang, & Li,
2009; Luo, Maqsood, Huang, Yin, & Han, 2005; Pallottino, Sechi,
& Zuddas, 2005; Qin, Huang, Chakma, Nie, & Lin, 2008; Sakawa &
Yano, 1990; Seifi & Hipel, 2001; Song & Li, 2009; Yin, Pierce, & Love,
1995). Among them, multiobjective programming (MOP) methods
can provide valuable trade-off information among the conflict
objectives; multi-criteria decision analysis (MCDA) provides a sys-
tematic procedure to help decision makers choose the most desir-
able and satisfactory alternative through analyzing multiple
criteria by which the strengths and weaknesses of various adapta-
tion options could be evaluated. Since the early 1970s, MCDM
techniques have been developed into many forms and been exten-
sively employed for a wide range of different case studies, such as
river basin planning and groundwater remediation (Moeffaert,
2003). Generally, multi-criteria analysis consists of two major
fields (Nasiri, Maqsood, Huang, & Fuller, 2007): (i) multiple-
objective decision-making (MODM) (Chen et al., 2005; Michnik &
0957-4174/$ - see front matter Ó 2010 Elsevier Ltd. All rights reserved.
doi:10.1016/j.eswa.2010.05.061
* Corresponding author. Tel.: +1 306 585 4095; fax: +1 306 585 4855.
E-mail addresses: weng_sq@hotmail.com (S.Q. Weng), gordon.huang@uregina.ca
(G.H. Huang), yongping.li@iseis.org (Y.P. Li).
1
Tel.: +1 306 585 4958; fax: +1 306 585 4855.
2
Tel.:/fax: +86 10 5197 1255.
Expert Systems with Applications 37 (2010) 8242–8254
Contents lists available at ScienceDirect
Expert Systems with Applications
journal homepage: www.elsevier.com/locate/eswa
Nomenclature
t planning year (2000, 2005, 2010, 2015, 2020, 2025 and
2030)
d district (Beijing, Tianjin, Hebei, Lubei, Yubei)
s sector (Agriculture, Mining, Heavy manufacturing, Light
manufacturing, Electrical machinery, construction,
Transportation, Services)
s1 industrial sector (Mining, Heavy manufacturing, Light
manufacturing, Electrical machinery, construction,
Transportation)
s2 service sector
c number of crops (grain, wheat, vegetable, cotton, sum-
mer corn, autumn corn)
f type of forest, including man-made forest and natural
forest
p type of grassland, p = 1 irrigation grassland, p = 2 natural
grassland
A matrix of input coefficients. For a given time period and
district, it is a (8  8) matrix whose elements aij give the
quantity of the output of sector i absorbed by sector j
per unit of its total output j
aij input coefficient of product of sector i into sector j
Bfixin matrix of capital coefficients of investment in fixed as-
sets
Bgov matrix of capital coefficients of government consump-
tion expenditure
Bpri matrix of capital coefficients of private consumption
expenditure
Bwor matrix of capital coefficients of working capital
I an identity matrix
J project, where j = 1, 2 denote east route and middle
route water transfer project)
P
invest lower bound of GDP investment rate coefficient
Pþ
invest upper bound of GDP investment rate coefficient
P
atotal lower bound of total planting area rising rate
Pþ
atotal upper bound of total planting area rising rate
P
im lower bound of import coefficient
Pþ
im upper bound of import coefficient
P
acrop lower bound of planting area rising rate for each crop
Pþ
acrop upper bound of planting area rising rate for each crop
P
aforest lower bound of increasing area for each type of forest
Pþ
aforest upper bound of increasing area for each type of forest
P
agrass lower bound of increasing area for each type of grass-
land
Pþ
agrass upper bound of increasing area for each type of grass-
land
P
ex lower bound of export coefficient
Pþ
ex upper bound of export coefficient
Palpha0 generation coefficient of fixed asset value in time period
t
Palpha1 generation coefficient of fixed asset value in time period
t  1
Pamax total available irrigation area
PBODrate BOD discharge rate per unit of 10 million Yuan output
value of each sector
Pcita output rate of fixed assets
Pcost1 cost of each project
Pcropagn duplicate planting coefficient
Pdelta upper bound of (balance of trade/GDP)
Pdisprate fixed asset depreciation rate
Pfinalfix final generation coefficient of fixed assets
PGDP added value rate
Pgov government consumption coefficient
Plivestk heads of livestock fed by Unit area grassland
Pmcrop crop output value per unit yield
Pmforest forest output value per unit area
Pmivestk unit livestock price
PPBOD BOD discharge per resident
Ppri private consumption coefficient
PTBOD residual rate of wastewater treatment rate
Pwcrop irrigation water per unit crop area
Pwfish water use for fishery per unit of 10,000 Yuan output va-
lue
Pwforest irrigation water per unit forest area
Pwgrass water use per unit grassland area
Pwindu water use per unit of 10,000 Yuan output value of indus-
try
Pwlivestk water use per head of livestock
Pwor investment coefficient of working capital
Pwpoprur rural water use per capita
Pwpopurb urban water use per capita
Pwresource total amount of water resource
Pwsave cost of unit water-save irrigation area
Pwserv water use per unit of 10,000 Yuan output value of ser-
vice
Pwusecoe water resource utilization coefficient
Pwwindu industrial wastewater discharge rate
Pwwpop resident wastewater discharge rate
Pwwprice cost of new unit wastewater treatment capacity
Pwwserv service wastewater discharge rate
Pwwteated wastewater treatment rate
Pycrop crop yield per unit area
X output value of industrial sector s in district d in time
period t
Xacrop planting area for each crop
Xaforest area of a forest
Xagrass grassland area
Xagri water use for agriculture
Xasave area of water-save irrigation
XBOD amount of BOD discharge
Xbuild1 cost of south-to-north water transfer project in Haihe
River Basin
Xbuild2 cost of wastewater treatment
Xbuild3 cost of save water project
Xdeltafix fixed asset increment in the time period t
Xex exports
Xfixas fixed assets
Xfixin investment in fixed assets
XFOOD total crop output
XGDP gross domestic production
Xgov government consumption expenditure
Xim imports
XIO 0–1 variable. 0 means the project does not taken while 1
denotes the project will be undertaken
Xlivestk production of livestock
Xmcrop crop output value
Xmfish output value of fishery
Xmforest forest output value
Xmpasture output value
Xpoprur rural population
Xpopurb urban population
Xpri private consumption expenditure
Xsfixas fixed assets in sector s
Xsfixin investment in fixed assets in sector s
Xtacrop total planting area
Xtaforest total forest area
Xtmcrop total crop value
Xtmforest total forest output value
S.Q. Weng et al. / Expert Systems with Applications 37 (2010) 8242–8254 8243
Trzaskalik, 2002), which works on continuous decision spaces, pri-
marily on mathematical programming with several objective func-
tions; and (ii) multiple-attribute decision-making (MADM) (Yoon
 Hwang, 1995), which focuses on problems with discrete decision
spaces to choose an optimal alternative from a set of alternatives
with respect to multiple evaluation attributes, and in relation to
attribute weights.
Scenario analysis method is a useful technique for addressing
uncertainties existing in the system components. The typical char-
acteristic of this method is that it can model many real problems
where decisions are based on uncertain information presented as
a set of possible outcomes (i.e. scenarios). A scenario represents a
possible realization of sets of uncertain data in the time horizon
examined (Onnis, Sechi,  Zuddas, 1999). Previously, a number of
scenario analysis methods were developed for a variety of fields,
including land-use planning (Foran  Wardle, 1995; Yin et al.,
1995), climate change (Wolf  Diepen, 1995), air traffic manage-
ment (Glockner, 1996), forest ecology and forest management
(Mohren, 2003), investment planning (Mulvey  Vladimirou,
1989), insurance policy analysis (Hoyland  Wallace, 2001), and
regional planning (Döll, Hauschild,  Fuhr, 2000). However, few
applications to water resources management were reported.
Pallottino et al. (2005) proposed a scenario analysis model for
water resources management under uncertainty; however, in this
method, a single objective function was considered to identify a
complete set of decision variables under uncertainty. Moreover,
most of the previous studies either developed optimization models
for describing interactions among resources, economy and envi-
ronment, or evaluating effects of resources management policy
on environmental and/or economy objectives. There is lacking of
methods integrating these efforts into a general framework based
on decision support systems (DSS). In fact, an integrated DSS that
combines scenario analysis, MOP and MCDA techniques will help
generate more effective and efficient water resources management
plans.
Therefore, the objective of this study aims to develop such an
integrated scenario-based multi-criteria decision support system
(SMC-DSS) for planning water resources management in the Haihe
River Basin. The system components include system composition,
scenario generation, scenario quantification, multiobjective opti-
mization, and scenario evaluation. The SMC-DSS will incorporate
techniques of scenario analysis, multiobjective programming
(MOP), and multi-criteria decision analysis (MCDA) within a deci-
sion support systems (DSS) framework. In SMC-DSS, scenario anal-
ysis will be used to model the policies for water resources
management, MOP will be used to handle multiple conflict objec-
tives, and MCDA will be used to accomplish the scenario evalua-
tion. The robustness of the various policies can thus be examined
through assessing their impacts under different possible outcomes.
The developed SMC-DSS is then applied to planning water re-
sources management in the Haihe River Basin, China. A number
of scenarios based on different water resources management poli-
cies will be conducted. The results obtained will be valuable for
supporting water resources management and planning regional
economic development.
2. The study system
The Haihe River Basin is located in the northern part of China,
which lies between the Songliao Plain (in the northeast) and the
Yellow River Basin (to the south and west) (as shown in Fig. 1).
The basin has two major rivers: the Haihe River and the Luanhe
River (including their tributaries). The Haihe River Basin covers
two municipalities of Beijing and Tianjin, and more than 20 large
and medium-sized cities in the Hebei, Shandong, Shanxi and
Henan Provinces. The Haihe River Basin is characterized by a
semi-humid climate in the monsoon region of the East Asia Warm
Temperate Zone. It has an extremely uneven rainfall distribution. It
is dry and cold in the winter, while with low rainfall level in the
spring and heavy rainfall in the summer. The average annual pre-
cipitation is 548 mm, with approximately 80% of rainfall occurring
during June to September. The basin area is about 318,800 km2
,
where 189,000 km2
is mountainous and the rest is flood plain
(Chao, 1998).
The Haihe River Basin is important for China due to the facts
that (i) it can produce about 10% of China’s total grain output, (ii)
the people living in this basin occupies 10% of Chinese total popu-
lation, (iii) it is the center of many industrial and human activities,
and (iv) it is nearly close to the nation’s capital city, Beijing. Cur-
rently, this basin is facing a number of challenging questions such
as (i) since this region is one of the driest regions in China, it faces
serious water scarcity; for example, in 1998, the water availability
per capita was about 430 m3
/capita, which is far below the average
level of 1000 m3
/capita, an internationally accepted definition for
water scarcity (Hydrosult, 1999); (ii) rapid economic and popula-
tion growth rates lead to rising water demands from urban and
industrial sectors, and thus increasing pressure on water supplies;
(iii) water pollution is very serious in this basin because large vol-
umes of raw sewage are dumped daily into the rivers in the basin,
while most of the industrial wastewaters have not been treated;
(iv) water tables have dropped substantially due to immoderately
using underground water, while the underground water is being
extracted faster than aquifers can be recharged. These issues have
made the regional water resource system degradation. Conse-
quently, a variety of water management policies have been under-
taken. They include:
(1) Saving water policy – This policy is implemented through
the application of saving water technologies such as control-
ling leakage, promoting reusing water, taking rational prices
for domestic and industry sectors, improving irrigation effi-
ciency, using spray and drip irrigation system, developing
drought resistant crop varieties (i.e. using bio-technical
technology to breed new crops which need little water),
and reducing evapotranspiration rate through using plastic
film and mulches in the agriculture sector.
Xtwcrop total irrigation water needed for corps
Xtwforest total irrigation water needed for forests
Xtwothagri total water use for both animal husband and fishery
Xwaterin total investment in water projects
Xwcrop irrigation water needed for a crop
Xwfish total water use for fishery
Xwforest irrigation water needed for a type of forest
Xwgrass total water use for grassland
Xwindu water use for industry
Xwlivestk total water use for livestock
Xwor working capital
Xwpop water use for resident
Xwserv water use for service
Xwtotal total water use
Xwwaste discharge of wastewater
Xwwaste total amount of wastewater discharge
Xwwtreated amount of treated wastewater
Xycrop yield of crop
8244 S.Q. Weng et al. / Expert Systems with Applications 37 (2010) 8242–8254
(2) Protecting water resources policy – This policy focuses on
protection of underground water resources including build-
ing up wastewater treatment infrastructure to reduce
wastewater discharge and charging more economic fees for
excess wastewater discharges; besides, the underground
water supplies are limited such as requiring permits for dril-
ling new wells and extracting more water from wells, and
establishing control measures to avoid underground aquifer
pollution.
(3) South–North water transfer project – This project can trans-
fer water from the water-rich region (southern part of
China) to the water-deficit region (northern part of China),
while three water diversion routes are building (namely
the east route, middle route, and west route); the estimated
construction cost for east and middle route is about 22 bil-
lion US dollars.
Although the above policies have been conducted to facilitate
the regional water resources management, the competitions for
water among municipal, industrial and agricultural users have
been intensifying with the rapidly increasing economic and popu-
lation growth rates. The available water resources are becoming
over utilized and there is an urgent need to develop sound
management plans. The users are of increasing concerns on the
quantity and quality of water supply. When faced with disadvan-
tageous climate and river-flow conditions, water-shortage prob-
lems would arise particularly under poorly planned allocation
schemes. Consequently, effectively planning for water sources
management in the study river basin is desired. An integrated sce-
nario-based multi-criteria decision support system (SMC-DSS) will
thus be developed for planning water resources in the study
Basin.
3. Microeconomic multiobjective water management model
A microeconomic multiobjective water management (MEMO)
model is developed for the study system, where input–output
analysis method is used to describe the microeconomic system. In-
put–output analysis is a useful tool for systematically quantifying
the interrelationships among various sectors in a complex eco-
nomic system, which is first proposed by Leontief Professor who
was awarded the 1973 Nobel Prize in Economic Science (Leontief,
1986). Consequently, the MEMO model can be formulated as
follows:
Objectives:
ZGDP ¼ max
X
t
X
d
XGDPðt; dÞ
( )
ð1Þ
ZBOD ¼ min
X
t
X
d
XBODðt; dÞ
( )
ð2Þ
ZFOOD ¼ max
X
t
X
d
XFOODðt; dÞ
( )
ð3Þ
Constraints:
(1) Microeconomic constraints
(a) Input–Output equation
ðI  AÞ  Xðt; d; sÞ ¼ Bpriðt; sÞ  Xpriðt; dÞ þ Bgovðt; sÞ
 Xgovðt; dÞ þ Bfixinðt; sÞ  Xfixinðt; dÞ
þ Bworðt; sÞ  Xworðt; dÞ þ Xexðt; d; sÞ
 Ximðt; d; sÞ ð4Þ
(b) Production and GDP
Xðt; d; sÞ 6 Pcitaðt; sÞ  Xfixasðt; d; sÞ ð5Þ
XGDPðt; dÞ ¼
X
8
s¼1
PGDPðt; d; sÞ  Xðt; d; sÞ ð6Þ
(c) Private consumption expenditure and government con-
sumption expenditure
Xpriðt; dÞ ¼ PpriðtÞ  XGDPðt; dÞ ð7Þ
Xgovðt; dÞ ¼ PgovðtÞ  XGDPðt; dÞ ð8Þ
Fig. 1. The study system.
S.Q. Weng et al. / Expert Systems with Applications 37 (2010) 8242–8254 8245
(d) Import and export
Pþ
imðt; sÞ  Xðt; d; sÞ P Ximðt; d; sÞ P P
imðt; sÞ  Xðt; d; sÞ ð9Þ
Pþ
exðt; sÞ  Xðt; d; sÞ P Xexðt; d; sÞ P Pexðt; sÞ  Xðt; d; sÞ ð10Þ
Pdeltaðt; dÞ  Xðt; dÞ P
X
s
Xexðt; d; sÞ 
X
s
Ximðt; d; sÞ
P Pdeltaðt; dÞ  Xðt; dÞ ð11Þ
(e) Fixed assets and working capital
Pþ
investðtÞ  XGDPðt; dÞ
P Xfixinðt; dÞ þ Xworðt; dÞ P P
investðtÞ  XGDPðt; dÞ ð12Þ
Xworðt; dÞ ¼ PworðtÞ  Xfixinðt; dÞ ð13Þ
Xdeltafixðt; d; sÞ ¼ Pfinalfixðt; sÞ  ðPalpha0ðt; sÞ  Xsfixinðt; d; sÞ
þ Palpha1ðt; sÞ  Xsfixinðt  1; d; sÞÞ ð14Þ
Xsfixasðt; d; sÞ ¼ ð1  Pdisprateðt; sÞÞ  Xsfixasðt  1; d; sÞ
þ Xdeltafixðt; d; sÞ ð15Þ
Xfixinðt; dÞ ¼
X
s
Xsfixinðt; d; sÞ þ Xwaterinðt; dÞ ð16Þ
(f) Investment for water project
Xbuild1ðt; dÞ ¼
X
j
Pcost1ðd; jÞXIOðt; jÞ

X
j
Pcost1ðd; jÞ  XIOðt  1; jÞ ð17Þ
Xbuild2ðt; dÞ ¼ PwwpriceðtÞ  ðPwwteatedðtÞ  Xwwasteðt; dÞ
 Pwwteatedðt  1Þ  Xwwasteðt  1; dÞÞ ð18Þ
Xbuild3ðt; dÞ ¼ PwsaveðtÞ  ðXasaveðt; dÞ  Xasaveðt  1; dÞÞ ð19Þ
Xwaterinðt; dÞ ¼ Xbuild1ðt; dÞ þ Xbuild2ðt; dÞ þ Xbuild3ðt; dÞ ð20Þ
(2) Agricultural sector constraints
(a) Crop area
Xacropðt; d; cÞ P P
acropðt  1; d; cÞ  Xacropðt  1; d; cÞ ð21Þ
Xacropðt; d; cÞ 6 Pþ
acropðt  1; d; cÞ  Xacropðt  1; d; cÞ ð22Þ
Xtacropðt; dÞ ¼
X
c
Xacropðt; d; cÞ=½1 þ PcropagnðdÞ ð23Þ
(b) Crop output
Xycropðt; d; cÞ ¼ Pycropðt; d; cÞ  Xacropðt; d; cÞ ð24Þ
Xmcropðt; d; cÞ ¼ Pmcropðt; d; cÞ  Xycropðt; d; cÞ ð25Þ
Xtmcropðt; dÞ ¼
X
c
Xmcropðt; d; cÞ ð26Þ
Xfood ¼
X
c
Xycropðt; d; cÞ ð27Þ
(c) Irrigation water
Xwcropðt; d; cÞ ¼ Pwcropðt; d; cÞ  Xacropðt; d; cÞ ð28Þ
Xtwcropðt; dÞ ¼
X
c
Xwcropðt; d; cÞ ð29Þ
(3) Forestry constraints
(a) Forest area
Xaforestðt; d; fÞ P P
aforestðt  1; d; fÞ  Xaforestðt  1; d; fÞ ð30Þ
Xaforestðt; d; fÞ 6 Pþ
aforestðt  1; d; fÞ  Xaforestðt  1; d; fÞ ð31Þ
Xtaforestðt; dÞ ¼
X
f
Xaforestðt; d; fÞ ð32Þ
(b) Forest output value
Xmforestðt; d; fÞ ¼ Pmforestðt; d; fÞ  Xaforestðt; d; fÞ ð33Þ
Xtmforestðt; dÞ ¼
X
f
Xmforestðt; d; fÞ ð34Þ
(c) Irrigation water
Xwforestðt; d; fÞ ¼ Pwforestðt; d; fÞ  Xaforestðt; d; fÞ ð35Þ
Xtwforestðt; dÞ ¼
X
f
Xwforestðt; d; fÞ ð36Þ
(4) Animal husbandry and fishery constraints
(a) Grass area
Xagrassðt; d; pÞ P P
agrassðt  1; d; pÞ  Xagrassðt  1; d; pÞ ð37Þ
Xagrassðt; d; pÞ 6 Pþ
agrassðt  1; d; pÞ  Xagrassðt  1; d; pÞ ð38Þ
(b) Production of livestock
Xlivestkðt; dÞ ¼
X
p
Plivestkðt; d; pÞ  Xagrassðt; d; pÞ ð39Þ
Xmpastureðt; dÞ ¼ Pmlivestk  Xlivestkðt; dÞ ð40Þ
(c) Water needed in animal husbandry and fishery
Xwgrassðt; d; pÞ ¼ Pwgrassðt; d; pÞ  Xagrassðt; d; pÞ ð41Þ
Xwlivestkðt; dÞ ¼ Pwlivestkðt; dÞ  Xlivestkðt; dÞ ð42Þ
Xwfishðt; dÞ ¼ Pwfishðt; dÞ  Xmfishðt; dÞ ð43Þ
Xtwothagriðt; dÞ ¼
X
p
Xwgrassðt; d; pÞ
þ Xwlivestkðt; dÞ þ Xwfishðt; dÞ ð44Þ
(5) Water resources constraints
(a) Water use pattern
Xwpopðt; dÞ ¼ Pwpopurbðt; dÞ  Xpopurbðt; dÞ
þ Pwpoprurðt; dÞ  Xpoprurðt; dÞ ð45Þ
Xagriðt; dÞ ¼ Xtwcropðt; dÞ þ Xtwforestðt; dÞ þ Xtwothagriðt; dÞ ð46Þ
Xwinduðt; dÞ ¼
X
s1
Xðt; d; s1Þ  Pwinduðt; s1Þ ð47Þ
Xwservðt; dÞ ¼
X
s2
Xðt; d; s2Þ  Pwservðt; s2Þ ð48Þ
(b) Wastewater discharge
Xwwasteðt;dÞ ¼ Xwinduðt;dÞ  PwwinduðtÞ
þ Xwservðt;dÞ  PwwservðtÞ þ Xwpopðt;dÞ  PwwpopðtÞ
ð49Þ
Xwwtreatedðt;dÞ ¼ Xwwasteðt;dÞ  PwwteatedðtÞ ð50Þ
(d) Total water use constraint
Xwtotalðt; dÞ ¼ Xwpopðt; dÞ þ Xwservðt; dÞ þ Xwinduðt; dÞ
þ Xwagriðt; dÞ ð51Þ
(e) Water balance constraint
Xwtotalðt; dÞ 6 Pwresourceðt; dÞ  Pwusecoeðt; dÞ
þ Xwwtreatedðt; dÞ ð52Þ
(6) Planting area constraints
(a) Increased planting area
Xatotalðt; dÞ P P
atotalðt; dÞ  Xatotalðt  1; dÞ ð53Þ
Xatotalðt; dÞ 6 Pþ
atotalðt; dÞ  Xatotalðt  1; dÞ ð54Þ
(b) Irrigation area
Xatotalðt; dÞ 6 Pamax ð55Þ
(c) Total planting area
X
p
Xagrassðt; d; pÞ þ
X
f
Xaforestðt; d; fÞ þ
X
c
Xacropðt; d; cÞ
6 Xatotalðt; dÞ ð56Þ
8246 S.Q. Weng et al. / Expert Systems with Applications 37 (2010) 8242–8254
(7) BOD discharge
XBODðt; dÞ ¼
X
s
PBODrateðt; sÞ  Xðt; d; sÞ þ PPBODðt; dÞ
 Xpopurbðt; dÞ  PTBODðtÞ

ð57Þ
The detailed nomenclatures for the variables and parameters are
provided in the Appendix. The MEMO model based on input-out-
put analysis can effective help quantify scenarios that are associ-
ated with different water resources management policies.
4. Integrated scenario-based multi-criteria decision support
system
In this study, an integrated scenario-based multi-criteria deci-
sion support system (SMC-DSS) will developed for planning water
resources management in the Haihe River Basin, where scenario
analysis and (MEMO) model will be incorporated with a multi-cri-
teria decision analysis (MCDA) framework. Fig. 2 shows a flowchart
of this SMC-DSS. In the SMC-DSS, scenario analysis is used to mod-
el the real water resources management policies, such that the
robustness of the policies can be tested by assessing their impacts
under different possible outcomes. Scenarios will be quantified by
the MEMO model which describes two dimensions. One dimension
addresses to the tread offs among the different objectives while an-
other one reflects the uncertainties in the time horizon examined.
4.1. Scenario characterization
Scenarios are stories or ‘‘snapshots” of what might be. Decision
makers often use scenarios to evaluate what to do under different
possible outcomes. The first step of the scenario analysis is to ana-
lyze the purpose of scenario characterization. If this is wrong, you
could provide a wrong analysis for the study problem. Therefore, it
is important for decision makers make appropriate purposes of
scenarios. Three main factors should be taken into account in the
process of scenario characterization. They are:
(1) Consider whether the purposes of scenarios are suitable for
decision making context. The context should be defined in
terms of issues that require a decision and include the rel-
evant time frame, location and actors associated with the
issue. Normally, stakeholders have identified an issue as
benefit from scenario analysis. For example, in the SMC-
DSS, the issue is focused on regional water resources
planning, in which regional development needs to be
sustainable in satisfying ecological, social and economic
objectives.
(2) Consider whether the scenarios will be used to identify or
assess decision options. Stakeholders may use scenarios to
identify feasible options in light of possible major changes,
such as shifts in economic conditions or population move-
ments (Kahane, 1992). Besides, they may use the same sce-
narios to examine the viability of an existing practice policy
such as the economic impact of saving water policy. The
choice depends on the concerned problem. In practice, the
two purposes are often combined through iterative scenario
generation method (Wollenberg, Edmunds,  Buck, 2000).
(3) Consider which stakeholders will participate in scenario
evaluation and how they represent different interests. This
is because (a) stakeholders can be a source of information
about the criteria in evaluating scenarios (Stewart  Scott,
1995), (b) they can screen or assign preferences to scenarios
and their impacts (Van Huylenbroeck  Coppens, 1995), and
(c) under given sufficient technical support, they can work
with scenarios interactively through providing the specifica-
tions (e.g., for GIS and DSS) (Malafant et al., 1997; Veldkamp
 Fresco, 1997).
4.2. System composition
The second step is to define the critical system components and
processes under consideration.
They include: (i) identification of components which can be
covered in detailed by the research group due to reasons of re-
search capacity; (ii) identification of the driving forces of the sys-
tem such as the structure of resources, actors, institutions, events
and relations, slow changing and predictable trends, and key
uncertainties and potential major drivers of change; (iii) identifica-
tion of the base year and the temporal resolution and extent for the
sustainable development purpose; and (iv) identification of the
spatial resolution and extent of scenarios.
The Haihe River Basin system can be defined as follows: (1) the
system components include economic variability (for a regional
planning, microeconomic variability is more important), environ-
mental variability (including water availability, water consump-
tion, and wastewater treatment), and social variability (i.e.
keeping the social stability); (2) driving forces are population and
socioeconomic conditions, soil and hydro-geological conditions,
water availability, and food security; (3) the spatial extent is the
Haihe River Basin; (4) the Haihe River Basin is further divided into
five districts: Beijing, Tianjing, Hebei, Lubei, Yubei (i.e. the spatial
resolution); (5) eight sectors are agriculture, mining, heavy manu-
facturing, light manufacturing, electrical machinery, construction,
transportation, and services; (6) temporal extent is up to 2030,
and the base year is 2000.
Start
Purpose of scenario analysis
Definition of the system under consideration
Generate qualitative scenarios
Quantify scenarios by the MEMO model
Solve the MEMO model through
the SGOC method for each scenario
Decision
Is the decision maker
satisfied?
Stop
N
Scenario evaluation and ranking
scenarios through MCDA
Fig. 2. Flowchart of SMC-DDS.
S.Q. Weng et al. / Expert Systems with Applications 37 (2010) 8242–8254 8247
4.3. Scenario generation
In the third step, a number of qualitative scenarios are gener-
ated based on an understanding of the system, which are described
in a narrative form. In the procedure of generating qualitative sce-
narios, the following steps should be considered:
(1) The reference scenarios or the baseline scenarios must be
decided. The reference scenarios describe plausible future
without any specific policy intervention. They serve as the
baselines to assess the impact of policy interventions on
the future state of the system.
(2) Policy scenarios are defined in order to assess the impact of a
certain policy intervention in the future. Generally, policy
scenarios are constructed based on the uncertainties exist-
ing in the system. For example, saving water is an important
policy for the arid region, while uncertainties may exist in
‘‘level of saving water”. Then, the scenarios could be built
as ‘‘medium level saving water” scenario and/or ‘‘high level
saving water” scenario.
(3) When examining the existing practical policies, identifica-
tion of the relationships among multiple uncertainties in
multiple policies is required. Then, the scenario based on
the combinations of these uncertainties should be consid-
ered (e.g., scenario under medium level of saving water
and medium level of supplying water).
The scenarios are constructed based on the combination of the
level of the three policies, where each scenario is described by a
three-digital code: the first digit stands for water saving policy,
the second digit denotes the level of protection of water resource
environment, and the third digit shows whether or not the
South–North water transfer project is put into effect. Table 1 shows
the details of the coding rule. For example, the ‘‘000” scenario
stands for medium saving water, stopping deterioration gradually,
and no water supply from transfer project, which serves as the
baseline scenario or reference scenario. Table 2 provides several
scenarios based on the purpose described before.
4.4. Scenario quantification
In this study, scenario analysis and multiobjective program-
ming approaches are integrated into a general framework. The
quantification of the scenarios is an important step to fulfill such
a combination. Firstly, indicators of the system state need to be de-
fined. Indicators are measurable and used to evaluate the outcome
of scenario analysis. A suite of indicators must provide enough
information to allow decision makers to choose suitable scenario
among scenario options. In addition, indicators should be cost-
effective to monitor and feasible to forecast confidently. Therefore,
definition of indicators is very important in quantitative scenario
analysis. In SMC-DSS, a number of environmental, economic and
social indicators are considered. These indicators could be simple
variables that are computed by one model or a combination of
the output of various models. Furthermore, it is desired to define
the indicators not only with respect to the included variables but
also to their temporal and spatial resolution. Secondly, various
driving forces need to be quantified. The driving forces defined
here are modeling inputs. In order to make quantitative assump-
tions about the future development of certain driving forces, their
historical data is firstly analyzed. Then, numerical values of the
driving forces that reflect the respective qualitative scenario are
defined for future times. Once all inputs necessary for the various
models is quantified, the models can be used to compute the sys-
tem indicators under the different reference and intervention
scenarios.
In this study, 10 indicators are selected which cover the three
dimensions of sustainability. They are described as follows:
 GDP per capita (GDP) — Gross Domestic Product, the most
important economic indicator. It represents a broad measure
of economic activity and signals the direction of overall aggre-
gate economic activity. GDP per capita is a more appropriate
indicator of the growth in living standards. Unit is Yuan/capita.
 GDP growth rate (%) (GDPRT) — It measures percent rate of GDP
increase year over year.
 Per capita personal consumption expenditures (PCE) — PCE is a
measure of price changes in consumer goods and services. It
consists of the actual and imputed expenditures of households,
and includes data pertaining to durables, non-durables, and ser-
vices. Unit is Yuan/capita.
 Per capita crop production (CP) — it is an indicator of food secu-
rity and social stability. Unit is kg/capita.
 Per capita industrial GDP (IGDP) — it is an indicator of industrial
modernization. Unit is Yuan/capita.
 Per cubic meter water GDP (WGDP) — it is an indicator of water
consumption efficiency. It is the ratio between total GDP and
Total water use.
 Per cubic meter water crop product (WCP) —it is an indicator of
regional agriculture water consumption efficiency. It is the ratio
between crop output value and Total irrigation water needed
for corps.
 Solid waste discharge (SWD) — it is an empirical value got from
industrial output value and statistics book. Unit is 10 thousand
ton.
 Regional total BOD discharge (BOD) —Biological Oxygen
Demand is a water-quality indicator. Unit is ton/year.
Table 1
Coding rule for scenarios.
Policies Level Code
Saving water policy Medium 0
High 1
Protection of environment Stop deterioration gradually 0
Stop deterioration immediately 1
South–North water transfer project No 0
East and Middle Route 1
Table 2
The list of scenarios.
Scenario
code
Scenario description
‘‘000” Baseline scenario, medium level saving water, stopping deterioration gradually, and no water transfer project under consideration
‘‘100” High level saving water, stopping deterioration gradually, and no water transfer project under consideration
‘‘010” Medium level saving water, stopping deterioration immediately, and no water transfer project under consideration
‘‘001” Medium level saving water, stopping deterioration gradually, and considering water transfer from two routes (i.e. east and middle routes)
‘‘111” Integrated scenario, high level saving water, stopping deterioration immediately, and considering water transfer from two routes (i.e. east and middle
routes)
8248 S.Q. Weng et al. / Expert Systems with Applications 37 (2010) 8242–8254
Wastewater discharge (WWD) — it comes from water use mul-
tiplied by wastewater discharge rate.
According to the scenarios defined in this case, the policy
parameters (i.e. policy scenarios) are introduced as follows:
(1) Water saving intensity
Water saving intensity (WSI) is a policy parameter to indicate
the level of water saving policy, which can be defined as:
WSI ¼
Water use intensity in each planning year
Water use intensity at present
The value of WSI is between 0 and 1 (see Table 3).
(2) Excessive volumes of underground water extraction
The volume of underground water extraction should be
smaller than the refill or renewable volume of the aquifers.
If underground water is being extracted faster than aquifers
can be recharged, it will cause water table dropping at well
locations, dry wells, seawater intrusions in groundwater
areas adjacent to the ocean, and land subsidence. Therefore,
excessive volumes of extraction should be stopped. Accord-
ing to the scenario definition, two levels have been defined.
One is stop immediately and the other is stop gradually (as
shown in Tables 4 and 5).
(3) Volume of using untreated wastewater
Using untreated wastewater will cause many problems, such
as human disease, wetlands, groundwater contamination,
and the effects on plant biomass. So in a sustainable way,
wastewater should be reused after treated. To stop
untreated wastewater using is one of the policies to protect
water resource environment. The value of this parameter is
also listed in Tables 4 and 5.
(4) The binary parameter of Transfer project
Whether or not the transfer project will put into effect is
identified by a binary parameter. This parameter is pre-
sented in Table 6.
(5) The amount of water supplied from Transfer project.
Table 3
WSI parameter during each planning year.
District Base year level High level water saving Medium level water saving
Sector 2000 2005 2010 2015 2020 2030 2005 2010 2015 2020 2030
Beijing Agriculture 1.00 0.95 0.92 0.88 0.84 0.8 0.98 0.96 0.94 0.92 0.90
Industry 1.00 0.92 0.8 0.7 0.6 0.5 0.94 0.88 0.80 0.72 0.64
Domestic 1.00 0.94 0.91 0.89 0.87 0.85 0.98 0.96 0.94 0.92 0.90
Tianjing Agriculture 1.00 0.95 0.92 0.88 0.84 0.8 0.98 0.96 0.94 0.92 0.90
Industry 1.00 0.95 0.8 0.7 0.6 0.5 0.94 0.88 0.80 0.72 0.64
Domestic 1.00 0.94 0.91 0.89 0.87 0.85 0.98 0.96 0.94 0.92 0.90
Hebei Agriculture 1.00 0.95 0.92 0.88 0.84 0.8 0.98 0.96 0.94 0.92 0.90
Industry 1.00 0.91 0.8 0.7 0.6 0.5 0.94 0.88 0.80 0.72 0.64
Domestic 1.00 0.94 0.91 0.89 0.87 0.85 0.98 0.96 0.94 0.92 0.90
Yubei Agriculture 1.00 0.95 0.92 0.88 0.84 0.8 0.98 0.96 0.94 0.92 0.90
industry 1.00 0.91 0.75 0.6 0.5 0.4 0.94 0.88 0.80 0.72 0.64
Domestic 1.00 0.94 0.91 0.89 0.87 0.85 0.98 0.96 0.94 0.92 0.90
Lubei Agriculture 1.00 0.95 0.92 0.88 0.84 0.8 0.98 0.96 0.94 0.92 0.90
Industry 1.00 0.91 0.75 0.6 0.5 0.4 0.94 0.88 0.80 0.72 0.64
Domestic 1.00 0.94 0.91 0.89 0.87 0.85 0.98 0.96 0.94 0.92 0.90
Table 4
Gradually stopping environmental deterioration parameter value.
District Maximum of excessive volumes of extraction (100 million m3
) Maximum of using untreated wastewater(100 million m3
)
2000 2005 2010 2015 2020 2030 2000 2005 2010 2015 2020 2030
Beijing 2.2 1.8 1.5 0 0 0 3.6 2.9 2.5 0 0 0
Tianjing 1.6 1.3 1.2 0 0 0 3.9 3.1 2.6 0 0 0
Hebei 42.8 34.3 10.1 0 0 0 7.9 6.3 3.7 0 0 0
Yubei 6.9 5.5 5.0 0 0 0 1.4 1.1 0.9 0 0 0
Lubei 1.7 1.4 1.3 0 0 0 6.3 5.0 3 0 0 0
Total 55.2 44.3 19.1 0 0 0 23.1 18.4 12.7 0 0 0
Table 5
Immediately stopping environmental deterioration parameter value.
District Maximum of excessive volumes of extraction (100 million m3
) Maximum of using untreated wastewater(100 million m3
)
2000 2005 2010 2015 2020 2030 2000 2005 2010 2015 2020 2030
Beijing 2.2 0 0 0 0 0 3.6 0 0 0 0 0
Tianjing 1.6 0 0 0 0 0 3.9 0 0 0 0 0
Hebei 42.8 0 0 0 0 0 7.9 0 0 0 0 0
Yubei 6.9 0 0 0 0 0 1.4 0 0 0 0 0
Lubei 1.7 0 0 0 0 0 6.3 0 0 0 0 0
Total 55.2 0 0 0 0 0 23.1 0 0 0 0 0
S.Q. Weng et al. / Expert Systems with Applications 37 (2010) 8242–8254 8249
According to the analysis of South–North transfer project, the
amount of water supplied from project is shown in Table 7.
4.5. Mutiobjective optimization
Decision makers are often hard to make decisions by lost their
orientations among so many solutions from which they have to
choose. They need a powerful tool to help them make a fast in
these problems. In SCM-DSS, Stochastic generating-oriented
choosing (SGOC) method is developed for quickly identifying a de-
sired decision. The approach first generates a large number of
objective weight vectors from uniform distribution stochastically,
and then the model is solved for each of these weight sets individ-
ually, thus a lot of Pareto-optimal solutions are generated. This
process serves as stochastic generating part. Moreover, a fuzzy
MCDA evaluation model, which is based on fuzzy theory and
MCDA technique, is developed to choose the most preferred solu-
tion at each iteration and shows the direction for next iteration
searching. That is oriented choosing part. SGOC could help decision
makers make fast decision by presenting only one solution to
them, and could be extended to an interactive approach by pre-
senting multiple solutions and let decision makers choose a direc-
tion by themselves. In SMC-DSS, SGOC is used to solve the ME-MO
model to get the system indicators under the different scenarios.
The final solution of SGOC algorithm in each scenario will be saved
for the purpose of further evaluation.
Fig. 3 presents the user interfaces of the developed decision
support system, named as HWRDS (an integrated scenario-based
multi-criteria decision support system (SMC-DSS) for water re-
sources planning in the Haihe River Basin), which is used for help-
ing decision makers easily find their satisfied solutions.
4.6. Scenario evaluation
This step is to evaluate the scenarios to identify an optimal pol-
icy. An optimal policy for the regional planning is chosen according
to the three criteria: efficiency, equity and ecological sustainability
(Van Pelt, 1993). To fulfill these criteria, MCDA is an effective
choice method for the evaluation of intervention scenarios. MCDA
is a ‘‘divide and conquer” strategy in the sense, such that a complex
issue can be subdivided into several parts that are easier to deal
with separately. The key feature of MCDA is a performance matrix,
or consequence table, in which each row describes an indicator,
and each column describes the performance of the options against
each indicator. A number of approaches are available to help han-
dle the multi-criteria decision making problems, such as analytical
hierarchy process (AHP), multi-objective programming (MOP), and
fuzzy MCDM techniques. For example, AHP uses procedures for
deriving the weights and the scores achieved by alternatives which
are based on pairwise comparisons between indicators and be-
tween options. Fuzzy MCDA is another type to address the impre-
cision that surrounds much of the data on which decision making
is based. The strength of the fuzzy approach is that it provides an
explicit way of representing vagueness in the decision maker’s
mind. Fuzzy sets firstly attempt to capture the idea that our natural
language in discussing issues is not precise, and then tries to cap-
ture these qualified assessments using the idea of a membership
function, through which an option would belong to the set of be-
tween 0 and 1.
In the SMC-DSS, a fuzzy MCDA evaluation model has been
developed for SGOC in order to choose the most preference solu-
tion for each scenario. In fuzzy MCDA evaluation model, the perfor-
mance matrix is constructed by the membership function of a
fuzzy set (i.e. the most preference set). Then, the ‘ideal-point’
method which directly performs over the performance matrix by
measuring options’ distances from ideal and negative ideal points
is applied to extract ordinal preference information. The fuzzy
membership function could be available by pressing the ‘‘EVALUA-
TION” button in Fig. 3. The results of all calculated scenarios have
been saved in the computer and could be found (Fig. 4). Scenarios
could be compared by marking them and pressing OK. Then, the
ranking information is shown in Fig. 5.
4.7. Interactive decision process
Effective decision making requires a continuous reassessment
of choices made in the past, the decision makers may learn from
the results of scenarios and find their own problems. Interactive
process in a decision system offers decision makers a chance to
redo the choices when they find that they are still difficult to make
decision based on the results or they realize their problems in the
Table 6
Binary parameter of South-North transfer project.
Name of project 2000 2005 2010 2015 2020 2025 2030
No transfer project East route 0 0 0 0 0 0 0
Middle route 0 0 0 0 0 0 0
East and middle route East route 0 0 1 1 1 1 1
Middle route 0 0 1 1 1 1 1
Table 7
The amount of water supplied from transfer project.
Name of
project
Beijing Tianjing Hebei Yubei Lubei
Amount of water
supplied
(100 million m3
)
East
route
0 0 22 0 10
Middle
route
12.20 12.39 40.65 6 0
Fig. 3. Interface of HWRDS.
8250 S.Q. Weng et al. / Expert Systems with Applications 37 (2010) 8242–8254
last iteration. In SMC-DSS, the last step is to give the decision mak-
ers a chance to express their feedback. If they are satisfied with the
results, the whole decision procedure will terminate. However, if
they think that the results are insufficient to make decision, the
process will go back to the section of scenario construction to rear-
range the scenarios. In this case, it is assumed that only single deci-
sion maker makes decision.
5. Result analysis and discussion
In this study, a number of scenarios based on different water re-
sources management policies were considered. The results indicate
that different water management policies could generate varied re-
sults of economic development. Table 8 provides the results under
the baseline scenario (i.e. ‘‘000” scenario), which includes a future
development in the line of the current situation in the Haihe River
Basin. Currently, although the saving water policy and water pro-
tection rules were implemented in this region, the intensity of
these policies would still need to be improved. In addition, the east
route of South–North water transfer project (under construction)
would be put into effect in 2008. Therefore, the baseline scenario
corresponds to medium level saving water, gradually stopping
environmental deterioration, and no supplying from transfer pro-
ject. Table 9 shows the results under saving water scenario (i.e.
‘‘100” scenario); in this scenario, only the WSI has been changed,
compared with the condition under the baseline scenario. The re-
sults for environment protection scenario (i.e. ‘‘010” scenario) are
listed in Table 10, in which ground water overdraft and untreated
wastewater discharged were stopped after 2005. Table 11 presents
the results for water supply scenario (i.e. ‘‘001” scenario shows the
effect of South–North Water transfer project). The results indicate
that, after 2010, the water transfer project would be put into effect
and could mitigate water shortage for this basin. Table 12 provides
the result under integration scenario (i.e. ‘‘111” scenario which in-
cludes three water policies implementation).
Fig. 6 shows the GDP growth curve obtained from the five sce-
narios. The economic development under the baseline scenario
would not be sustainable due to water shortage problem. Com-
pared with ‘‘111” scenario, its GDP would be decreased 16.8% by
2030; although the annual GDP growth rate would be about 7%
Fig. 4. Interface of scenario evaluation.
Fig. 5. Interface of evaluation result.
Table 8
Result for ‘‘000” scenario.
Year Population
(million)
GDP (billion
Yuan)
GDP growth
rate (%)
GDP per capita
(Yuan/capita)
2000 115.902 910.8415 0 9571.073
2005 123.1249 1322.736 7.48 13348.27
2010 129.953 1866.652 6.82 18127.44
2015 136.2625 2304.727 3.98 21488.02
2020 141.9336 2949.963 5.26 27023.76
2025 144.3725 3763.867 4.84 34335.19
2030 146.2336 4697.961 4.66 41880.03
Table 9
Result for ‘‘100” scenario.
Year Population
(million)
GDP (billion
Yuan)
GDP growth
rate (%)
GDP per capita
(Yuan/capita)
2000 115.902 910.8415 0 9571.073
2005 123.1249 1334.683 7.74 13488.02
2010 129.953 1911.69 7.16 18607.2
2015 136.2625 2408.065 4.56 22575.7
2020 141.9336 3103.459 5.04 28789.65
2025 144.3725 3969.31 5.02 36539.47
2030 146.2336 4964.494 4.7 44674.71
Table 10
Result for ‘‘010” scenario.
Year Population
(million)
GDP (billion
Yuan)
GDP growth
rate (%)
GDP per capita
(Yuan/capita)
2000 115.902 910.8415 0 9571.073
2005 123.1249 1310.031 7.06 13154.6
2010 129.953 1642.088 4.46 15602.37
2015 136.2625 2306.943 6.96 21427.65
2020 141.9336 2960.873 5.06 27163.82
2025 144.3725 3760.312 4.76 34222.37
2030 146.2336 4700.054 4.68 41838.3
Table 11
Result for ‘‘001” scenario.
Year Population
(million)
GDP (billion
Yuan)
GDP growth
rate (%)
GDP per capita
(Yuan/capita)
2000 115.902 910.8415 0 9571.073
2005 123.1249 1342.975 7.94 13582.2
2010 129.953 1995.96 7.96 19555.55
2015 136.2625 2754.999 6.18 26281.76
2020 141.9336 3549.496 5.1 33802.97
2025 144.3725 4451.91 4.56 41585.89
2030 146.2336 5486.248 4.44 50328.65
S.Q. Weng et al. / Expert Systems with Applications 37 (2010) 8242–8254 8251
by 2010, this high economic growth rate is based on the situation
of water resource system degradation and not a sustainable devel-
opment way. Therefore, water management policies are desired
and the implement force should be enhanced.
The best performance scenario would be ‘‘111” scenario which
improves the water saving intensity and obtains water from trans-
fer project after 2010. Under this scenario, the annual GDP growth
rate remains high level in a long term. In addition, underground
water use was limited and untreated wastewater use was also
stopped. Thus, the quality of river would keep in a good condition.
Therefore, this scenario could be recommended as a sustainable
development manner in study basin. In addition, when three poli-
cies work individually, water supply scenario (i.e. ‘‘001” scenario)
is better than other two scenarios. The results indicate that this
scenario would rank in the first place. This is because water trans-
fer project plans to draw water from the main stem of Yangtze
River, China, which has plenty of water resources. This water diver-
sion project could effectively eradicate the water shortage in the
Haihe River Basin. In addition, it also plays an important role in
the alleviation of water restoration and environment protection.
Although saving water policy is a main water policy for this basin,
it could merely mitigate water-supply pressure temporarily.
Environment protection scenario (i.e. ‘‘010” scenario) ranks the
last and it even drop behind the baseline scenario at beginning.
This is because underground water and untreated wastewater
are important for agriculture irrigation in this region. When water
from the two sources is limited, the effects on agriculture product
and economical development are significant. However, water re-
source protection is a fundamental policy to support the sustain-
able development and should be carried out confirmedly in the
basin. If ecological protection is ignored, the economical growth
would be limited in the coming decades. In many regions of the
world, water scarcity is viewed as a major threat to long-term food
security. If no enough food is supplied in a region, it might cause
social turbulence, especially in a region like the Haihe River Basin
that has significance for economy of the whole nation. This is why
maximum crop production is selected as the social objective of
ME-MO model. The results of total crop yield for different scenarios
are listed in Table 13 and the crop yield growth rates are presented
in Fig. 7.
All of the scenarios are ranked by HWRDS, based on the results
of performance indicators. The resulting rank is listed in Table 14.
The rank result shows that ‘‘111” scenario, which integrates the
three water management measures, is the desired policy. This im-
plies that an integrated water management policy has more posi-
tive effect on regional development. This is because (a) the Haihe
River Basin is one of the most water-deficient economical regions
in China, where water scarcity is a major threat to its long-term
economic development; (b) a desired water management policy
can facilitate to relieve such a threat and keep regional sustainable
development. Fig. 8 presents the result for scenario evaluation.
Water supply scenario (i.e. ‘‘001” scenario) ranks the highest
among the three policy scenarios. This means that water transfer
project is an effective approach to solve the water resources scar-
city problem in the basin. This also implies that saving water policy
is not enough to solve the water scarcity problem individually, and
thus water resources from other sources are needed. In addition,
after water transfer project goes into effect, the use of underground
water and untreated wastewater could be controlled more effec-
tively. Therefore, the South–North water transfer project should
be started as early as possible. Although saving water policy ranks
lower than water transfer scenario, it is also an important measure
for water shortage problem, especially in the arid region. Although
Table 12
Result for ‘‘111” scenario.
Year Population
(million)
GDP (billion
Yuan)
GDP growth
rate (%)
GDP per capita
(Yuan/capita)
2000 115.902 910.8415 0 9571.073
2005 123.1249 1346.089 8.08 13627.97
2010 129.953 2007.835 8.2 19715.35
2015 136.2625 2869.762 7.06 27458.43
2020 141.9336 3712.739 5.08 34831.99
2025 144.3725 4668.158 4.36 42430.71
2030 146.2336 5781.139 4.52 51562.29
0
1000
2000
3000
4000
5000
6000
2000 2005 2010 2015 2020 2025 2030 2035
Year
GDP
(billion
Yuan)
S-111
S-001
S-100
S-010
S-000
Fig. 6. GDP growth rate under different scenarios.
Table 13
Total crop product (million ton).
Year ‘‘000”
scenario
‘‘100”
scenario
‘‘010”
scenario
‘‘001”
scenario
‘‘111”
scenario
2000 9.880462 9.880462 9.880462 9.880462 9.880462
2005 10.57196 11.17643 10.80803 13.45286 12.70046
2010 11.20206 11.8992 11.16188 14.8146 14.13692
2015 11.53812 12.25617 12.18046 15.54437 15.35344
2020 12.04782 13.02769 13.01568 16.97262 16.60823
2025 12.8049 14.16231 14.10623 18.32839 18.12234
2030 13.42796 14.79236 14.88933 19.4513 18.96022
0
5
10
15
20
25
2000 2005 2010 2015 2020 2025 2030
Year
Total
Crop
Product
(10
6
ton)
S-000
S-100
S-010
S-001
S-111
Fig. 7. Crop yield growth rate under different scenarios.
Table 14
Result for scenario rank.
Scenario Social environment
index
Environment
resource index
Distance to
ideal point
‘‘111” scenario 0.495 0.728 0.3896
‘‘001” scenario 0.66 0.564 0.3898
‘‘100” scenario 0.518 0.683 0.3914
‘‘000” scenario 0.669 0.565 0.3967
‘‘010” scenario 0.568 0.583 0.4231
8252 S.Q. Weng et al. / Expert Systems with Applications 37 (2010) 8242–8254
‘‘010” scenario ranks the last and even fall behind baseline sce-
nario; it would affect regional development when the water pro-
tection policy was used individually. Generally, from the above
analyses, several recommendations could be obtained. They are:
(1) water management policies are crucial to solve water-shortage
issue and to support regional sustainable development; (2) water
transfer project from South to North is essential and should be
undertaken as soon as possible; (3) saving water policy should
be enforced from a long-term perspective; (4) environmental pro-
tection is important for regional sustainable development, but it
should be implemented with the other water management
policies.
6. Conclusions
In this study, an integrated scenario-based multi-criteria deci-
sion support system (SMC-DSS) has been developed for planning
water resources management in the Haihe River Basin. The system
components include system composition, scenario generation, sce-
nario quantification, multiobjective optimization, and scenario
evaluation. The developed SMC-DSS incorporates techniques of
scenario analysis, multiobjective programming (MOP), and multi-
criteria decision analysis (MCDA) within a decision support
systems (DSS) framework. SMC-DSS can solve complex water
resources management planning problem which may involve
multiple conflict objectives and need to concern uncertainty in a
long-term period. In SMC-DSS, scenario analysis is used to deal
with the uncertainty, MOP is used to handle multiple conflict
objectives, and MCDA is used to accomplish the scenario evalua-
tion. The SMC-DSS has two special characteristics that make it
unique compared with the other DSS techniques that deal with
decision making problems. Firstly, it can facilitate making
decisions with the support of computer technology because it
can generate optimal solution based on a great deal of calculations
done by computer. Secondly, it is effective for large-scale compli-
cated problems with thousands of parameters and variables under
uncertainty.
The developed SMC-DSS has been applied to planning water re-
sources management in the Haihe River Basin, China. A number of
scenarios based on different water resources management policies
have been conducted. The results indicate that different water
management policies can lead to varied results for regional
economic development. The results obtained are valuable for
supporting (i) water management policies are crucial to solve
water-shortage issue and to support regional sustainable develop-
ment; (ii) water transfer project from South to North is essential
and should be undertaken as soon as possible; (iii) saving water
policy should be enforced from a long-term perspective; (iv) envi-
ronment protection is very important for regional sustainable
development, but it should be combined with the other water
management policies.
Although this study is the first attempt for planning water re-
sources management through development such an integrated
decision support system, the results suggest that the developed
SMC-DSS could also be applied to other watersheds to facilitate
assessment of management policy impacts on socio-economic
and environmental sectors, as well as formulation of relevant man-
agement policies under uncertainty.
Acknowledgements
This research was supported by the Major State Basic Research
Development Program of MOST (2005CB724200, 2006CB403307,
and 2007CB714105), the Canadian Water Network under the Net-
works of Centers of Excellence (NCE), and the Natural Sciences and
Engineering Research Council of Canada.
References
Bashir, M. A., Tanakamaru, H.,  Tada, A. (2009). Spatial and temporal analysis of
evapotranspiration using satellite remote sensing data: A case study in the
Gezira Scheme, Sudan. Journal of Environmental Informatics, 13(2), 86–92.
Billionnet, A. (2009). Estimation of spatial influence models using mixed-integer
programming. Journal of Environmental Informatics, 14(1), 31–40.
Chang, N. B., Wen, C. G., Chen, Y. L.,  Yong, Y. C. (1996a). A grey fuzzy
multiobjective programming approach for the optimal planning of a
reservoir watershed. Part A: Theoretical development. Water Research, 30,
2329–2334.
Chang, N. B., Wen, C. G., Chen, Y. L.,  Yong, Y. C. (1996b). A grey fuzzy
multiobjective programming approach for the optimal planning of a reservoir
watershed. Part B: Application. Water Research, 30, 2335–2340.
Chao, L. (1998). The Haihe River Water Conservancy Commission Report.
Chen, B., Guo, H. C., Huang, G. H., Zhang, N., Wu, S. M.,  Zhang, Z. X. (2005).
ASRWM: An arid/semiarid region water management model. Engineering
Optimization, 37(6), 609–631.
Döll, P., Hauschild, M.,  Fuhr, D. (2000). Scenario development as a tool for
integrated analysis and regional planning. In German–Brazilian workshop on
neotropical ecosystems – Achievements and prospects of cooperative research
Hamburg, September 3–8, 2000. Session 7: Tools for integration of ecosystem
studies towards the development of management strategies.
Foran, B.,  Wardle, K. (1995). Transitions in land use and the problems of planning:
A case study from the mountain lands of New Zealand. Journal of Environmental
Management, 43, 97–127.
Glockner, G. D. (1996). Effects of air traffic congestion delays under several flow
management policies. Transportation Research Record, 1517, 29–36.
Fig. 8. Scenario evaluation chart.
S.Q. Weng et al. / Expert Systems with Applications 37 (2010) 8242–8254 8253
Hoyland, K.,  Wallace, S. W. (2001). Generating scenario trees for multistage
decision problems. Management Science, 47(2), 295–307.
Huang, G. H. (1996). IPWM: An interval parameter water quality management
model. Engineering Optimization, 26, 79–103.
Huang, G. H. (1998). A hybrid inexact-stochastic water management model.
European Journal of Operational Research, 107, 137–158.
Hydrosult, 1999. Strategic options for the water sector, T.A. 2817-PRC, Final Report
prepared by Hydrosult Inc.
Kahane, A. (1992). Scenarios for energy: Sustainable world vs global mercatilism.
Long Range Planning, 25(4), 38–46.
Leontief, Wassily (1986). Input–output economics. New York: Oxford University
Press.
Li, Y. P.,  Huang, G. H. (2009). Fuzzy-stochastic-based violation analysis method for
planning water resources management systems with uncertain information.
Information Sciences, 179, 4261–4276.
Li, Y. P., Huang, G. H.,  Nie, S. L. (2006). An interval-parameter multi-stage
stochastic programming model for water resources management under
uncertainty. Advances in Water Resources, 29, 776–789.
Li, Y. P., Huang, G. H., Nie, S. L.,  Liu, L. (2008). Inexact multistage stochastic integer
programming for water resources management under uncertainty. Journal of
Environmental Management, 88, 93–107.
Li, C. H., Yang, Z. F., Huang, G. H.,  Li, Y. P. (2009). Identification of relationship
between sunspots and natural runoff in the Yellow River based on discrete
wavelet analysis. Expert Systems with Applications, 36, 3309–3318.
Luo, B., Maqsood, I., Huang, G. H., Yin, Y. Y.,  Han, D. J. (2005). An inexact fuzzy two-
stage stochastic model for quantifying the efficiency of nonpoint source effluent
trading under uncertainty. Science of the Total Environment, 347, 21–34.
Malafant, K. W. J.,  Fordham, D. P. (1997). GIS, DSS and integrated scenario
modeling frameworks for exploring alternative futures. In: J. L. Uso, C. A.
Brebbia,  H. Power (Eds.), Proceedings of the conference on advance in ecological
sciences: Ecosystems and sustainable development, Peniscola, Spain, 14–16 October
1997 (Vol. 1, pp. 669–678).
Michnik, J.,  Trzaskalik, T. (2002). Multiple objective and goal programming: Recent
development (advances in soft computing). Berlin: Springer.
Moeffaert, D. V. (2003). Multicriteria decision aid in sustainable urban water
management, MSc thesis, Industrial Ecology, Royal Institute of Technology.
Mohren, G. M. J. (2003). Large-scale scenario analysis in forest ecology and forest
management. Forest Policy and Economics, 5, 103–110.
Mulvey, J. M.,  Vladimirou, H. (1989). Stochastic network optimisation models for
investment planning. Annals of Operation Research, 20, 187–217.
Nasiri, F., Maqsood, I., Huang, G.,  Fuller, N. (2007). Water quality index: A fuzzy
river-pollution decision support expert system. ASCE – Journal of Water
Resources Planning and Management, 133(2), 95–105.
Onnis, L., Sechi, G. M.,  Zuddas, P. (1999). Optimisation processes under
uncertainty, A.I.C.E., Milano, pp. 238–244.
Pallottino, S., Sechi, G. M.,  Zuddas, P. (2005). A DSS for water resources
management under uncertainty by scenario analysis. Environmental Modelling
and Software, 20, 1031–1042.
Qin, X. S., Huang, G. H., Chakma, A., Nie, X. H.,  Lin, Q. G. (2008). A MCDM-based
expert system for climate-change impact assessment and adaptation planning –
A case study for the Georgia Basin, Canada. Expert Systems with Applications, 34,
2164–2179.
Sakawa, M.,  Yano, H. (1990). An interactive fuzzy satisfying method for
generalized multiobjective linear programming problems with fuzzy
parameters. Fuzzy Sets Systems, 35, 125–142.
Seifi, A.,  Hipel, K. W. (2001). Interior-point method for reservoir operation with
stochastic inflows. ASCE – Journal of Water Resources Planning and Management,
127(1), 48–57.
Song, X. Y.,  Li, J. B. (2009). Land cover change detection using MSS and MODIS
data: A case study for Liangshan-Xiangling Region in southwestern China.
Journal of Environmental Informatics, 13(2), 119–126.
Stewart, J. T.,  Scott, L. (1995). A scenario-based framework for multicriteria
decision analysis in water resources planning. Water Recourses Research, 31(11),
2835–2843.
Van Huylenbroeck, G.,  Coppens, A. (1995). Multicriteria analysis of the conflicts
between rural development scenarios in the Gordon district, Scotland. Journal of
Environmental Planning and Management, 38(3), 393–407.
Van Pelt, M. J. F. (1993). Ecologically sustainable development and project appraisal
in developing countries. Ecological Economics, 7, 19–42.
Veldkamp, A.,  Fresco, L. O. (1997). Exploring land use scenarios: An alternative
approach based on actual land use. Agricultural System, 55(1), 1–17.
Wolf, J.,  Diepen, C. A. (1995). Effects of climate change on grain maize yield
potential in the European community. Climate Change, 29(3), 299–331.
Wollenberg, E., Edmunds, D.,  Buck, L. (2000). Using scenarios to make decisions
about the future: Anticipatory learning for the adaptive co-management of
community forests. Landscape and Urban Planning, 47, 65–77.
Yin, Y., Pierce, J. T.,  Love, E. (1995). Designing a multisector model for land
conversion study. Journal of Environmental Management, 44, 249–266.
Yoon, K. P.,  Hwang, C. L. (1995). Multiple attribute decision making: An introduction
(quantitative applications in the social sciences). Thousand Oaks, CA: SAGE.
8254 S.Q. Weng et al. / Expert Systems with Applications 37 (2010) 8242–8254

More Related Content

What's hot

What's hot (12)

CoCooN Exchange Workshop Poster
CoCooN Exchange Workshop PosterCoCooN Exchange Workshop Poster
CoCooN Exchange Workshop Poster
 
DSD-INT 2017 Basin Water Resources Management Planning in Indonesia - Hendarti
DSD-INT 2017 Basin Water Resources Management Planning in Indonesia - HendartiDSD-INT 2017 Basin Water Resources Management Planning in Indonesia - Hendarti
DSD-INT 2017 Basin Water Resources Management Planning in Indonesia - Hendarti
 
Flood forecasting presentation final
Flood forecasting presentation finalFlood forecasting presentation final
Flood forecasting presentation final
 
National Research Council - Guidelines on Undertaking a Comprehensive Analysi...
National Research Council - Guidelines on Undertaking a Comprehensive Analysi...National Research Council - Guidelines on Undertaking a Comprehensive Analysi...
National Research Council - Guidelines on Undertaking a Comprehensive Analysi...
 
Remarks at Delaware River Watershed Forum 2014 by Clare Billett, William Penn...
Remarks at Delaware River Watershed Forum 2014 by Clare Billett, William Penn...Remarks at Delaware River Watershed Forum 2014 by Clare Billett, William Penn...
Remarks at Delaware River Watershed Forum 2014 by Clare Billett, William Penn...
 
DSD-INT 2017 - Delft3D - Water Quality and Ecological Modeling Symposium - Fr...
DSD-INT 2017 - Delft3D - Water Quality and Ecological Modeling Symposium - Fr...DSD-INT 2017 - Delft3D - Water Quality and Ecological Modeling Symposium - Fr...
DSD-INT 2017 - Delft3D - Water Quality and Ecological Modeling Symposium - Fr...
 
Crop water informatics, bio-economic modelling and creating the conditions fo...
Crop water informatics, bio-economic modelling and creating the conditions fo...Crop water informatics, bio-economic modelling and creating the conditions fo...
Crop water informatics, bio-economic modelling and creating the conditions fo...
 
Targeting for diverse ecosystem zimmerman
Targeting for diverse ecosystem   zimmermanTargeting for diverse ecosystem   zimmerman
Targeting for diverse ecosystem zimmerman
 
A framework to assess wetlands' potential as Nature-based Solutions
A framework to assess wetlands' potential as Nature-based SolutionsA framework to assess wetlands' potential as Nature-based Solutions
A framework to assess wetlands' potential as Nature-based Solutions
 
Fate CEC’ in Animal Manure Amended Soils-Soil Processes
Fate CEC’ in Animal Manure Amended Soils-Soil ProcessesFate CEC’ in Animal Manure Amended Soils-Soil Processes
Fate CEC’ in Animal Manure Amended Soils-Soil Processes
 
Protection by Will Price, Program Director, Pinchot Institute for Conservation
Protection by Will Price, Program Director, Pinchot Institute for Conservation Protection by Will Price, Program Director, Pinchot Institute for Conservation
Protection by Will Price, Program Director, Pinchot Institute for Conservation
 
Water Management Strategies Using Multi-Criteria Decision Analysis in Santa C...
Water Management Strategies Using Multi-Criteria Decision Analysis in Santa C...Water Management Strategies Using Multi-Criteria Decision Analysis in Santa C...
Water Management Strategies Using Multi-Criteria Decision Analysis in Santa C...
 

Similar to An integrated scenario based multi-criteria decision support system for water

Ontario Society of Professional Engineers OSPE Green Infrastructure Roundtabl...
Ontario Society of Professional Engineers OSPE Green Infrastructure Roundtabl...Ontario Society of Professional Engineers OSPE Green Infrastructure Roundtabl...
Ontario Society of Professional Engineers OSPE Green Infrastructure Roundtabl...
Robert Muir
 
Assessment and Analysis of Maximum Precipitation at Bharkawada Village, Palan...
Assessment and Analysis of Maximum Precipitation at Bharkawada Village, Palan...Assessment and Analysis of Maximum Precipitation at Bharkawada Village, Palan...
Assessment and Analysis of Maximum Precipitation at Bharkawada Village, Palan...
RSIS International
 
Welcome to International Journal of Engineering Research and Development (IJERD)
Welcome to International Journal of Engineering Research and Development (IJERD)Welcome to International Journal of Engineering Research and Development (IJERD)
Welcome to International Journal of Engineering Research and Development (IJERD)
IJERD Editor
 

Similar to An integrated scenario based multi-criteria decision support system for water (20)

Ecosystem services for watershed management, Water Planning,
Ecosystem services for watershed management, Water Planning,Ecosystem services for watershed management, Water Planning,
Ecosystem services for watershed management, Water Planning,
 
Modernization.pptx
Modernization.pptxModernization.pptx
Modernization.pptx
 
abdel-fatah2018.pdf
abdel-fatah2018.pdfabdel-fatah2018.pdf
abdel-fatah2018.pdf
 
Ontario Society of Professional Engineers OSPE Green Infrastructure Roundtabl...
Ontario Society of Professional Engineers OSPE Green Infrastructure Roundtabl...Ontario Society of Professional Engineers OSPE Green Infrastructure Roundtabl...
Ontario Society of Professional Engineers OSPE Green Infrastructure Roundtabl...
 
Integrated and sustainable water management of Red-Thai Binh rivers system un...
Integrated and sustainable water management of Red-Thai Binh rivers system un...Integrated and sustainable water management of Red-Thai Binh rivers system un...
Integrated and sustainable water management of Red-Thai Binh rivers system un...
 
Assessment and Analysis of Maximum Precipitation at Bharkawada Village, Palan...
Assessment and Analysis of Maximum Precipitation at Bharkawada Village, Palan...Assessment and Analysis of Maximum Precipitation at Bharkawada Village, Palan...
Assessment and Analysis of Maximum Precipitation at Bharkawada Village, Palan...
 
Future of Urban Water Management
Future of Urban Water ManagementFuture of Urban Water Management
Future of Urban Water Management
 
Results, calculations, and assumptions of the resilience.io WASH sector in GA...
Results, calculations, and assumptions of the resilience.io WASH sector in GA...Results, calculations, and assumptions of the resilience.io WASH sector in GA...
Results, calculations, and assumptions of the resilience.io WASH sector in GA...
 
Welcome to International Journal of Engineering Research and Development (IJERD)
Welcome to International Journal of Engineering Research and Development (IJERD)Welcome to International Journal of Engineering Research and Development (IJERD)
Welcome to International Journal of Engineering Research and Development (IJERD)
 
Rainwater harvesting
Rainwater harvestingRainwater harvesting
Rainwater harvesting
 
DAFNE case study on the Zambezi river basin
DAFNE case study on the Zambezi river basinDAFNE case study on the Zambezi river basin
DAFNE case study on the Zambezi river basin
 
call for papers, research paper publishing, where to publish research paper, ...
call for papers, research paper publishing, where to publish research paper, ...call for papers, research paper publishing, where to publish research paper, ...
call for papers, research paper publishing, where to publish research paper, ...
 
Australia with a Drying Climate - Sustainable urban water management. By what...
Australia with a Drying Climate - Sustainable urban water management. By what...Australia with a Drying Climate - Sustainable urban water management. By what...
Australia with a Drying Climate - Sustainable urban water management. By what...
 
ESDA_Workshop_Mishra1.pdf
ESDA_Workshop_Mishra1.pdfESDA_Workshop_Mishra1.pdf
ESDA_Workshop_Mishra1.pdf
 
A REVIEW PAPER ON LOW COST SEWAGE TREATMENT BY ROOTZONE TECHNOLOGY FOR RESIDE...
A REVIEW PAPER ON LOW COST SEWAGE TREATMENT BY ROOTZONE TECHNOLOGY FOR RESIDE...A REVIEW PAPER ON LOW COST SEWAGE TREATMENT BY ROOTZONE TECHNOLOGY FOR RESIDE...
A REVIEW PAPER ON LOW COST SEWAGE TREATMENT BY ROOTZONE TECHNOLOGY FOR RESIDE...
 
Ce 401 introduction to environmental engineering
Ce 401 introduction to environmental engineeringCe 401 introduction to environmental engineering
Ce 401 introduction to environmental engineering
 
Engineered Nanoparticles in Food: Implications for Food Safety and Consumer H...
Engineered Nanoparticles in Food: Implications for Food Safety and Consumer H...Engineered Nanoparticles in Food: Implications for Food Safety and Consumer H...
Engineered Nanoparticles in Food: Implications for Food Safety and Consumer H...
 
Closing remarks dr kim geheb
Closing remarks dr kim gehebClosing remarks dr kim geheb
Closing remarks dr kim geheb
 
Development of an Open-Source Water Consumption Meter for Housing
Development of an Open-Source Water Consumption Meter for HousingDevelopment of an Open-Source Water Consumption Meter for Housing
Development of an Open-Source Water Consumption Meter for Housing
 
Development of an Open-Source Water Consumption Meter for Housing
Development of an Open-Source Water Consumption Meter for HousingDevelopment of an Open-Source Water Consumption Meter for Housing
Development of an Open-Source Water Consumption Meter for Housing
 

Recently uploaded

Prevalence, biochemical and hematological study of diabetic patients
Prevalence, biochemical and hematological study of diabetic patientsPrevalence, biochemical and hematological study of diabetic patients
Prevalence, biochemical and hematological study of diabetic patients
Open Access Research Paper
 
Willie Nelson Net Worth: A Journey Through Music, Movies, and Business Ventures
Willie Nelson Net Worth: A Journey Through Music, Movies, and Business VenturesWillie Nelson Net Worth: A Journey Through Music, Movies, and Business Ventures
Willie Nelson Net Worth: A Journey Through Music, Movies, and Business Ventures
greendigital
 
一比一原版(Lincoln毕业证)新西兰林肯大学毕业证成绩单
一比一原版(Lincoln毕业证)新西兰林肯大学毕业证成绩单一比一原版(Lincoln毕业证)新西兰林肯大学毕业证成绩单
一比一原版(Lincoln毕业证)新西兰林肯大学毕业证成绩单
tyvaq
 
Genetic diversity and association analysis for different morphological traits...
Genetic diversity and association analysis for different morphological traits...Genetic diversity and association analysis for different morphological traits...
Genetic diversity and association analysis for different morphological traits...
Open Access Research Paper
 
一比一原版EUR毕业证鹿特丹伊拉斯姆斯大学毕业证成绩单如何办理
一比一原版EUR毕业证鹿特丹伊拉斯姆斯大学毕业证成绩单如何办理一比一原版EUR毕业证鹿特丹伊拉斯姆斯大学毕业证成绩单如何办理
一比一原版EUR毕业证鹿特丹伊拉斯姆斯大学毕业证成绩单如何办理
exehay
 

Recently uploaded (20)

Prevention and Control of Water Pollution
Prevention and Control of Water PollutionPrevention and Control of Water Pollution
Prevention and Control of Water Pollution
 
Major-Environmental-Problems and Proven Solutions.pdf
Major-Environmental-Problems and Proven Solutions.pdfMajor-Environmental-Problems and Proven Solutions.pdf
Major-Environmental-Problems and Proven Solutions.pdf
 
Alert-driven Community-based Forest monitoring: A case of the Peruvian Amazon
Alert-driven Community-based Forest monitoring: A case of the Peruvian AmazonAlert-driven Community-based Forest monitoring: A case of the Peruvian Amazon
Alert-driven Community-based Forest monitoring: A case of the Peruvian Amazon
 
DRAFT NRW Recreation Strategy - People and Nature thriving together
DRAFT NRW Recreation Strategy - People and Nature thriving togetherDRAFT NRW Recreation Strategy - People and Nature thriving together
DRAFT NRW Recreation Strategy - People and Nature thriving together
 
Prevalence, biochemical and hematological study of diabetic patients
Prevalence, biochemical and hematological study of diabetic patientsPrevalence, biochemical and hematological study of diabetic patients
Prevalence, biochemical and hematological study of diabetic patients
 
Willie Nelson Net Worth: A Journey Through Music, Movies, and Business Ventures
Willie Nelson Net Worth: A Journey Through Music, Movies, and Business VenturesWillie Nelson Net Worth: A Journey Through Music, Movies, and Business Ventures
Willie Nelson Net Worth: A Journey Through Music, Movies, and Business Ventures
 
Artificial Reefs by Kuddle Life Foundation - May 2024
Artificial Reefs by Kuddle Life Foundation - May 2024Artificial Reefs by Kuddle Life Foundation - May 2024
Artificial Reefs by Kuddle Life Foundation - May 2024
 
Environmental Science Book By Dr. Y.K. Singh
Environmental Science Book By Dr. Y.K. SinghEnvironmental Science Book By Dr. Y.K. Singh
Environmental Science Book By Dr. Y.K. Singh
 
ppt on beauty of the nature by Palak.pptx
ppt on  beauty of the nature by Palak.pptxppt on  beauty of the nature by Palak.pptx
ppt on beauty of the nature by Palak.pptx
 
NRW Board Paper - DRAFT NRW Recreation Strategy
NRW Board Paper - DRAFT NRW Recreation StrategyNRW Board Paper - DRAFT NRW Recreation Strategy
NRW Board Paper - DRAFT NRW Recreation Strategy
 
@@how to Join @occult for money ritual..☎️+2349022657119.
@@how to Join @occult for money ritual..☎️+2349022657119.@@how to Join @occult for money ritual..☎️+2349022657119.
@@how to Join @occult for money ritual..☎️+2349022657119.
 
IPCC Vice Chair Ladislaus Change Central Asia Climate Change Conference 27 Ma...
IPCC Vice Chair Ladislaus Change Central Asia Climate Change Conference 27 Ma...IPCC Vice Chair Ladislaus Change Central Asia Climate Change Conference 27 Ma...
IPCC Vice Chair Ladislaus Change Central Asia Climate Change Conference 27 Ma...
 
International+e-Commerce+Platform-www.cfye-commerce.shop
International+e-Commerce+Platform-www.cfye-commerce.shopInternational+e-Commerce+Platform-www.cfye-commerce.shop
International+e-Commerce+Platform-www.cfye-commerce.shop
 
一比一原版(Lincoln毕业证)新西兰林肯大学毕业证成绩单
一比一原版(Lincoln毕业证)新西兰林肯大学毕业证成绩单一比一原版(Lincoln毕业证)新西兰林肯大学毕业证成绩单
一比一原版(Lincoln毕业证)新西兰林肯大学毕业证成绩单
 
Natural farming @ Dr. Siddhartha S. Jena.pptx
Natural farming @ Dr. Siddhartha S. Jena.pptxNatural farming @ Dr. Siddhartha S. Jena.pptx
Natural farming @ Dr. Siddhartha S. Jena.pptx
 
Sustainable farming practices in India .pptx
Sustainable farming  practices in India .pptxSustainable farming  practices in India .pptx
Sustainable farming practices in India .pptx
 
Genetic diversity and association analysis for different morphological traits...
Genetic diversity and association analysis for different morphological traits...Genetic diversity and association analysis for different morphological traits...
Genetic diversity and association analysis for different morphological traits...
 
一比一原版EUR毕业证鹿特丹伊拉斯姆斯大学毕业证成绩单如何办理
一比一原版EUR毕业证鹿特丹伊拉斯姆斯大学毕业证成绩单如何办理一比一原版EUR毕业证鹿特丹伊拉斯姆斯大学毕业证成绩单如何办理
一比一原版EUR毕业证鹿特丹伊拉斯姆斯大学毕业证成绩单如何办理
 
Environmental Impact Assessment (EIA) in Nepal.pptx
Environmental Impact Assessment (EIA) in Nepal.pptxEnvironmental Impact Assessment (EIA) in Nepal.pptx
Environmental Impact Assessment (EIA) in Nepal.pptx
 
Navigating the complex landscape of AI governance
Navigating the complex landscape of AI governanceNavigating the complex landscape of AI governance
Navigating the complex landscape of AI governance
 

An integrated scenario based multi-criteria decision support system for water

  • 1. An integrated scenario-based multi-criteria decision support system for water resources management and planning – A case study in the Haihe River Basin S.Q. Weng a,1 , G.H. Huang a,b,*, Y.P. Li b,2 a Environmental Systems Engineering Program, Faculty of Engineering, University of Regina, Regina, Sask, Canada S4S 0A2 b Research Academy of Energy and Environmental Studies, North China Electric Power University, Beijing 102206, China a r t i c l e i n f o Keywords: Decision making Haihe River Basin Multiobjective MCDM Policy Scenario analysis Water resources a b s t r a c t In this study, an integrated scenario-based multi-criteria decision support system (SMC-DSS) is devel- oped for planning water resources management in the Haihe River Basin. The SMC-DSS incorporates techniques of scenario analysis, multiobjective programming (MOP), and multi-criteria decision analysis (MCDA) within a decision support systems (DSS) framework. The system components include system composition, scenario generation, scenario quantification, multiobjective optimization, and scenario evaluation. SMC-DSS can solve complex water resources management planning problem which may involve several conflict objectives, and can deal with uncertainties expressed as possible outcomes. The SMC-DSS can be used for assessing management policy impacts on socio-economic and environmen- tal sectors and supporting the formulation of relevant management policies under uncertainty. It is effec- tive for large-scale problems with thousands of parameters and variables and in association with uncertain features. The developed SMC-DSS is then applied to planning water resources management in the Haihe River Basin, China. A number of scenarios based on different water resources management policies are conducted. The results indicate that different water management policies could lead to varied patterns for regional economic development and environmental protection. The results obtained are valuable for identifying desired water resources management policies and planning sustainable regional development patterns. Ó 2010 Elsevier Ltd. All rights reserved. 1. Introduction Water resources management is a complicated issue, which in- volves socio-economic and environmental impacts, as well as var- ious natural and human-disturbing factors (e.g., hydrologic and hydraulic condition, human activities); moreover, watersheds are usually characterized by various uncertainties associated with hydrological exogenous inflows and human demand patterns in the future. When water resources decision-making models are repeatedly simulated from a long-term perspective, thousands of constraints and variables are needed to be handled and decision makers are often overburdened by quantity and complexity of information generated by models. These complexities could become further amplified when various uncertainties must be con- sidered in developing any model (Li, Huang, & Nie, 2006). There- fore, designing a sound system for better addressing such complexities can help decision makers to manage water resources effectively and efficiently. Consequently, in the past decades, many systems analysis methods were developed in response to these complexities (Bashir, Tanakamaru, & Tada, 2009; Billionnet, 2009; Chang, Wen, Chen, & Yong, 1996a, 1996b; Foran & Wardle, 1995; Huang, 1996, 1998; Li & Huang, 2009; Li, Huang, Nie, & Liu, 2008; Li, Yang, Huang, & Li, 2009; Luo, Maqsood, Huang, Yin, & Han, 2005; Pallottino, Sechi, & Zuddas, 2005; Qin, Huang, Chakma, Nie, & Lin, 2008; Sakawa & Yano, 1990; Seifi & Hipel, 2001; Song & Li, 2009; Yin, Pierce, & Love, 1995). Among them, multiobjective programming (MOP) methods can provide valuable trade-off information among the conflict objectives; multi-criteria decision analysis (MCDA) provides a sys- tematic procedure to help decision makers choose the most desir- able and satisfactory alternative through analyzing multiple criteria by which the strengths and weaknesses of various adapta- tion options could be evaluated. Since the early 1970s, MCDM techniques have been developed into many forms and been exten- sively employed for a wide range of different case studies, such as river basin planning and groundwater remediation (Moeffaert, 2003). Generally, multi-criteria analysis consists of two major fields (Nasiri, Maqsood, Huang, & Fuller, 2007): (i) multiple- objective decision-making (MODM) (Chen et al., 2005; Michnik & 0957-4174/$ - see front matter Ó 2010 Elsevier Ltd. All rights reserved. doi:10.1016/j.eswa.2010.05.061 * Corresponding author. Tel.: +1 306 585 4095; fax: +1 306 585 4855. E-mail addresses: weng_sq@hotmail.com (S.Q. Weng), gordon.huang@uregina.ca (G.H. Huang), yongping.li@iseis.org (Y.P. Li). 1 Tel.: +1 306 585 4958; fax: +1 306 585 4855. 2 Tel.:/fax: +86 10 5197 1255. Expert Systems with Applications 37 (2010) 8242–8254 Contents lists available at ScienceDirect Expert Systems with Applications journal homepage: www.elsevier.com/locate/eswa
  • 2. Nomenclature t planning year (2000, 2005, 2010, 2015, 2020, 2025 and 2030) d district (Beijing, Tianjin, Hebei, Lubei, Yubei) s sector (Agriculture, Mining, Heavy manufacturing, Light manufacturing, Electrical machinery, construction, Transportation, Services) s1 industrial sector (Mining, Heavy manufacturing, Light manufacturing, Electrical machinery, construction, Transportation) s2 service sector c number of crops (grain, wheat, vegetable, cotton, sum- mer corn, autumn corn) f type of forest, including man-made forest and natural forest p type of grassland, p = 1 irrigation grassland, p = 2 natural grassland A matrix of input coefficients. For a given time period and district, it is a (8 8) matrix whose elements aij give the quantity of the output of sector i absorbed by sector j per unit of its total output j aij input coefficient of product of sector i into sector j Bfixin matrix of capital coefficients of investment in fixed as- sets Bgov matrix of capital coefficients of government consump- tion expenditure Bpri matrix of capital coefficients of private consumption expenditure Bwor matrix of capital coefficients of working capital I an identity matrix J project, where j = 1, 2 denote east route and middle route water transfer project) P invest lower bound of GDP investment rate coefficient Pþ invest upper bound of GDP investment rate coefficient P atotal lower bound of total planting area rising rate Pþ atotal upper bound of total planting area rising rate P im lower bound of import coefficient Pþ im upper bound of import coefficient P acrop lower bound of planting area rising rate for each crop Pþ acrop upper bound of planting area rising rate for each crop P aforest lower bound of increasing area for each type of forest Pþ aforest upper bound of increasing area for each type of forest P agrass lower bound of increasing area for each type of grass- land Pþ agrass upper bound of increasing area for each type of grass- land P ex lower bound of export coefficient Pþ ex upper bound of export coefficient Palpha0 generation coefficient of fixed asset value in time period t Palpha1 generation coefficient of fixed asset value in time period t 1 Pamax total available irrigation area PBODrate BOD discharge rate per unit of 10 million Yuan output value of each sector Pcita output rate of fixed assets Pcost1 cost of each project Pcropagn duplicate planting coefficient Pdelta upper bound of (balance of trade/GDP) Pdisprate fixed asset depreciation rate Pfinalfix final generation coefficient of fixed assets PGDP added value rate Pgov government consumption coefficient Plivestk heads of livestock fed by Unit area grassland Pmcrop crop output value per unit yield Pmforest forest output value per unit area Pmivestk unit livestock price PPBOD BOD discharge per resident Ppri private consumption coefficient PTBOD residual rate of wastewater treatment rate Pwcrop irrigation water per unit crop area Pwfish water use for fishery per unit of 10,000 Yuan output va- lue Pwforest irrigation water per unit forest area Pwgrass water use per unit grassland area Pwindu water use per unit of 10,000 Yuan output value of indus- try Pwlivestk water use per head of livestock Pwor investment coefficient of working capital Pwpoprur rural water use per capita Pwpopurb urban water use per capita Pwresource total amount of water resource Pwsave cost of unit water-save irrigation area Pwserv water use per unit of 10,000 Yuan output value of ser- vice Pwusecoe water resource utilization coefficient Pwwindu industrial wastewater discharge rate Pwwpop resident wastewater discharge rate Pwwprice cost of new unit wastewater treatment capacity Pwwserv service wastewater discharge rate Pwwteated wastewater treatment rate Pwwteated wastewater treatment rate Pycrop crop yield per unit area X output value of industrial sector s in district d in time period t Xacrop planting area for each crop Xaforest area of a forest Xagrass grassland area Xagri water use for agriculture Xasave area of water-save irrigation XBOD amount of BOD discharge Xbuild1 cost of south-to-north water transfer project in Haihe River Basin Xbuild2 cost of wastewater treatment Xbuild3 cost of save water project Xdeltafix fixed asset increment in the time period t Xex exports Xfixas fixed assets Xfixin investment in fixed assets XFOOD total crop output XGDP gross domestic production Xgov government consumption expenditure Xim imports XIO 0–1 variable. 0 means the project does not taken while 1 denotes the project will be undertaken Xlivestk production of livestock Xmcrop crop output value Xmfish output value of fishery Xmforest forest output value Xmpasture output value Xpoprur rural population Xpopurb urban population Xpri private consumption expenditure Xsfixas fixed assets in sector s Xsfixin investment in fixed assets in sector s Xtacrop total planting area Xtaforest total forest area Xtmcrop total crop value Xtmforest total forest output value S.Q. Weng et al. / Expert Systems with Applications 37 (2010) 8242–8254 8243
  • 3. Trzaskalik, 2002), which works on continuous decision spaces, pri- marily on mathematical programming with several objective func- tions; and (ii) multiple-attribute decision-making (MADM) (Yoon Hwang, 1995), which focuses on problems with discrete decision spaces to choose an optimal alternative from a set of alternatives with respect to multiple evaluation attributes, and in relation to attribute weights. Scenario analysis method is a useful technique for addressing uncertainties existing in the system components. The typical char- acteristic of this method is that it can model many real problems where decisions are based on uncertain information presented as a set of possible outcomes (i.e. scenarios). A scenario represents a possible realization of sets of uncertain data in the time horizon examined (Onnis, Sechi, Zuddas, 1999). Previously, a number of scenario analysis methods were developed for a variety of fields, including land-use planning (Foran Wardle, 1995; Yin et al., 1995), climate change (Wolf Diepen, 1995), air traffic manage- ment (Glockner, 1996), forest ecology and forest management (Mohren, 2003), investment planning (Mulvey Vladimirou, 1989), insurance policy analysis (Hoyland Wallace, 2001), and regional planning (Döll, Hauschild, Fuhr, 2000). However, few applications to water resources management were reported. Pallottino et al. (2005) proposed a scenario analysis model for water resources management under uncertainty; however, in this method, a single objective function was considered to identify a complete set of decision variables under uncertainty. Moreover, most of the previous studies either developed optimization models for describing interactions among resources, economy and envi- ronment, or evaluating effects of resources management policy on environmental and/or economy objectives. There is lacking of methods integrating these efforts into a general framework based on decision support systems (DSS). In fact, an integrated DSS that combines scenario analysis, MOP and MCDA techniques will help generate more effective and efficient water resources management plans. Therefore, the objective of this study aims to develop such an integrated scenario-based multi-criteria decision support system (SMC-DSS) for planning water resources management in the Haihe River Basin. The system components include system composition, scenario generation, scenario quantification, multiobjective opti- mization, and scenario evaluation. The SMC-DSS will incorporate techniques of scenario analysis, multiobjective programming (MOP), and multi-criteria decision analysis (MCDA) within a deci- sion support systems (DSS) framework. In SMC-DSS, scenario anal- ysis will be used to model the policies for water resources management, MOP will be used to handle multiple conflict objec- tives, and MCDA will be used to accomplish the scenario evalua- tion. The robustness of the various policies can thus be examined through assessing their impacts under different possible outcomes. The developed SMC-DSS is then applied to planning water re- sources management in the Haihe River Basin, China. A number of scenarios based on different water resources management poli- cies will be conducted. The results obtained will be valuable for supporting water resources management and planning regional economic development. 2. The study system The Haihe River Basin is located in the northern part of China, which lies between the Songliao Plain (in the northeast) and the Yellow River Basin (to the south and west) (as shown in Fig. 1). The basin has two major rivers: the Haihe River and the Luanhe River (including their tributaries). The Haihe River Basin covers two municipalities of Beijing and Tianjin, and more than 20 large and medium-sized cities in the Hebei, Shandong, Shanxi and Henan Provinces. The Haihe River Basin is characterized by a semi-humid climate in the monsoon region of the East Asia Warm Temperate Zone. It has an extremely uneven rainfall distribution. It is dry and cold in the winter, while with low rainfall level in the spring and heavy rainfall in the summer. The average annual pre- cipitation is 548 mm, with approximately 80% of rainfall occurring during June to September. The basin area is about 318,800 km2 , where 189,000 km2 is mountainous and the rest is flood plain (Chao, 1998). The Haihe River Basin is important for China due to the facts that (i) it can produce about 10% of China’s total grain output, (ii) the people living in this basin occupies 10% of Chinese total popu- lation, (iii) it is the center of many industrial and human activities, and (iv) it is nearly close to the nation’s capital city, Beijing. Cur- rently, this basin is facing a number of challenging questions such as (i) since this region is one of the driest regions in China, it faces serious water scarcity; for example, in 1998, the water availability per capita was about 430 m3 /capita, which is far below the average level of 1000 m3 /capita, an internationally accepted definition for water scarcity (Hydrosult, 1999); (ii) rapid economic and popula- tion growth rates lead to rising water demands from urban and industrial sectors, and thus increasing pressure on water supplies; (iii) water pollution is very serious in this basin because large vol- umes of raw sewage are dumped daily into the rivers in the basin, while most of the industrial wastewaters have not been treated; (iv) water tables have dropped substantially due to immoderately using underground water, while the underground water is being extracted faster than aquifers can be recharged. These issues have made the regional water resource system degradation. Conse- quently, a variety of water management policies have been under- taken. They include: (1) Saving water policy – This policy is implemented through the application of saving water technologies such as control- ling leakage, promoting reusing water, taking rational prices for domestic and industry sectors, improving irrigation effi- ciency, using spray and drip irrigation system, developing drought resistant crop varieties (i.e. using bio-technical technology to breed new crops which need little water), and reducing evapotranspiration rate through using plastic film and mulches in the agriculture sector. Xtwcrop total irrigation water needed for corps Xtwforest total irrigation water needed for forests Xtwothagri total water use for both animal husband and fishery Xwaterin total investment in water projects Xwcrop irrigation water needed for a crop Xwfish total water use for fishery Xwforest irrigation water needed for a type of forest Xwgrass total water use for grassland Xwindu water use for industry Xwlivestk total water use for livestock Xwor working capital Xwpop water use for resident Xwserv water use for service Xwtotal total water use Xwwaste discharge of wastewater Xwwaste total amount of wastewater discharge Xwwtreated amount of treated wastewater Xycrop yield of crop 8244 S.Q. Weng et al. / Expert Systems with Applications 37 (2010) 8242–8254
  • 4. (2) Protecting water resources policy – This policy focuses on protection of underground water resources including build- ing up wastewater treatment infrastructure to reduce wastewater discharge and charging more economic fees for excess wastewater discharges; besides, the underground water supplies are limited such as requiring permits for dril- ling new wells and extracting more water from wells, and establishing control measures to avoid underground aquifer pollution. (3) South–North water transfer project – This project can trans- fer water from the water-rich region (southern part of China) to the water-deficit region (northern part of China), while three water diversion routes are building (namely the east route, middle route, and west route); the estimated construction cost for east and middle route is about 22 bil- lion US dollars. Although the above policies have been conducted to facilitate the regional water resources management, the competitions for water among municipal, industrial and agricultural users have been intensifying with the rapidly increasing economic and popu- lation growth rates. The available water resources are becoming over utilized and there is an urgent need to develop sound management plans. The users are of increasing concerns on the quantity and quality of water supply. When faced with disadvan- tageous climate and river-flow conditions, water-shortage prob- lems would arise particularly under poorly planned allocation schemes. Consequently, effectively planning for water sources management in the study river basin is desired. An integrated sce- nario-based multi-criteria decision support system (SMC-DSS) will thus be developed for planning water resources in the study Basin. 3. Microeconomic multiobjective water management model A microeconomic multiobjective water management (MEMO) model is developed for the study system, where input–output analysis method is used to describe the microeconomic system. In- put–output analysis is a useful tool for systematically quantifying the interrelationships among various sectors in a complex eco- nomic system, which is first proposed by Leontief Professor who was awarded the 1973 Nobel Prize in Economic Science (Leontief, 1986). Consequently, the MEMO model can be formulated as follows: Objectives: ZGDP ¼ max X t X d XGDPðt; dÞ ( ) ð1Þ ZBOD ¼ min X t X d XBODðt; dÞ ( ) ð2Þ ZFOOD ¼ max X t X d XFOODðt; dÞ ( ) ð3Þ Constraints: (1) Microeconomic constraints (a) Input–Output equation ðI AÞ Xðt; d; sÞ ¼ Bpriðt; sÞ Xpriðt; dÞ þ Bgovðt; sÞ Xgovðt; dÞ þ Bfixinðt; sÞ Xfixinðt; dÞ þ Bworðt; sÞ Xworðt; dÞ þ Xexðt; d; sÞ Ximðt; d; sÞ ð4Þ (b) Production and GDP Xðt; d; sÞ 6 Pcitaðt; sÞ Xfixasðt; d; sÞ ð5Þ XGDPðt; dÞ ¼ X 8 s¼1 PGDPðt; d; sÞ Xðt; d; sÞ ð6Þ (c) Private consumption expenditure and government con- sumption expenditure Xpriðt; dÞ ¼ PpriðtÞ XGDPðt; dÞ ð7Þ Xgovðt; dÞ ¼ PgovðtÞ XGDPðt; dÞ ð8Þ Fig. 1. The study system. S.Q. Weng et al. / Expert Systems with Applications 37 (2010) 8242–8254 8245
  • 5. (d) Import and export Pþ imðt; sÞ Xðt; d; sÞ P Ximðt; d; sÞ P P imðt; sÞ Xðt; d; sÞ ð9Þ Pþ exðt; sÞ Xðt; d; sÞ P Xexðt; d; sÞ P Pexðt; sÞ Xðt; d; sÞ ð10Þ Pdeltaðt; dÞ Xðt; dÞ P X s Xexðt; d; sÞ X s Ximðt; d; sÞ P Pdeltaðt; dÞ Xðt; dÞ ð11Þ (e) Fixed assets and working capital Pþ investðtÞ XGDPðt; dÞ P Xfixinðt; dÞ þ Xworðt; dÞ P P investðtÞ XGDPðt; dÞ ð12Þ Xworðt; dÞ ¼ PworðtÞ Xfixinðt; dÞ ð13Þ Xdeltafixðt; d; sÞ ¼ Pfinalfixðt; sÞ ðPalpha0ðt; sÞ Xsfixinðt; d; sÞ þ Palpha1ðt; sÞ Xsfixinðt 1; d; sÞÞ ð14Þ Xsfixasðt; d; sÞ ¼ ð1 Pdisprateðt; sÞÞ Xsfixasðt 1; d; sÞ þ Xdeltafixðt; d; sÞ ð15Þ Xfixinðt; dÞ ¼ X s Xsfixinðt; d; sÞ þ Xwaterinðt; dÞ ð16Þ (f) Investment for water project Xbuild1ðt; dÞ ¼ X j Pcost1ðd; jÞXIOðt; jÞ X j Pcost1ðd; jÞ XIOðt 1; jÞ ð17Þ Xbuild2ðt; dÞ ¼ PwwpriceðtÞ ðPwwteatedðtÞ Xwwasteðt; dÞ Pwwteatedðt 1Þ Xwwasteðt 1; dÞÞ ð18Þ Xbuild3ðt; dÞ ¼ PwsaveðtÞ ðXasaveðt; dÞ Xasaveðt 1; dÞÞ ð19Þ Xwaterinðt; dÞ ¼ Xbuild1ðt; dÞ þ Xbuild2ðt; dÞ þ Xbuild3ðt; dÞ ð20Þ (2) Agricultural sector constraints (a) Crop area Xacropðt; d; cÞ P P acropðt 1; d; cÞ Xacropðt 1; d; cÞ ð21Þ Xacropðt; d; cÞ 6 Pþ acropðt 1; d; cÞ Xacropðt 1; d; cÞ ð22Þ Xtacropðt; dÞ ¼ X c Xacropðt; d; cÞ=½1 þ PcropagnðdÞ ð23Þ (b) Crop output Xycropðt; d; cÞ ¼ Pycropðt; d; cÞ Xacropðt; d; cÞ ð24Þ Xmcropðt; d; cÞ ¼ Pmcropðt; d; cÞ Xycropðt; d; cÞ ð25Þ Xtmcropðt; dÞ ¼ X c Xmcropðt; d; cÞ ð26Þ Xfood ¼ X c Xycropðt; d; cÞ ð27Þ (c) Irrigation water Xwcropðt; d; cÞ ¼ Pwcropðt; d; cÞ Xacropðt; d; cÞ ð28Þ Xtwcropðt; dÞ ¼ X c Xwcropðt; d; cÞ ð29Þ (3) Forestry constraints (a) Forest area Xaforestðt; d; fÞ P P aforestðt 1; d; fÞ Xaforestðt 1; d; fÞ ð30Þ Xaforestðt; d; fÞ 6 Pþ aforestðt 1; d; fÞ Xaforestðt 1; d; fÞ ð31Þ Xtaforestðt; dÞ ¼ X f Xaforestðt; d; fÞ ð32Þ (b) Forest output value Xmforestðt; d; fÞ ¼ Pmforestðt; d; fÞ Xaforestðt; d; fÞ ð33Þ Xtmforestðt; dÞ ¼ X f Xmforestðt; d; fÞ ð34Þ (c) Irrigation water Xwforestðt; d; fÞ ¼ Pwforestðt; d; fÞ Xaforestðt; d; fÞ ð35Þ Xtwforestðt; dÞ ¼ X f Xwforestðt; d; fÞ ð36Þ (4) Animal husbandry and fishery constraints (a) Grass area Xagrassðt; d; pÞ P P agrassðt 1; d; pÞ Xagrassðt 1; d; pÞ ð37Þ Xagrassðt; d; pÞ 6 Pþ agrassðt 1; d; pÞ Xagrassðt 1; d; pÞ ð38Þ (b) Production of livestock Xlivestkðt; dÞ ¼ X p Plivestkðt; d; pÞ Xagrassðt; d; pÞ ð39Þ Xmpastureðt; dÞ ¼ Pmlivestk Xlivestkðt; dÞ ð40Þ (c) Water needed in animal husbandry and fishery Xwgrassðt; d; pÞ ¼ Pwgrassðt; d; pÞ Xagrassðt; d; pÞ ð41Þ Xwlivestkðt; dÞ ¼ Pwlivestkðt; dÞ Xlivestkðt; dÞ ð42Þ Xwfishðt; dÞ ¼ Pwfishðt; dÞ Xmfishðt; dÞ ð43Þ Xtwothagriðt; dÞ ¼ X p Xwgrassðt; d; pÞ þ Xwlivestkðt; dÞ þ Xwfishðt; dÞ ð44Þ (5) Water resources constraints (a) Water use pattern Xwpopðt; dÞ ¼ Pwpopurbðt; dÞ Xpopurbðt; dÞ þ Pwpoprurðt; dÞ Xpoprurðt; dÞ ð45Þ Xagriðt; dÞ ¼ Xtwcropðt; dÞ þ Xtwforestðt; dÞ þ Xtwothagriðt; dÞ ð46Þ Xwinduðt; dÞ ¼ X s1 Xðt; d; s1Þ Pwinduðt; s1Þ ð47Þ Xwservðt; dÞ ¼ X s2 Xðt; d; s2Þ Pwservðt; s2Þ ð48Þ (b) Wastewater discharge Xwwasteðt;dÞ ¼ Xwinduðt;dÞ PwwinduðtÞ þ Xwservðt;dÞ PwwservðtÞ þ Xwpopðt;dÞ PwwpopðtÞ ð49Þ Xwwtreatedðt;dÞ ¼ Xwwasteðt;dÞ PwwteatedðtÞ ð50Þ (d) Total water use constraint Xwtotalðt; dÞ ¼ Xwpopðt; dÞ þ Xwservðt; dÞ þ Xwinduðt; dÞ þ Xwagriðt; dÞ ð51Þ (e) Water balance constraint Xwtotalðt; dÞ 6 Pwresourceðt; dÞ Pwusecoeðt; dÞ þ Xwwtreatedðt; dÞ ð52Þ (6) Planting area constraints (a) Increased planting area Xatotalðt; dÞ P P atotalðt; dÞ Xatotalðt 1; dÞ ð53Þ Xatotalðt; dÞ 6 Pþ atotalðt; dÞ Xatotalðt 1; dÞ ð54Þ (b) Irrigation area Xatotalðt; dÞ 6 Pamax ð55Þ (c) Total planting area X p Xagrassðt; d; pÞ þ X f Xaforestðt; d; fÞ þ X c Xacropðt; d; cÞ 6 Xatotalðt; dÞ ð56Þ 8246 S.Q. Weng et al. / Expert Systems with Applications 37 (2010) 8242–8254
  • 6. (7) BOD discharge XBODðt; dÞ ¼ X s PBODrateðt; sÞ Xðt; d; sÞ þ PPBODðt; dÞ Xpopurbðt; dÞ PTBODðtÞ ð57Þ The detailed nomenclatures for the variables and parameters are provided in the Appendix. The MEMO model based on input-out- put analysis can effective help quantify scenarios that are associ- ated with different water resources management policies. 4. Integrated scenario-based multi-criteria decision support system In this study, an integrated scenario-based multi-criteria deci- sion support system (SMC-DSS) will developed for planning water resources management in the Haihe River Basin, where scenario analysis and (MEMO) model will be incorporated with a multi-cri- teria decision analysis (MCDA) framework. Fig. 2 shows a flowchart of this SMC-DSS. In the SMC-DSS, scenario analysis is used to mod- el the real water resources management policies, such that the robustness of the policies can be tested by assessing their impacts under different possible outcomes. Scenarios will be quantified by the MEMO model which describes two dimensions. One dimension addresses to the tread offs among the different objectives while an- other one reflects the uncertainties in the time horizon examined. 4.1. Scenario characterization Scenarios are stories or ‘‘snapshots” of what might be. Decision makers often use scenarios to evaluate what to do under different possible outcomes. The first step of the scenario analysis is to ana- lyze the purpose of scenario characterization. If this is wrong, you could provide a wrong analysis for the study problem. Therefore, it is important for decision makers make appropriate purposes of scenarios. Three main factors should be taken into account in the process of scenario characterization. They are: (1) Consider whether the purposes of scenarios are suitable for decision making context. The context should be defined in terms of issues that require a decision and include the rel- evant time frame, location and actors associated with the issue. Normally, stakeholders have identified an issue as benefit from scenario analysis. For example, in the SMC- DSS, the issue is focused on regional water resources planning, in which regional development needs to be sustainable in satisfying ecological, social and economic objectives. (2) Consider whether the scenarios will be used to identify or assess decision options. Stakeholders may use scenarios to identify feasible options in light of possible major changes, such as shifts in economic conditions or population move- ments (Kahane, 1992). Besides, they may use the same sce- narios to examine the viability of an existing practice policy such as the economic impact of saving water policy. The choice depends on the concerned problem. In practice, the two purposes are often combined through iterative scenario generation method (Wollenberg, Edmunds, Buck, 2000). (3) Consider which stakeholders will participate in scenario evaluation and how they represent different interests. This is because (a) stakeholders can be a source of information about the criteria in evaluating scenarios (Stewart Scott, 1995), (b) they can screen or assign preferences to scenarios and their impacts (Van Huylenbroeck Coppens, 1995), and (c) under given sufficient technical support, they can work with scenarios interactively through providing the specifica- tions (e.g., for GIS and DSS) (Malafant et al., 1997; Veldkamp Fresco, 1997). 4.2. System composition The second step is to define the critical system components and processes under consideration. They include: (i) identification of components which can be covered in detailed by the research group due to reasons of re- search capacity; (ii) identification of the driving forces of the sys- tem such as the structure of resources, actors, institutions, events and relations, slow changing and predictable trends, and key uncertainties and potential major drivers of change; (iii) identifica- tion of the base year and the temporal resolution and extent for the sustainable development purpose; and (iv) identification of the spatial resolution and extent of scenarios. The Haihe River Basin system can be defined as follows: (1) the system components include economic variability (for a regional planning, microeconomic variability is more important), environ- mental variability (including water availability, water consump- tion, and wastewater treatment), and social variability (i.e. keeping the social stability); (2) driving forces are population and socioeconomic conditions, soil and hydro-geological conditions, water availability, and food security; (3) the spatial extent is the Haihe River Basin; (4) the Haihe River Basin is further divided into five districts: Beijing, Tianjing, Hebei, Lubei, Yubei (i.e. the spatial resolution); (5) eight sectors are agriculture, mining, heavy manu- facturing, light manufacturing, electrical machinery, construction, transportation, and services; (6) temporal extent is up to 2030, and the base year is 2000. Start Purpose of scenario analysis Definition of the system under consideration Generate qualitative scenarios Quantify scenarios by the MEMO model Solve the MEMO model through the SGOC method for each scenario Decision Is the decision maker satisfied? Stop N Scenario evaluation and ranking scenarios through MCDA Fig. 2. Flowchart of SMC-DDS. S.Q. Weng et al. / Expert Systems with Applications 37 (2010) 8242–8254 8247
  • 7. 4.3. Scenario generation In the third step, a number of qualitative scenarios are gener- ated based on an understanding of the system, which are described in a narrative form. In the procedure of generating qualitative sce- narios, the following steps should be considered: (1) The reference scenarios or the baseline scenarios must be decided. The reference scenarios describe plausible future without any specific policy intervention. They serve as the baselines to assess the impact of policy interventions on the future state of the system. (2) Policy scenarios are defined in order to assess the impact of a certain policy intervention in the future. Generally, policy scenarios are constructed based on the uncertainties exist- ing in the system. For example, saving water is an important policy for the arid region, while uncertainties may exist in ‘‘level of saving water”. Then, the scenarios could be built as ‘‘medium level saving water” scenario and/or ‘‘high level saving water” scenario. (3) When examining the existing practical policies, identifica- tion of the relationships among multiple uncertainties in multiple policies is required. Then, the scenario based on the combinations of these uncertainties should be consid- ered (e.g., scenario under medium level of saving water and medium level of supplying water). The scenarios are constructed based on the combination of the level of the three policies, where each scenario is described by a three-digital code: the first digit stands for water saving policy, the second digit denotes the level of protection of water resource environment, and the third digit shows whether or not the South–North water transfer project is put into effect. Table 1 shows the details of the coding rule. For example, the ‘‘000” scenario stands for medium saving water, stopping deterioration gradually, and no water supply from transfer project, which serves as the baseline scenario or reference scenario. Table 2 provides several scenarios based on the purpose described before. 4.4. Scenario quantification In this study, scenario analysis and multiobjective program- ming approaches are integrated into a general framework. The quantification of the scenarios is an important step to fulfill such a combination. Firstly, indicators of the system state need to be de- fined. Indicators are measurable and used to evaluate the outcome of scenario analysis. A suite of indicators must provide enough information to allow decision makers to choose suitable scenario among scenario options. In addition, indicators should be cost- effective to monitor and feasible to forecast confidently. Therefore, definition of indicators is very important in quantitative scenario analysis. In SMC-DSS, a number of environmental, economic and social indicators are considered. These indicators could be simple variables that are computed by one model or a combination of the output of various models. Furthermore, it is desired to define the indicators not only with respect to the included variables but also to their temporal and spatial resolution. Secondly, various driving forces need to be quantified. The driving forces defined here are modeling inputs. In order to make quantitative assump- tions about the future development of certain driving forces, their historical data is firstly analyzed. Then, numerical values of the driving forces that reflect the respective qualitative scenario are defined for future times. Once all inputs necessary for the various models is quantified, the models can be used to compute the sys- tem indicators under the different reference and intervention scenarios. In this study, 10 indicators are selected which cover the three dimensions of sustainability. They are described as follows: GDP per capita (GDP) — Gross Domestic Product, the most important economic indicator. It represents a broad measure of economic activity and signals the direction of overall aggre- gate economic activity. GDP per capita is a more appropriate indicator of the growth in living standards. Unit is Yuan/capita. GDP growth rate (%) (GDPRT) — It measures percent rate of GDP increase year over year. Per capita personal consumption expenditures (PCE) — PCE is a measure of price changes in consumer goods and services. It consists of the actual and imputed expenditures of households, and includes data pertaining to durables, non-durables, and ser- vices. Unit is Yuan/capita. Per capita crop production (CP) — it is an indicator of food secu- rity and social stability. Unit is kg/capita. Per capita industrial GDP (IGDP) — it is an indicator of industrial modernization. Unit is Yuan/capita. Per cubic meter water GDP (WGDP) — it is an indicator of water consumption efficiency. It is the ratio between total GDP and Total water use. Per cubic meter water crop product (WCP) —it is an indicator of regional agriculture water consumption efficiency. It is the ratio between crop output value and Total irrigation water needed for corps. Solid waste discharge (SWD) — it is an empirical value got from industrial output value and statistics book. Unit is 10 thousand ton. Regional total BOD discharge (BOD) —Biological Oxygen Demand is a water-quality indicator. Unit is ton/year. Table 1 Coding rule for scenarios. Policies Level Code Saving water policy Medium 0 High 1 Protection of environment Stop deterioration gradually 0 Stop deterioration immediately 1 South–North water transfer project No 0 East and Middle Route 1 Table 2 The list of scenarios. Scenario code Scenario description ‘‘000” Baseline scenario, medium level saving water, stopping deterioration gradually, and no water transfer project under consideration ‘‘100” High level saving water, stopping deterioration gradually, and no water transfer project under consideration ‘‘010” Medium level saving water, stopping deterioration immediately, and no water transfer project under consideration ‘‘001” Medium level saving water, stopping deterioration gradually, and considering water transfer from two routes (i.e. east and middle routes) ‘‘111” Integrated scenario, high level saving water, stopping deterioration immediately, and considering water transfer from two routes (i.e. east and middle routes) 8248 S.Q. Weng et al. / Expert Systems with Applications 37 (2010) 8242–8254
  • 8. Wastewater discharge (WWD) — it comes from water use mul- tiplied by wastewater discharge rate. According to the scenarios defined in this case, the policy parameters (i.e. policy scenarios) are introduced as follows: (1) Water saving intensity Water saving intensity (WSI) is a policy parameter to indicate the level of water saving policy, which can be defined as: WSI ¼ Water use intensity in each planning year Water use intensity at present The value of WSI is between 0 and 1 (see Table 3). (2) Excessive volumes of underground water extraction The volume of underground water extraction should be smaller than the refill or renewable volume of the aquifers. If underground water is being extracted faster than aquifers can be recharged, it will cause water table dropping at well locations, dry wells, seawater intrusions in groundwater areas adjacent to the ocean, and land subsidence. Therefore, excessive volumes of extraction should be stopped. Accord- ing to the scenario definition, two levels have been defined. One is stop immediately and the other is stop gradually (as shown in Tables 4 and 5). (3) Volume of using untreated wastewater Using untreated wastewater will cause many problems, such as human disease, wetlands, groundwater contamination, and the effects on plant biomass. So in a sustainable way, wastewater should be reused after treated. To stop untreated wastewater using is one of the policies to protect water resource environment. The value of this parameter is also listed in Tables 4 and 5. (4) The binary parameter of Transfer project Whether or not the transfer project will put into effect is identified by a binary parameter. This parameter is pre- sented in Table 6. (5) The amount of water supplied from Transfer project. Table 3 WSI parameter during each planning year. District Base year level High level water saving Medium level water saving Sector 2000 2005 2010 2015 2020 2030 2005 2010 2015 2020 2030 Beijing Agriculture 1.00 0.95 0.92 0.88 0.84 0.8 0.98 0.96 0.94 0.92 0.90 Industry 1.00 0.92 0.8 0.7 0.6 0.5 0.94 0.88 0.80 0.72 0.64 Domestic 1.00 0.94 0.91 0.89 0.87 0.85 0.98 0.96 0.94 0.92 0.90 Tianjing Agriculture 1.00 0.95 0.92 0.88 0.84 0.8 0.98 0.96 0.94 0.92 0.90 Industry 1.00 0.95 0.8 0.7 0.6 0.5 0.94 0.88 0.80 0.72 0.64 Domestic 1.00 0.94 0.91 0.89 0.87 0.85 0.98 0.96 0.94 0.92 0.90 Hebei Agriculture 1.00 0.95 0.92 0.88 0.84 0.8 0.98 0.96 0.94 0.92 0.90 Industry 1.00 0.91 0.8 0.7 0.6 0.5 0.94 0.88 0.80 0.72 0.64 Domestic 1.00 0.94 0.91 0.89 0.87 0.85 0.98 0.96 0.94 0.92 0.90 Yubei Agriculture 1.00 0.95 0.92 0.88 0.84 0.8 0.98 0.96 0.94 0.92 0.90 industry 1.00 0.91 0.75 0.6 0.5 0.4 0.94 0.88 0.80 0.72 0.64 Domestic 1.00 0.94 0.91 0.89 0.87 0.85 0.98 0.96 0.94 0.92 0.90 Lubei Agriculture 1.00 0.95 0.92 0.88 0.84 0.8 0.98 0.96 0.94 0.92 0.90 Industry 1.00 0.91 0.75 0.6 0.5 0.4 0.94 0.88 0.80 0.72 0.64 Domestic 1.00 0.94 0.91 0.89 0.87 0.85 0.98 0.96 0.94 0.92 0.90 Table 4 Gradually stopping environmental deterioration parameter value. District Maximum of excessive volumes of extraction (100 million m3 ) Maximum of using untreated wastewater(100 million m3 ) 2000 2005 2010 2015 2020 2030 2000 2005 2010 2015 2020 2030 Beijing 2.2 1.8 1.5 0 0 0 3.6 2.9 2.5 0 0 0 Tianjing 1.6 1.3 1.2 0 0 0 3.9 3.1 2.6 0 0 0 Hebei 42.8 34.3 10.1 0 0 0 7.9 6.3 3.7 0 0 0 Yubei 6.9 5.5 5.0 0 0 0 1.4 1.1 0.9 0 0 0 Lubei 1.7 1.4 1.3 0 0 0 6.3 5.0 3 0 0 0 Total 55.2 44.3 19.1 0 0 0 23.1 18.4 12.7 0 0 0 Table 5 Immediately stopping environmental deterioration parameter value. District Maximum of excessive volumes of extraction (100 million m3 ) Maximum of using untreated wastewater(100 million m3 ) 2000 2005 2010 2015 2020 2030 2000 2005 2010 2015 2020 2030 Beijing 2.2 0 0 0 0 0 3.6 0 0 0 0 0 Tianjing 1.6 0 0 0 0 0 3.9 0 0 0 0 0 Hebei 42.8 0 0 0 0 0 7.9 0 0 0 0 0 Yubei 6.9 0 0 0 0 0 1.4 0 0 0 0 0 Lubei 1.7 0 0 0 0 0 6.3 0 0 0 0 0 Total 55.2 0 0 0 0 0 23.1 0 0 0 0 0 S.Q. Weng et al. / Expert Systems with Applications 37 (2010) 8242–8254 8249
  • 9. According to the analysis of South–North transfer project, the amount of water supplied from project is shown in Table 7. 4.5. Mutiobjective optimization Decision makers are often hard to make decisions by lost their orientations among so many solutions from which they have to choose. They need a powerful tool to help them make a fast in these problems. In SCM-DSS, Stochastic generating-oriented choosing (SGOC) method is developed for quickly identifying a de- sired decision. The approach first generates a large number of objective weight vectors from uniform distribution stochastically, and then the model is solved for each of these weight sets individ- ually, thus a lot of Pareto-optimal solutions are generated. This process serves as stochastic generating part. Moreover, a fuzzy MCDA evaluation model, which is based on fuzzy theory and MCDA technique, is developed to choose the most preferred solu- tion at each iteration and shows the direction for next iteration searching. That is oriented choosing part. SGOC could help decision makers make fast decision by presenting only one solution to them, and could be extended to an interactive approach by pre- senting multiple solutions and let decision makers choose a direc- tion by themselves. In SMC-DSS, SGOC is used to solve the ME-MO model to get the system indicators under the different scenarios. The final solution of SGOC algorithm in each scenario will be saved for the purpose of further evaluation. Fig. 3 presents the user interfaces of the developed decision support system, named as HWRDS (an integrated scenario-based multi-criteria decision support system (SMC-DSS) for water re- sources planning in the Haihe River Basin), which is used for help- ing decision makers easily find their satisfied solutions. 4.6. Scenario evaluation This step is to evaluate the scenarios to identify an optimal pol- icy. An optimal policy for the regional planning is chosen according to the three criteria: efficiency, equity and ecological sustainability (Van Pelt, 1993). To fulfill these criteria, MCDA is an effective choice method for the evaluation of intervention scenarios. MCDA is a ‘‘divide and conquer” strategy in the sense, such that a complex issue can be subdivided into several parts that are easier to deal with separately. The key feature of MCDA is a performance matrix, or consequence table, in which each row describes an indicator, and each column describes the performance of the options against each indicator. A number of approaches are available to help han- dle the multi-criteria decision making problems, such as analytical hierarchy process (AHP), multi-objective programming (MOP), and fuzzy MCDM techniques. For example, AHP uses procedures for deriving the weights and the scores achieved by alternatives which are based on pairwise comparisons between indicators and be- tween options. Fuzzy MCDA is another type to address the impre- cision that surrounds much of the data on which decision making is based. The strength of the fuzzy approach is that it provides an explicit way of representing vagueness in the decision maker’s mind. Fuzzy sets firstly attempt to capture the idea that our natural language in discussing issues is not precise, and then tries to cap- ture these qualified assessments using the idea of a membership function, through which an option would belong to the set of be- tween 0 and 1. In the SMC-DSS, a fuzzy MCDA evaluation model has been developed for SGOC in order to choose the most preference solu- tion for each scenario. In fuzzy MCDA evaluation model, the perfor- mance matrix is constructed by the membership function of a fuzzy set (i.e. the most preference set). Then, the ‘ideal-point’ method which directly performs over the performance matrix by measuring options’ distances from ideal and negative ideal points is applied to extract ordinal preference information. The fuzzy membership function could be available by pressing the ‘‘EVALUA- TION” button in Fig. 3. The results of all calculated scenarios have been saved in the computer and could be found (Fig. 4). Scenarios could be compared by marking them and pressing OK. Then, the ranking information is shown in Fig. 5. 4.7. Interactive decision process Effective decision making requires a continuous reassessment of choices made in the past, the decision makers may learn from the results of scenarios and find their own problems. Interactive process in a decision system offers decision makers a chance to redo the choices when they find that they are still difficult to make decision based on the results or they realize their problems in the Table 6 Binary parameter of South-North transfer project. Name of project 2000 2005 2010 2015 2020 2025 2030 No transfer project East route 0 0 0 0 0 0 0 Middle route 0 0 0 0 0 0 0 East and middle route East route 0 0 1 1 1 1 1 Middle route 0 0 1 1 1 1 1 Table 7 The amount of water supplied from transfer project. Name of project Beijing Tianjing Hebei Yubei Lubei Amount of water supplied (100 million m3 ) East route 0 0 22 0 10 Middle route 12.20 12.39 40.65 6 0 Fig. 3. Interface of HWRDS. 8250 S.Q. Weng et al. / Expert Systems with Applications 37 (2010) 8242–8254
  • 10. last iteration. In SMC-DSS, the last step is to give the decision mak- ers a chance to express their feedback. If they are satisfied with the results, the whole decision procedure will terminate. However, if they think that the results are insufficient to make decision, the process will go back to the section of scenario construction to rear- range the scenarios. In this case, it is assumed that only single deci- sion maker makes decision. 5. Result analysis and discussion In this study, a number of scenarios based on different water re- sources management policies were considered. The results indicate that different water management policies could generate varied re- sults of economic development. Table 8 provides the results under the baseline scenario (i.e. ‘‘000” scenario), which includes a future development in the line of the current situation in the Haihe River Basin. Currently, although the saving water policy and water pro- tection rules were implemented in this region, the intensity of these policies would still need to be improved. In addition, the east route of South–North water transfer project (under construction) would be put into effect in 2008. Therefore, the baseline scenario corresponds to medium level saving water, gradually stopping environmental deterioration, and no supplying from transfer pro- ject. Table 9 shows the results under saving water scenario (i.e. ‘‘100” scenario); in this scenario, only the WSI has been changed, compared with the condition under the baseline scenario. The re- sults for environment protection scenario (i.e. ‘‘010” scenario) are listed in Table 10, in which ground water overdraft and untreated wastewater discharged were stopped after 2005. Table 11 presents the results for water supply scenario (i.e. ‘‘001” scenario shows the effect of South–North Water transfer project). The results indicate that, after 2010, the water transfer project would be put into effect and could mitigate water shortage for this basin. Table 12 provides the result under integration scenario (i.e. ‘‘111” scenario which in- cludes three water policies implementation). Fig. 6 shows the GDP growth curve obtained from the five sce- narios. The economic development under the baseline scenario would not be sustainable due to water shortage problem. Com- pared with ‘‘111” scenario, its GDP would be decreased 16.8% by 2030; although the annual GDP growth rate would be about 7% Fig. 4. Interface of scenario evaluation. Fig. 5. Interface of evaluation result. Table 8 Result for ‘‘000” scenario. Year Population (million) GDP (billion Yuan) GDP growth rate (%) GDP per capita (Yuan/capita) 2000 115.902 910.8415 0 9571.073 2005 123.1249 1322.736 7.48 13348.27 2010 129.953 1866.652 6.82 18127.44 2015 136.2625 2304.727 3.98 21488.02 2020 141.9336 2949.963 5.26 27023.76 2025 144.3725 3763.867 4.84 34335.19 2030 146.2336 4697.961 4.66 41880.03 Table 9 Result for ‘‘100” scenario. Year Population (million) GDP (billion Yuan) GDP growth rate (%) GDP per capita (Yuan/capita) 2000 115.902 910.8415 0 9571.073 2005 123.1249 1334.683 7.74 13488.02 2010 129.953 1911.69 7.16 18607.2 2015 136.2625 2408.065 4.56 22575.7 2020 141.9336 3103.459 5.04 28789.65 2025 144.3725 3969.31 5.02 36539.47 2030 146.2336 4964.494 4.7 44674.71 Table 10 Result for ‘‘010” scenario. Year Population (million) GDP (billion Yuan) GDP growth rate (%) GDP per capita (Yuan/capita) 2000 115.902 910.8415 0 9571.073 2005 123.1249 1310.031 7.06 13154.6 2010 129.953 1642.088 4.46 15602.37 2015 136.2625 2306.943 6.96 21427.65 2020 141.9336 2960.873 5.06 27163.82 2025 144.3725 3760.312 4.76 34222.37 2030 146.2336 4700.054 4.68 41838.3 Table 11 Result for ‘‘001” scenario. Year Population (million) GDP (billion Yuan) GDP growth rate (%) GDP per capita (Yuan/capita) 2000 115.902 910.8415 0 9571.073 2005 123.1249 1342.975 7.94 13582.2 2010 129.953 1995.96 7.96 19555.55 2015 136.2625 2754.999 6.18 26281.76 2020 141.9336 3549.496 5.1 33802.97 2025 144.3725 4451.91 4.56 41585.89 2030 146.2336 5486.248 4.44 50328.65 S.Q. Weng et al. / Expert Systems with Applications 37 (2010) 8242–8254 8251
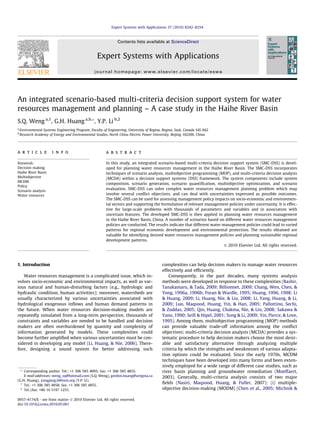
  • 11. by 2010, this high economic growth rate is based on the situation of water resource system degradation and not a sustainable devel- opment way. Therefore, water management policies are desired and the implement force should be enhanced. The best performance scenario would be ‘‘111” scenario which improves the water saving intensity and obtains water from trans- fer project after 2010. Under this scenario, the annual GDP growth rate remains high level in a long term. In addition, underground water use was limited and untreated wastewater use was also stopped. Thus, the quality of river would keep in a good condition. Therefore, this scenario could be recommended as a sustainable development manner in study basin. In addition, when three poli- cies work individually, water supply scenario (i.e. ‘‘001” scenario) is better than other two scenarios. The results indicate that this scenario would rank in the first place. This is because water trans- fer project plans to draw water from the main stem of Yangtze River, China, which has plenty of water resources. This water diver- sion project could effectively eradicate the water shortage in the Haihe River Basin. In addition, it also plays an important role in the alleviation of water restoration and environment protection. Although saving water policy is a main water policy for this basin, it could merely mitigate water-supply pressure temporarily. Environment protection scenario (i.e. ‘‘010” scenario) ranks the last and it even drop behind the baseline scenario at beginning. This is because underground water and untreated wastewater are important for agriculture irrigation in this region. When water from the two sources is limited, the effects on agriculture product and economical development are significant. However, water re- source protection is a fundamental policy to support the sustain- able development and should be carried out confirmedly in the basin. If ecological protection is ignored, the economical growth would be limited in the coming decades. In many regions of the world, water scarcity is viewed as a major threat to long-term food security. If no enough food is supplied in a region, it might cause social turbulence, especially in a region like the Haihe River Basin that has significance for economy of the whole nation. This is why maximum crop production is selected as the social objective of ME-MO model. The results of total crop yield for different scenarios are listed in Table 13 and the crop yield growth rates are presented in Fig. 7. All of the scenarios are ranked by HWRDS, based on the results of performance indicators. The resulting rank is listed in Table 14. The rank result shows that ‘‘111” scenario, which integrates the three water management measures, is the desired policy. This im- plies that an integrated water management policy has more posi- tive effect on regional development. This is because (a) the Haihe River Basin is one of the most water-deficient economical regions in China, where water scarcity is a major threat to its long-term economic development; (b) a desired water management policy can facilitate to relieve such a threat and keep regional sustainable development. Fig. 8 presents the result for scenario evaluation. Water supply scenario (i.e. ‘‘001” scenario) ranks the highest among the three policy scenarios. This means that water transfer project is an effective approach to solve the water resources scar- city problem in the basin. This also implies that saving water policy is not enough to solve the water scarcity problem individually, and thus water resources from other sources are needed. In addition, after water transfer project goes into effect, the use of underground water and untreated wastewater could be controlled more effec- tively. Therefore, the South–North water transfer project should be started as early as possible. Although saving water policy ranks lower than water transfer scenario, it is also an important measure for water shortage problem, especially in the arid region. Although Table 12 Result for ‘‘111” scenario. Year Population (million) GDP (billion Yuan) GDP growth rate (%) GDP per capita (Yuan/capita) 2000 115.902 910.8415 0 9571.073 2005 123.1249 1346.089 8.08 13627.97 2010 129.953 2007.835 8.2 19715.35 2015 136.2625 2869.762 7.06 27458.43 2020 141.9336 3712.739 5.08 34831.99 2025 144.3725 4668.158 4.36 42430.71 2030 146.2336 5781.139 4.52 51562.29 0 1000 2000 3000 4000 5000 6000 2000 2005 2010 2015 2020 2025 2030 2035 Year GDP (billion Yuan) S-111 S-001 S-100 S-010 S-000 Fig. 6. GDP growth rate under different scenarios. Table 13 Total crop product (million ton). Year ‘‘000” scenario ‘‘100” scenario ‘‘010” scenario ‘‘001” scenario ‘‘111” scenario 2000 9.880462 9.880462 9.880462 9.880462 9.880462 2005 10.57196 11.17643 10.80803 13.45286 12.70046 2010 11.20206 11.8992 11.16188 14.8146 14.13692 2015 11.53812 12.25617 12.18046 15.54437 15.35344 2020 12.04782 13.02769 13.01568 16.97262 16.60823 2025 12.8049 14.16231 14.10623 18.32839 18.12234 2030 13.42796 14.79236 14.88933 19.4513 18.96022 0 5 10 15 20 25 2000 2005 2010 2015 2020 2025 2030 Year Total Crop Product (10 6 ton) S-000 S-100 S-010 S-001 S-111 Fig. 7. Crop yield growth rate under different scenarios. Table 14 Result for scenario rank. Scenario Social environment index Environment resource index Distance to ideal point ‘‘111” scenario 0.495 0.728 0.3896 ‘‘001” scenario 0.66 0.564 0.3898 ‘‘100” scenario 0.518 0.683 0.3914 ‘‘000” scenario 0.669 0.565 0.3967 ‘‘010” scenario 0.568 0.583 0.4231 8252 S.Q. Weng et al. / Expert Systems with Applications 37 (2010) 8242–8254
  • 12. ‘‘010” scenario ranks the last and even fall behind baseline sce- nario; it would affect regional development when the water pro- tection policy was used individually. Generally, from the above analyses, several recommendations could be obtained. They are: (1) water management policies are crucial to solve water-shortage issue and to support regional sustainable development; (2) water transfer project from South to North is essential and should be undertaken as soon as possible; (3) saving water policy should be enforced from a long-term perspective; (4) environmental pro- tection is important for regional sustainable development, but it should be implemented with the other water management policies. 6. Conclusions In this study, an integrated scenario-based multi-criteria deci- sion support system (SMC-DSS) has been developed for planning water resources management in the Haihe River Basin. The system components include system composition, scenario generation, sce- nario quantification, multiobjective optimization, and scenario evaluation. The developed SMC-DSS incorporates techniques of scenario analysis, multiobjective programming (MOP), and multi- criteria decision analysis (MCDA) within a decision support systems (DSS) framework. SMC-DSS can solve complex water resources management planning problem which may involve multiple conflict objectives and need to concern uncertainty in a long-term period. In SMC-DSS, scenario analysis is used to deal with the uncertainty, MOP is used to handle multiple conflict objectives, and MCDA is used to accomplish the scenario evalua- tion. The SMC-DSS has two special characteristics that make it unique compared with the other DSS techniques that deal with decision making problems. Firstly, it can facilitate making decisions with the support of computer technology because it can generate optimal solution based on a great deal of calculations done by computer. Secondly, it is effective for large-scale compli- cated problems with thousands of parameters and variables under uncertainty. The developed SMC-DSS has been applied to planning water re- sources management in the Haihe River Basin, China. A number of scenarios based on different water resources management policies have been conducted. The results indicate that different water management policies can lead to varied results for regional economic development. The results obtained are valuable for supporting (i) water management policies are crucial to solve water-shortage issue and to support regional sustainable develop- ment; (ii) water transfer project from South to North is essential and should be undertaken as soon as possible; (iii) saving water policy should be enforced from a long-term perspective; (iv) envi- ronment protection is very important for regional sustainable development, but it should be combined with the other water management policies. Although this study is the first attempt for planning water re- sources management through development such an integrated decision support system, the results suggest that the developed SMC-DSS could also be applied to other watersheds to facilitate assessment of management policy impacts on socio-economic and environmental sectors, as well as formulation of relevant man- agement policies under uncertainty. Acknowledgements This research was supported by the Major State Basic Research Development Program of MOST (2005CB724200, 2006CB403307, and 2007CB714105), the Canadian Water Network under the Net- works of Centers of Excellence (NCE), and the Natural Sciences and Engineering Research Council of Canada. References Bashir, M. A., Tanakamaru, H., Tada, A. (2009). Spatial and temporal analysis of evapotranspiration using satellite remote sensing data: A case study in the Gezira Scheme, Sudan. Journal of Environmental Informatics, 13(2), 86–92. Billionnet, A. (2009). Estimation of spatial influence models using mixed-integer programming. Journal of Environmental Informatics, 14(1), 31–40. Chang, N. B., Wen, C. G., Chen, Y. L., Yong, Y. C. (1996a). A grey fuzzy multiobjective programming approach for the optimal planning of a reservoir watershed. Part A: Theoretical development. Water Research, 30, 2329–2334. Chang, N. B., Wen, C. G., Chen, Y. L., Yong, Y. C. (1996b). A grey fuzzy multiobjective programming approach for the optimal planning of a reservoir watershed. Part B: Application. Water Research, 30, 2335–2340. Chao, L. (1998). The Haihe River Water Conservancy Commission Report. Chen, B., Guo, H. C., Huang, G. H., Zhang, N., Wu, S. M., Zhang, Z. X. (2005). ASRWM: An arid/semiarid region water management model. Engineering Optimization, 37(6), 609–631. Döll, P., Hauschild, M., Fuhr, D. (2000). Scenario development as a tool for integrated analysis and regional planning. In German–Brazilian workshop on neotropical ecosystems – Achievements and prospects of cooperative research Hamburg, September 3–8, 2000. Session 7: Tools for integration of ecosystem studies towards the development of management strategies. Foran, B., Wardle, K. (1995). Transitions in land use and the problems of planning: A case study from the mountain lands of New Zealand. Journal of Environmental Management, 43, 97–127. Glockner, G. D. (1996). Effects of air traffic congestion delays under several flow management policies. Transportation Research Record, 1517, 29–36. Fig. 8. Scenario evaluation chart. S.Q. Weng et al. / Expert Systems with Applications 37 (2010) 8242–8254 8253
  • 13. Hoyland, K., Wallace, S. W. (2001). Generating scenario trees for multistage decision problems. Management Science, 47(2), 295–307. Huang, G. H. (1996). IPWM: An interval parameter water quality management model. Engineering Optimization, 26, 79–103. Huang, G. H. (1998). A hybrid inexact-stochastic water management model. European Journal of Operational Research, 107, 137–158. Hydrosult, 1999. Strategic options for the water sector, T.A. 2817-PRC, Final Report prepared by Hydrosult Inc. Kahane, A. (1992). Scenarios for energy: Sustainable world vs global mercatilism. Long Range Planning, 25(4), 38–46. Leontief, Wassily (1986). Input–output economics. New York: Oxford University Press. Li, Y. P., Huang, G. H. (2009). Fuzzy-stochastic-based violation analysis method for planning water resources management systems with uncertain information. Information Sciences, 179, 4261–4276. Li, Y. P., Huang, G. H., Nie, S. L. (2006). An interval-parameter multi-stage stochastic programming model for water resources management under uncertainty. Advances in Water Resources, 29, 776–789. Li, Y. P., Huang, G. H., Nie, S. L., Liu, L. (2008). Inexact multistage stochastic integer programming for water resources management under uncertainty. Journal of Environmental Management, 88, 93–107. Li, C. H., Yang, Z. F., Huang, G. H., Li, Y. P. (2009). Identification of relationship between sunspots and natural runoff in the Yellow River based on discrete wavelet analysis. Expert Systems with Applications, 36, 3309–3318. Luo, B., Maqsood, I., Huang, G. H., Yin, Y. Y., Han, D. J. (2005). An inexact fuzzy two- stage stochastic model for quantifying the efficiency of nonpoint source effluent trading under uncertainty. Science of the Total Environment, 347, 21–34. Malafant, K. W. J., Fordham, D. P. (1997). GIS, DSS and integrated scenario modeling frameworks for exploring alternative futures. In: J. L. Uso, C. A. Brebbia, H. Power (Eds.), Proceedings of the conference on advance in ecological sciences: Ecosystems and sustainable development, Peniscola, Spain, 14–16 October 1997 (Vol. 1, pp. 669–678). Michnik, J., Trzaskalik, T. (2002). Multiple objective and goal programming: Recent development (advances in soft computing). Berlin: Springer. Moeffaert, D. V. (2003). Multicriteria decision aid in sustainable urban water management, MSc thesis, Industrial Ecology, Royal Institute of Technology. Mohren, G. M. J. (2003). Large-scale scenario analysis in forest ecology and forest management. Forest Policy and Economics, 5, 103–110. Mulvey, J. M., Vladimirou, H. (1989). Stochastic network optimisation models for investment planning. Annals of Operation Research, 20, 187–217. Nasiri, F., Maqsood, I., Huang, G., Fuller, N. (2007). Water quality index: A fuzzy river-pollution decision support expert system. ASCE – Journal of Water Resources Planning and Management, 133(2), 95–105. Onnis, L., Sechi, G. M., Zuddas, P. (1999). Optimisation processes under uncertainty, A.I.C.E., Milano, pp. 238–244. Pallottino, S., Sechi, G. M., Zuddas, P. (2005). A DSS for water resources management under uncertainty by scenario analysis. Environmental Modelling and Software, 20, 1031–1042. Qin, X. S., Huang, G. H., Chakma, A., Nie, X. H., Lin, Q. G. (2008). A MCDM-based expert system for climate-change impact assessment and adaptation planning – A case study for the Georgia Basin, Canada. Expert Systems with Applications, 34, 2164–2179. Sakawa, M., Yano, H. (1990). An interactive fuzzy satisfying method for generalized multiobjective linear programming problems with fuzzy parameters. Fuzzy Sets Systems, 35, 125–142. Seifi, A., Hipel, K. W. (2001). Interior-point method for reservoir operation with stochastic inflows. ASCE – Journal of Water Resources Planning and Management, 127(1), 48–57. Song, X. Y., Li, J. B. (2009). Land cover change detection using MSS and MODIS data: A case study for Liangshan-Xiangling Region in southwestern China. Journal of Environmental Informatics, 13(2), 119–126. Stewart, J. T., Scott, L. (1995). A scenario-based framework for multicriteria decision analysis in water resources planning. Water Recourses Research, 31(11), 2835–2843. Van Huylenbroeck, G., Coppens, A. (1995). Multicriteria analysis of the conflicts between rural development scenarios in the Gordon district, Scotland. Journal of Environmental Planning and Management, 38(3), 393–407. Van Pelt, M. J. F. (1993). Ecologically sustainable development and project appraisal in developing countries. Ecological Economics, 7, 19–42. Veldkamp, A., Fresco, L. O. (1997). Exploring land use scenarios: An alternative approach based on actual land use. Agricultural System, 55(1), 1–17. Wolf, J., Diepen, C. A. (1995). Effects of climate change on grain maize yield potential in the European community. Climate Change, 29(3), 299–331. Wollenberg, E., Edmunds, D., Buck, L. (2000). Using scenarios to make decisions about the future: Anticipatory learning for the adaptive co-management of community forests. Landscape and Urban Planning, 47, 65–77. Yin, Y., Pierce, J. T., Love, E. (1995). Designing a multisector model for land conversion study. Journal of Environmental Management, 44, 249–266. Yoon, K. P., Hwang, C. L. (1995). Multiple attribute decision making: An introduction (quantitative applications in the social sciences). Thousand Oaks, CA: SAGE. 8254 S.Q. Weng et al. / Expert Systems with Applications 37 (2010) 8242–8254