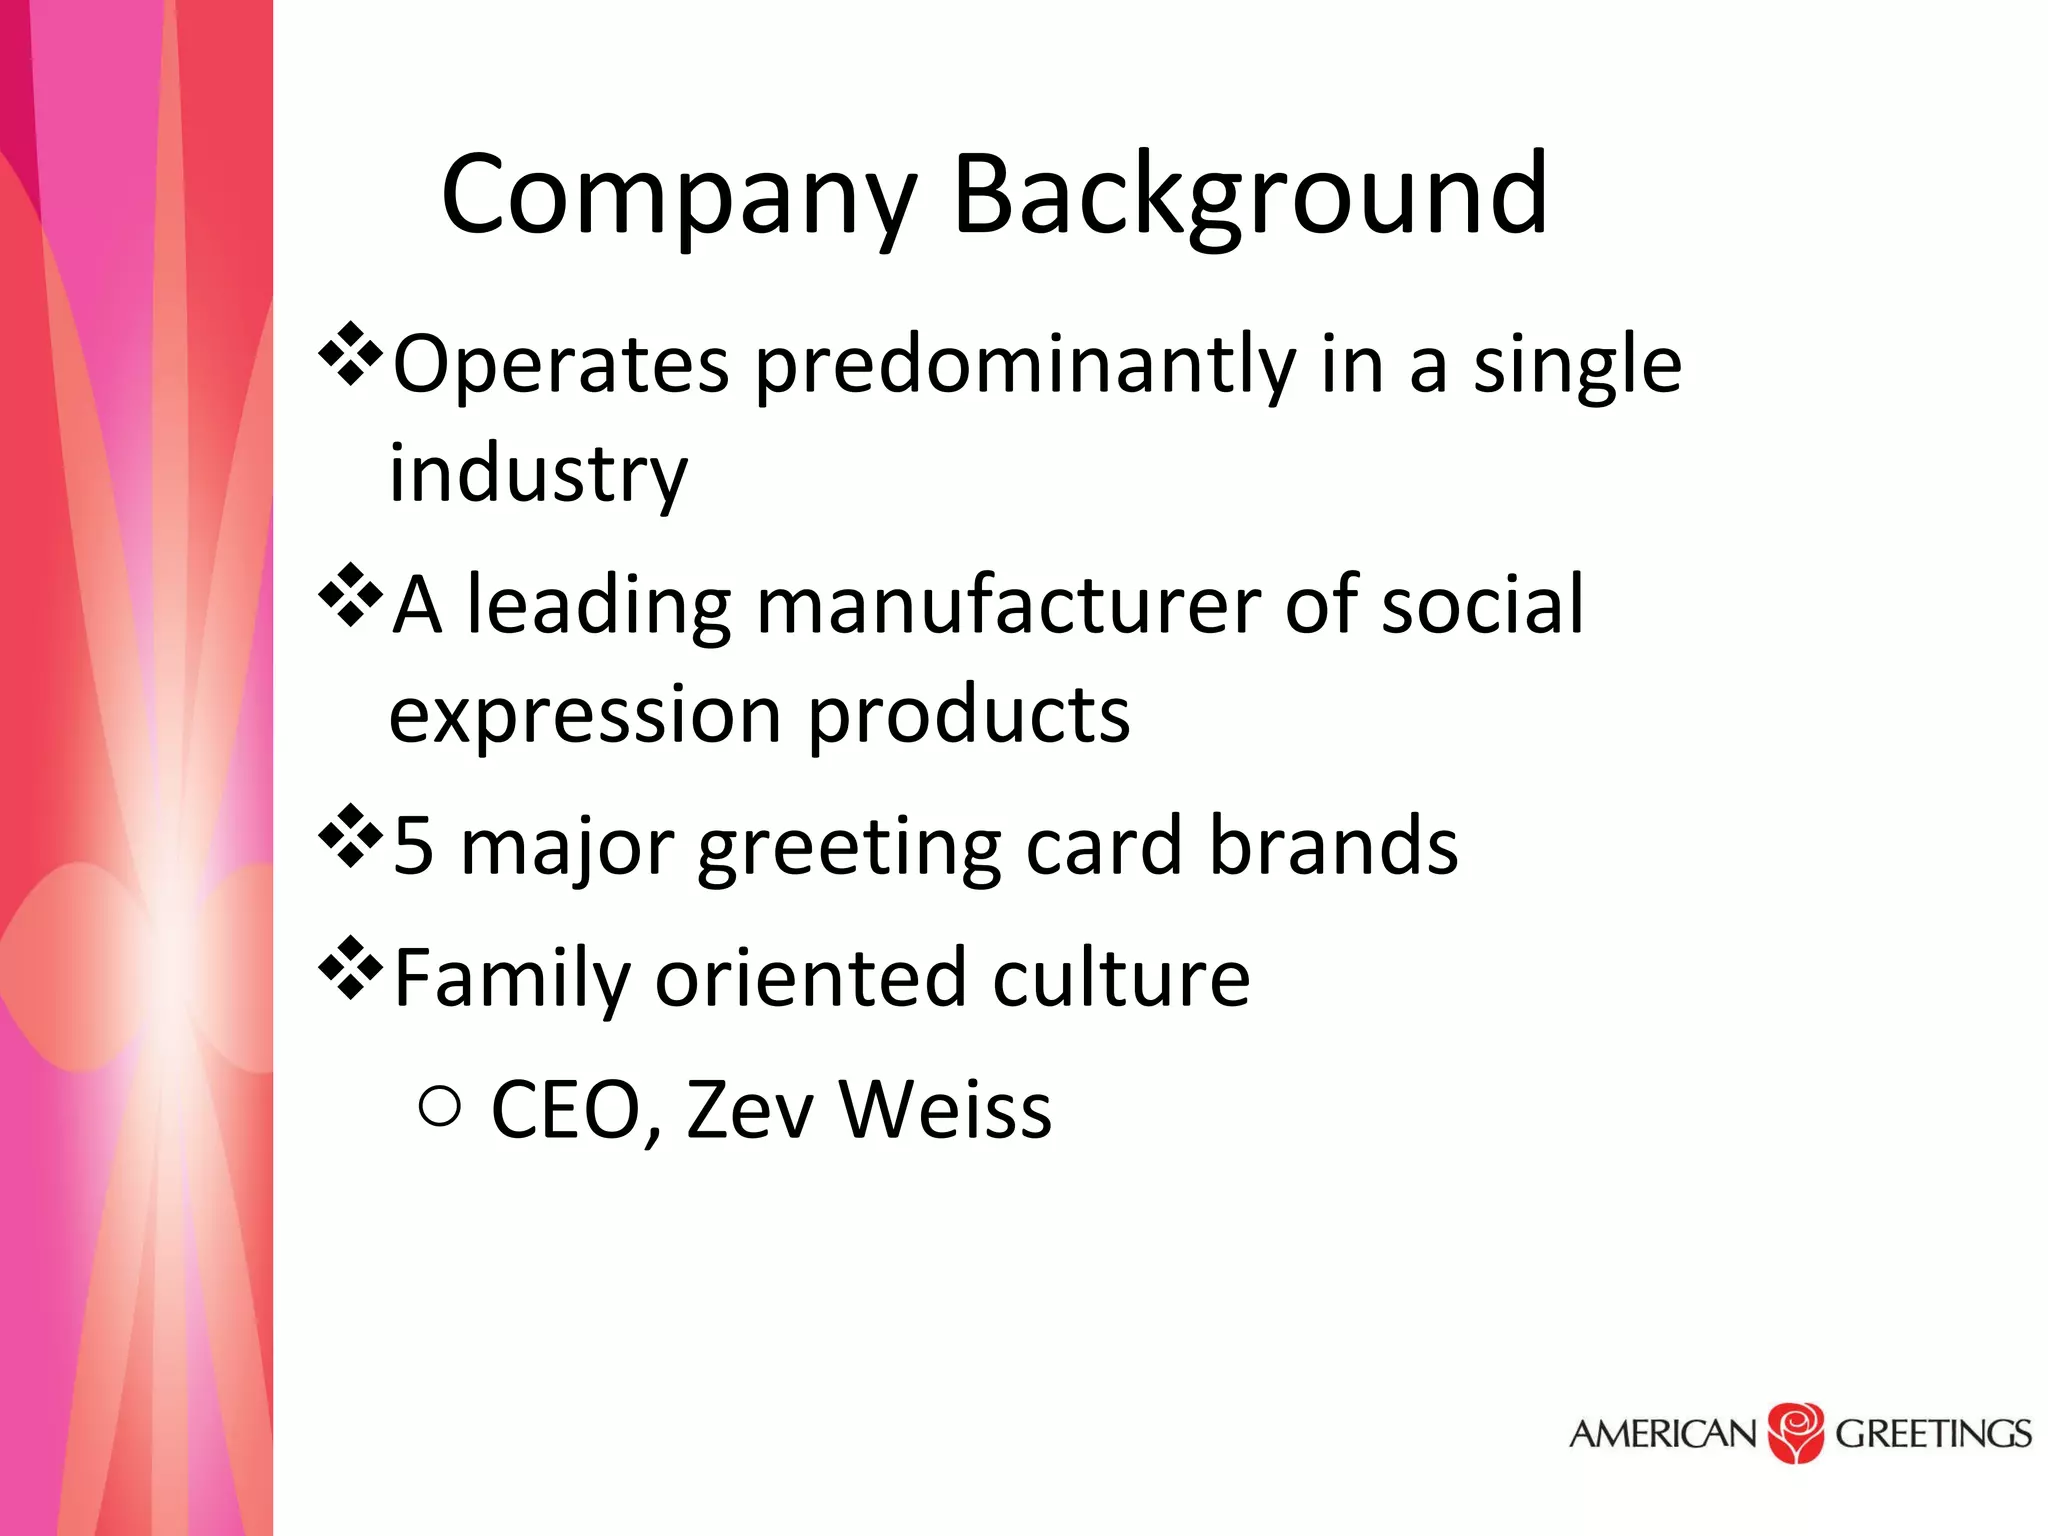
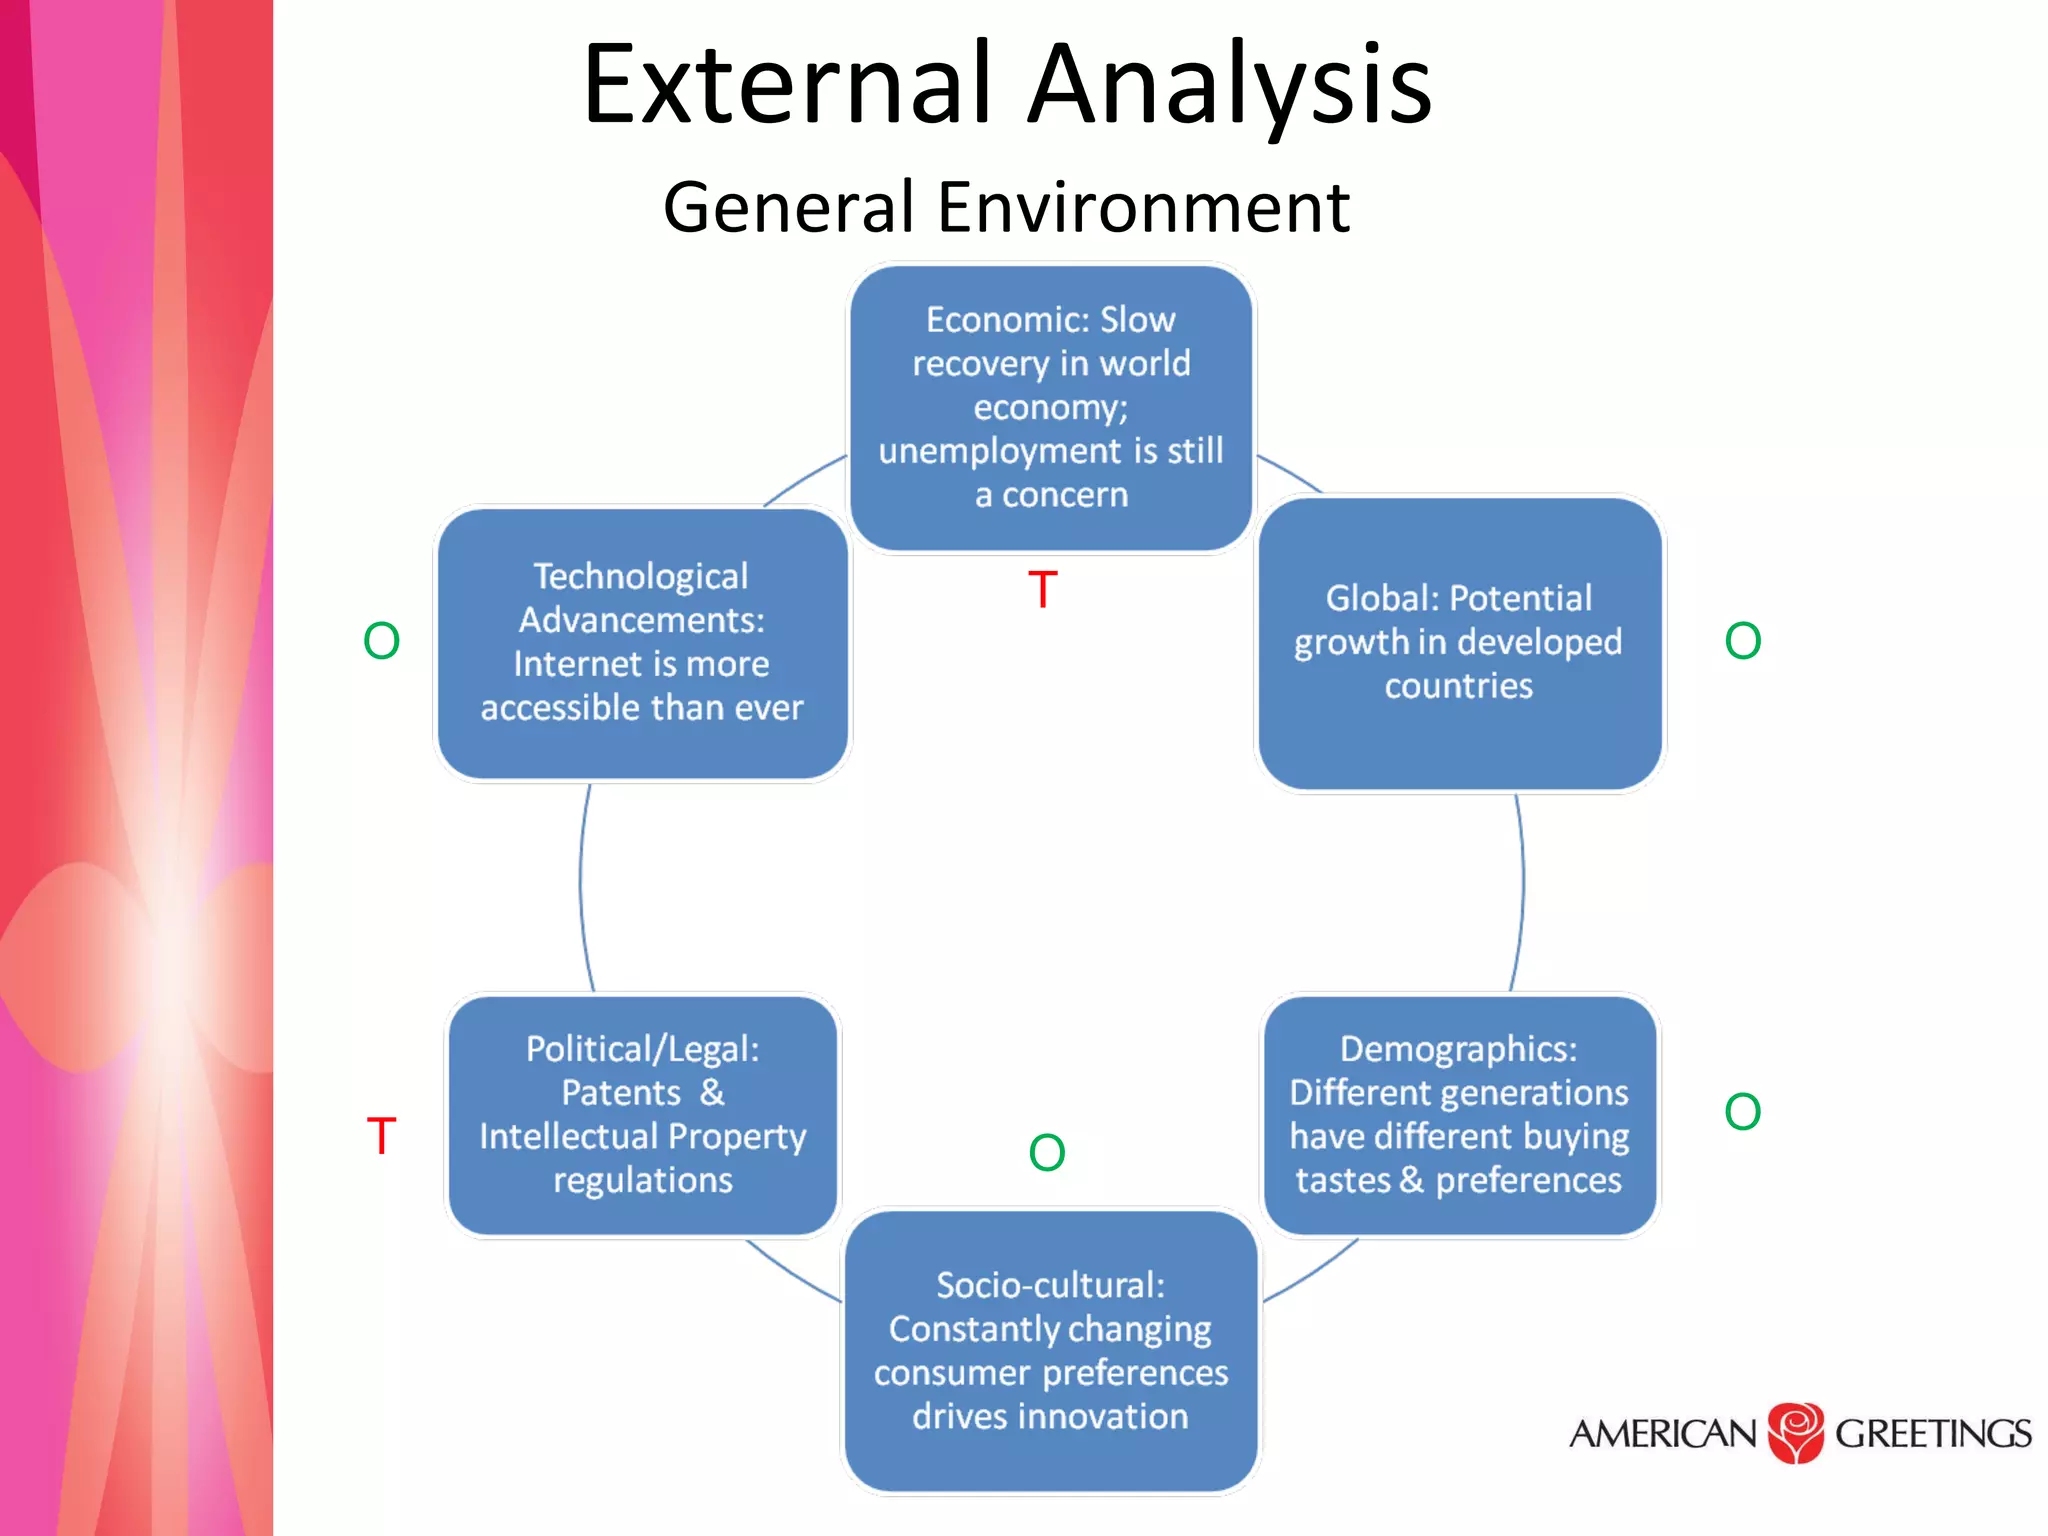
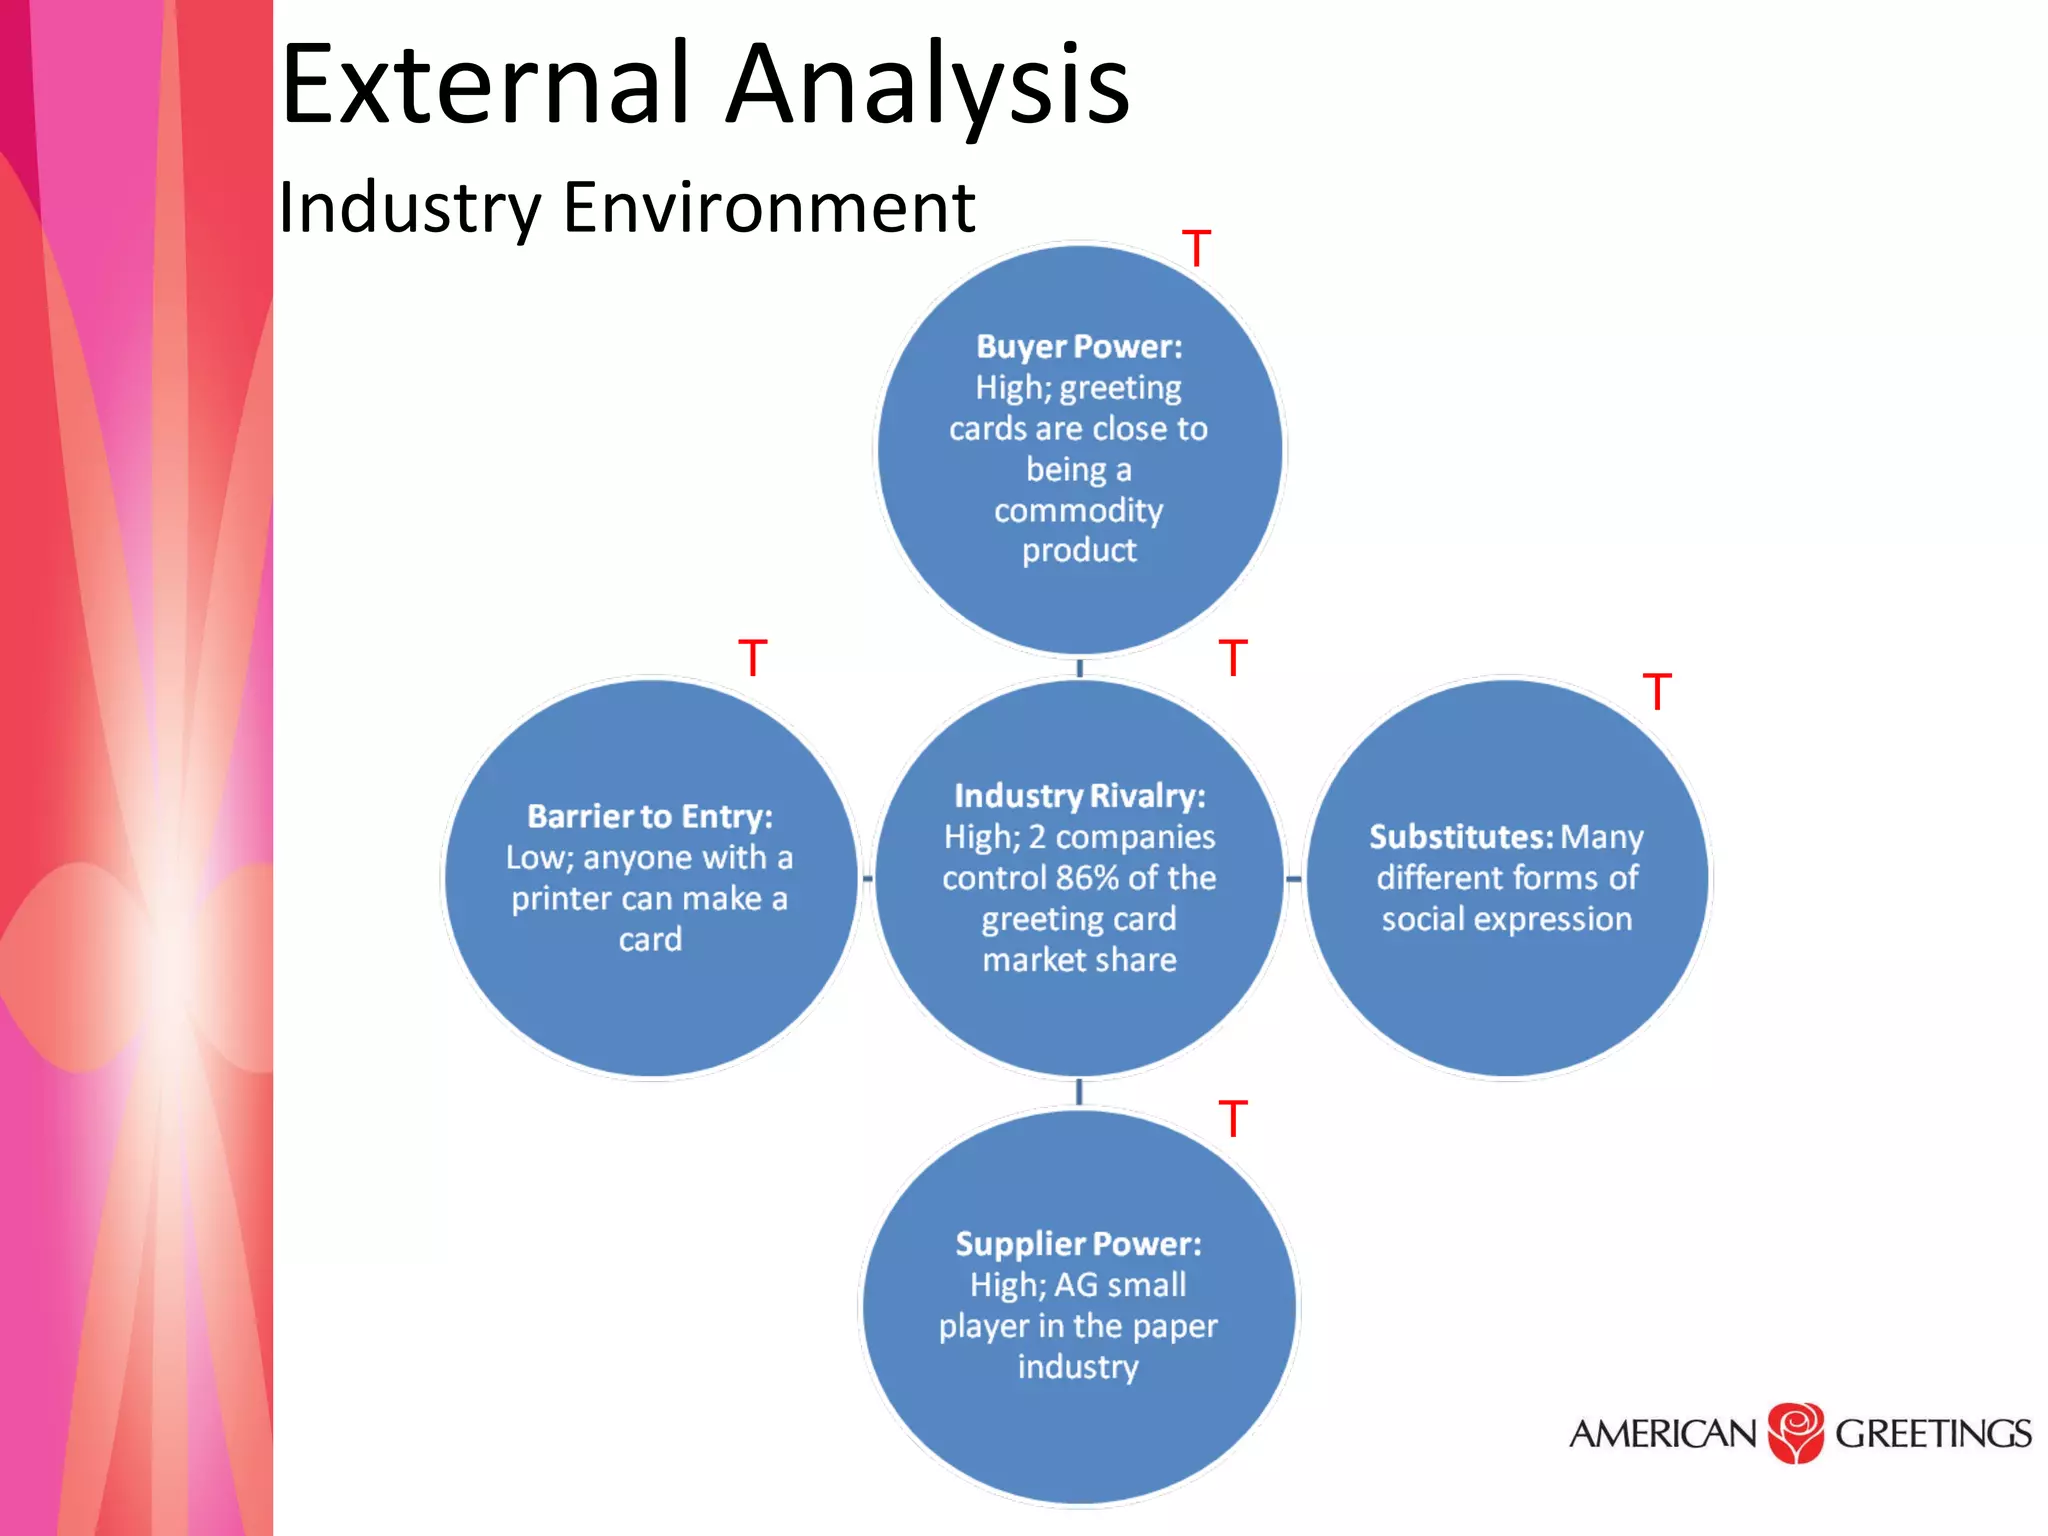
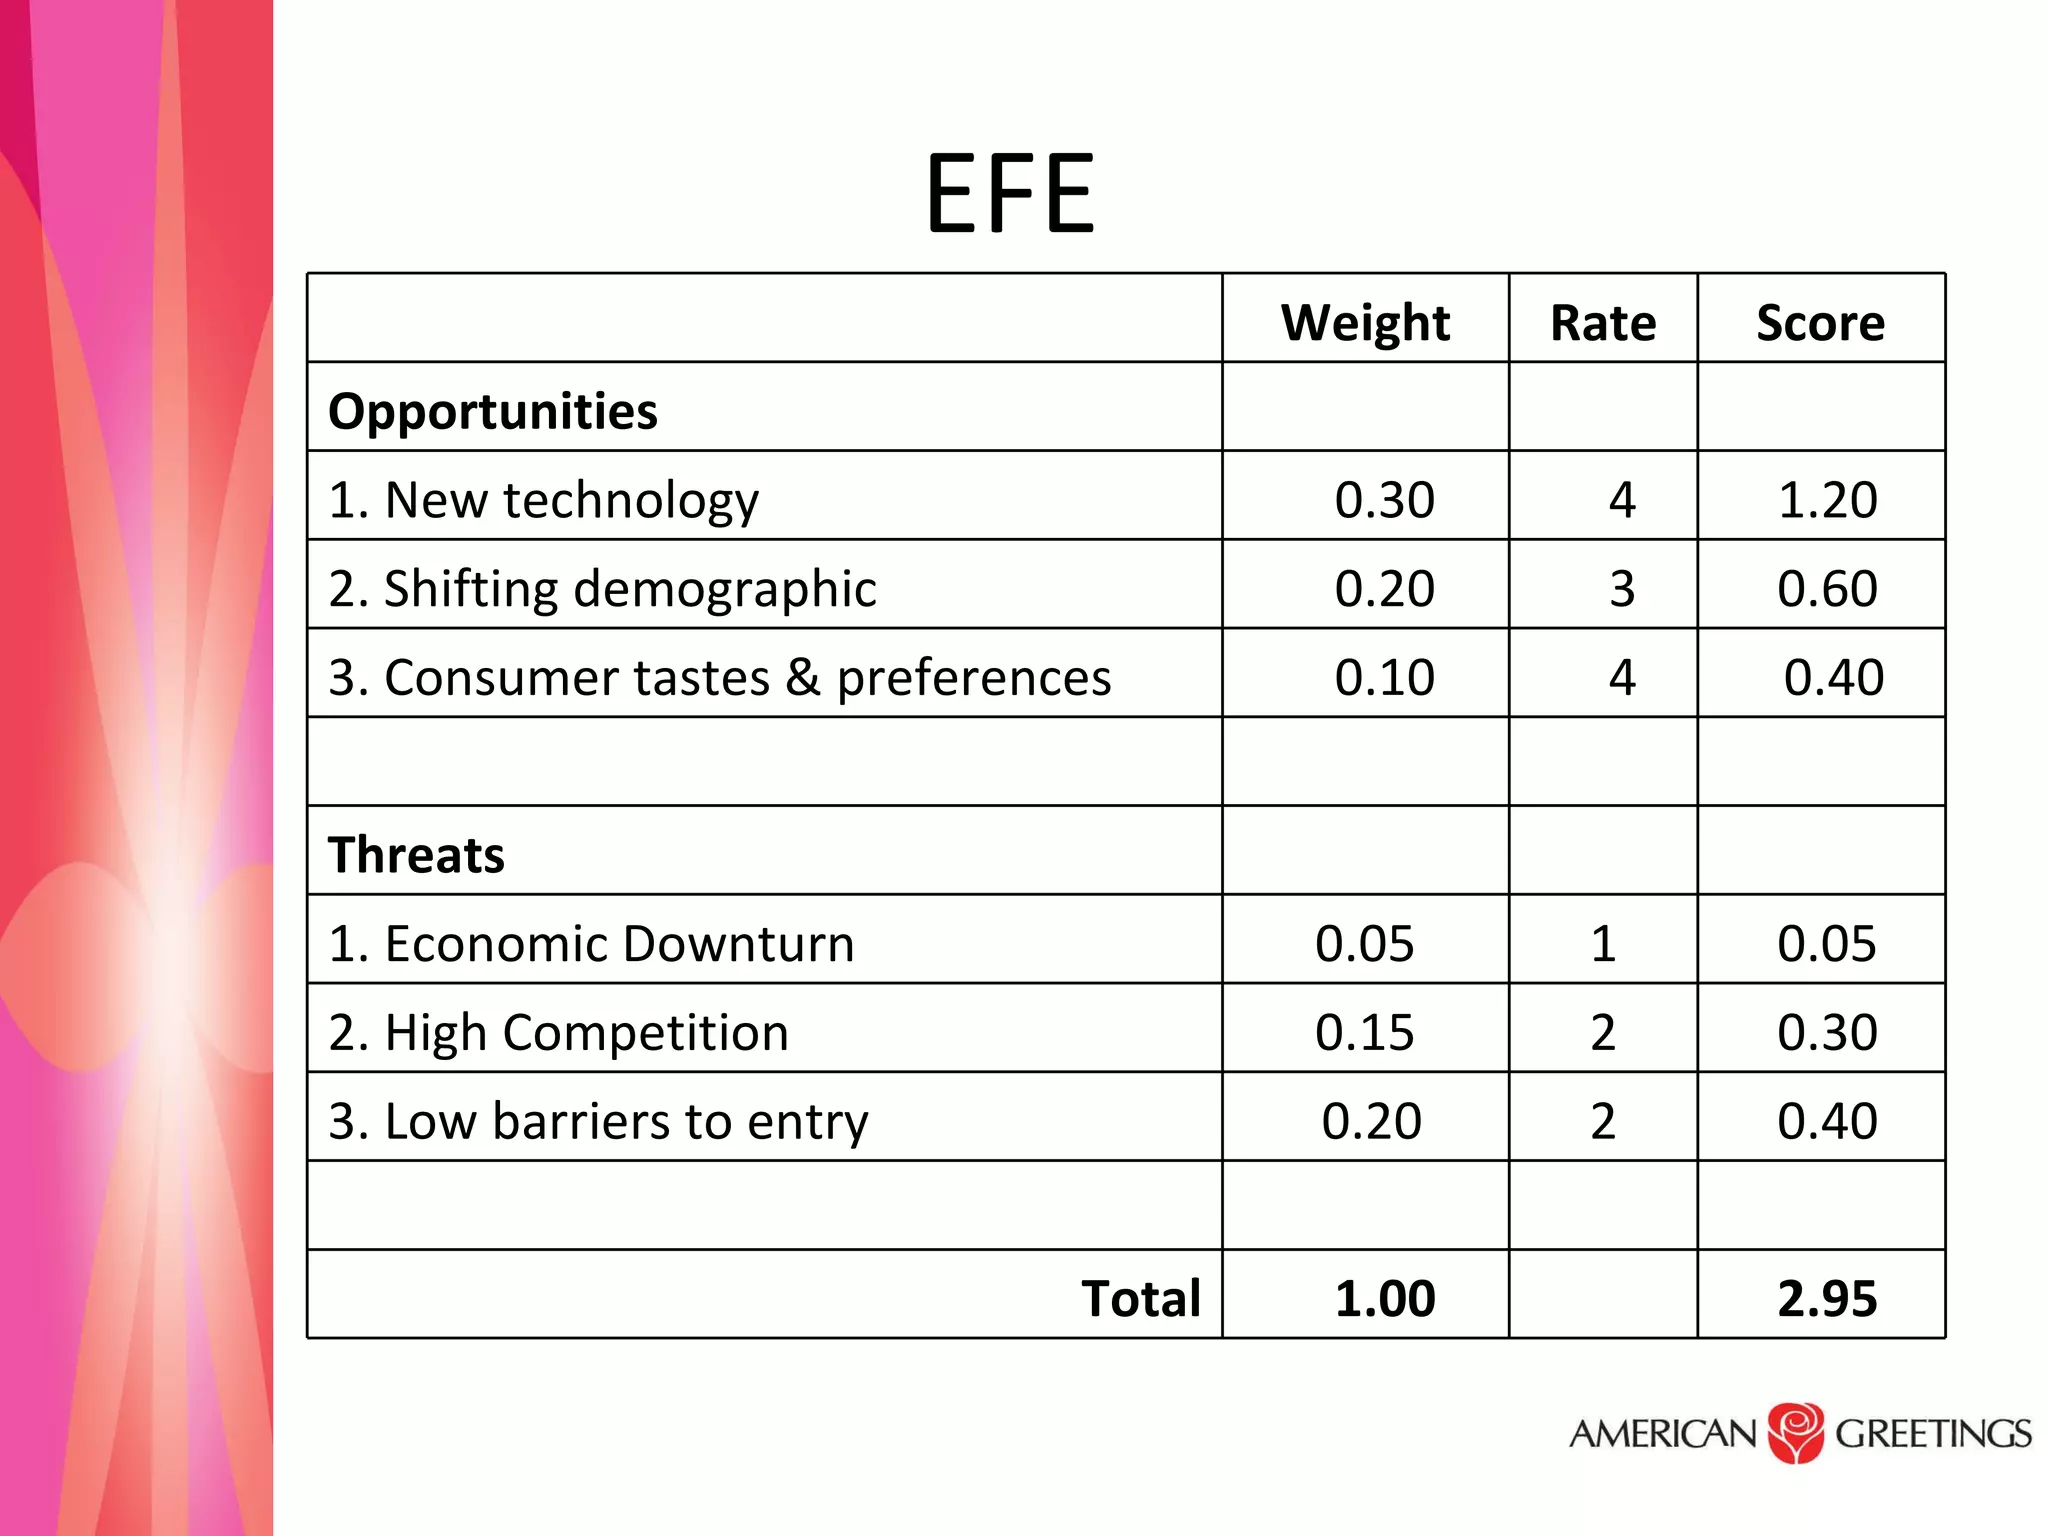
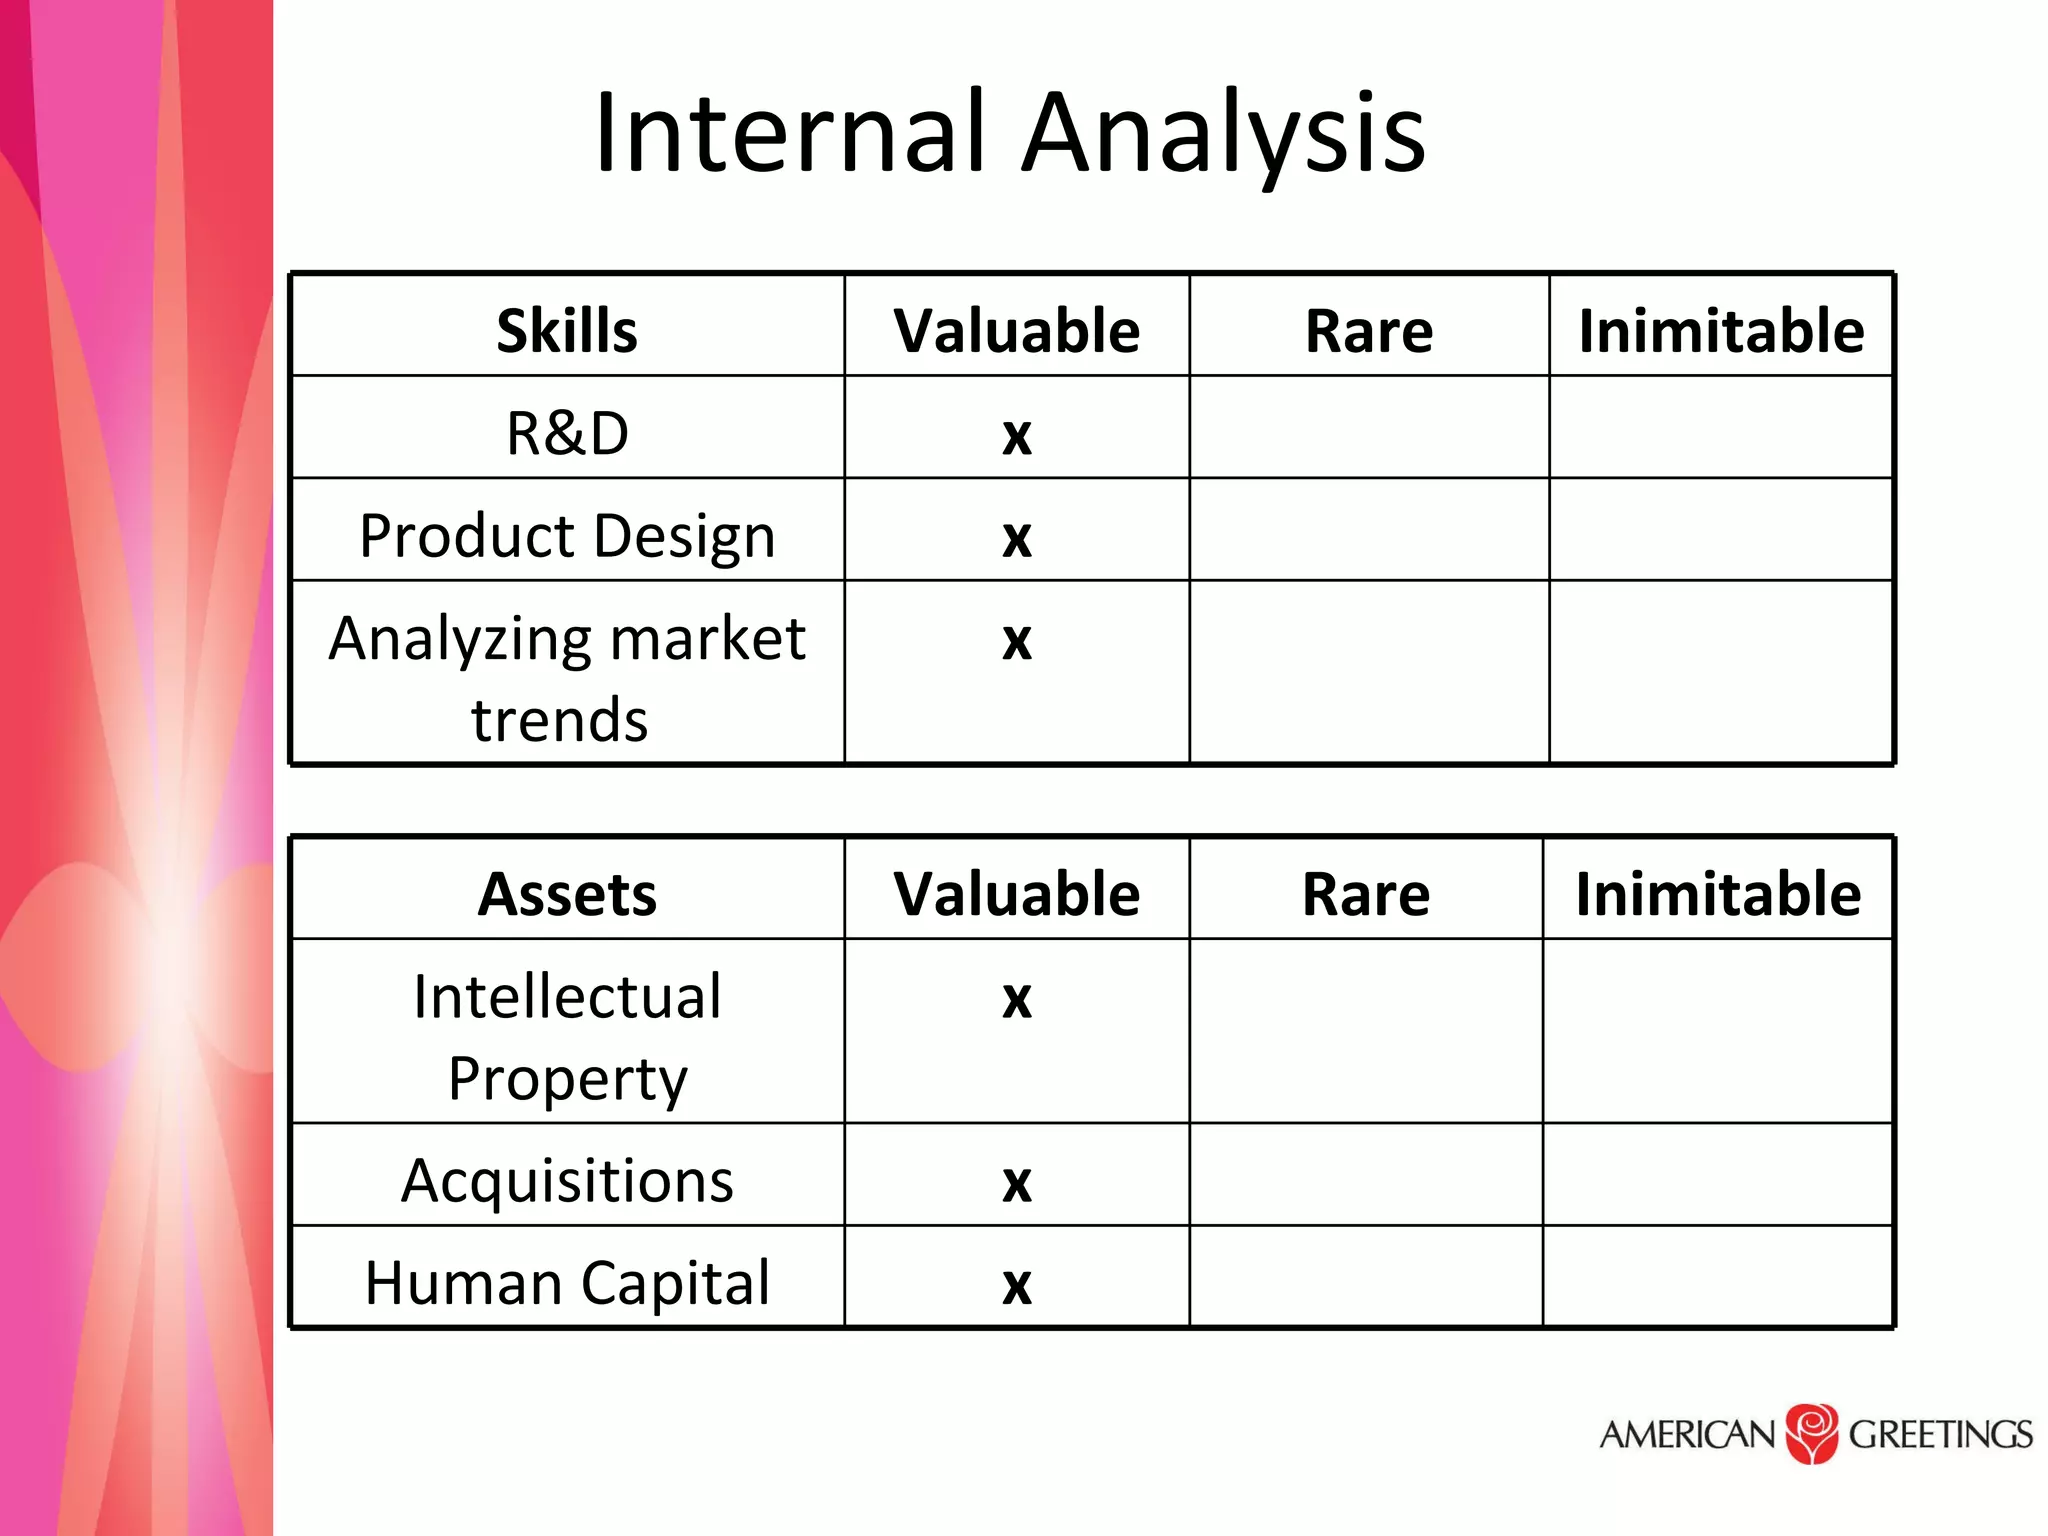
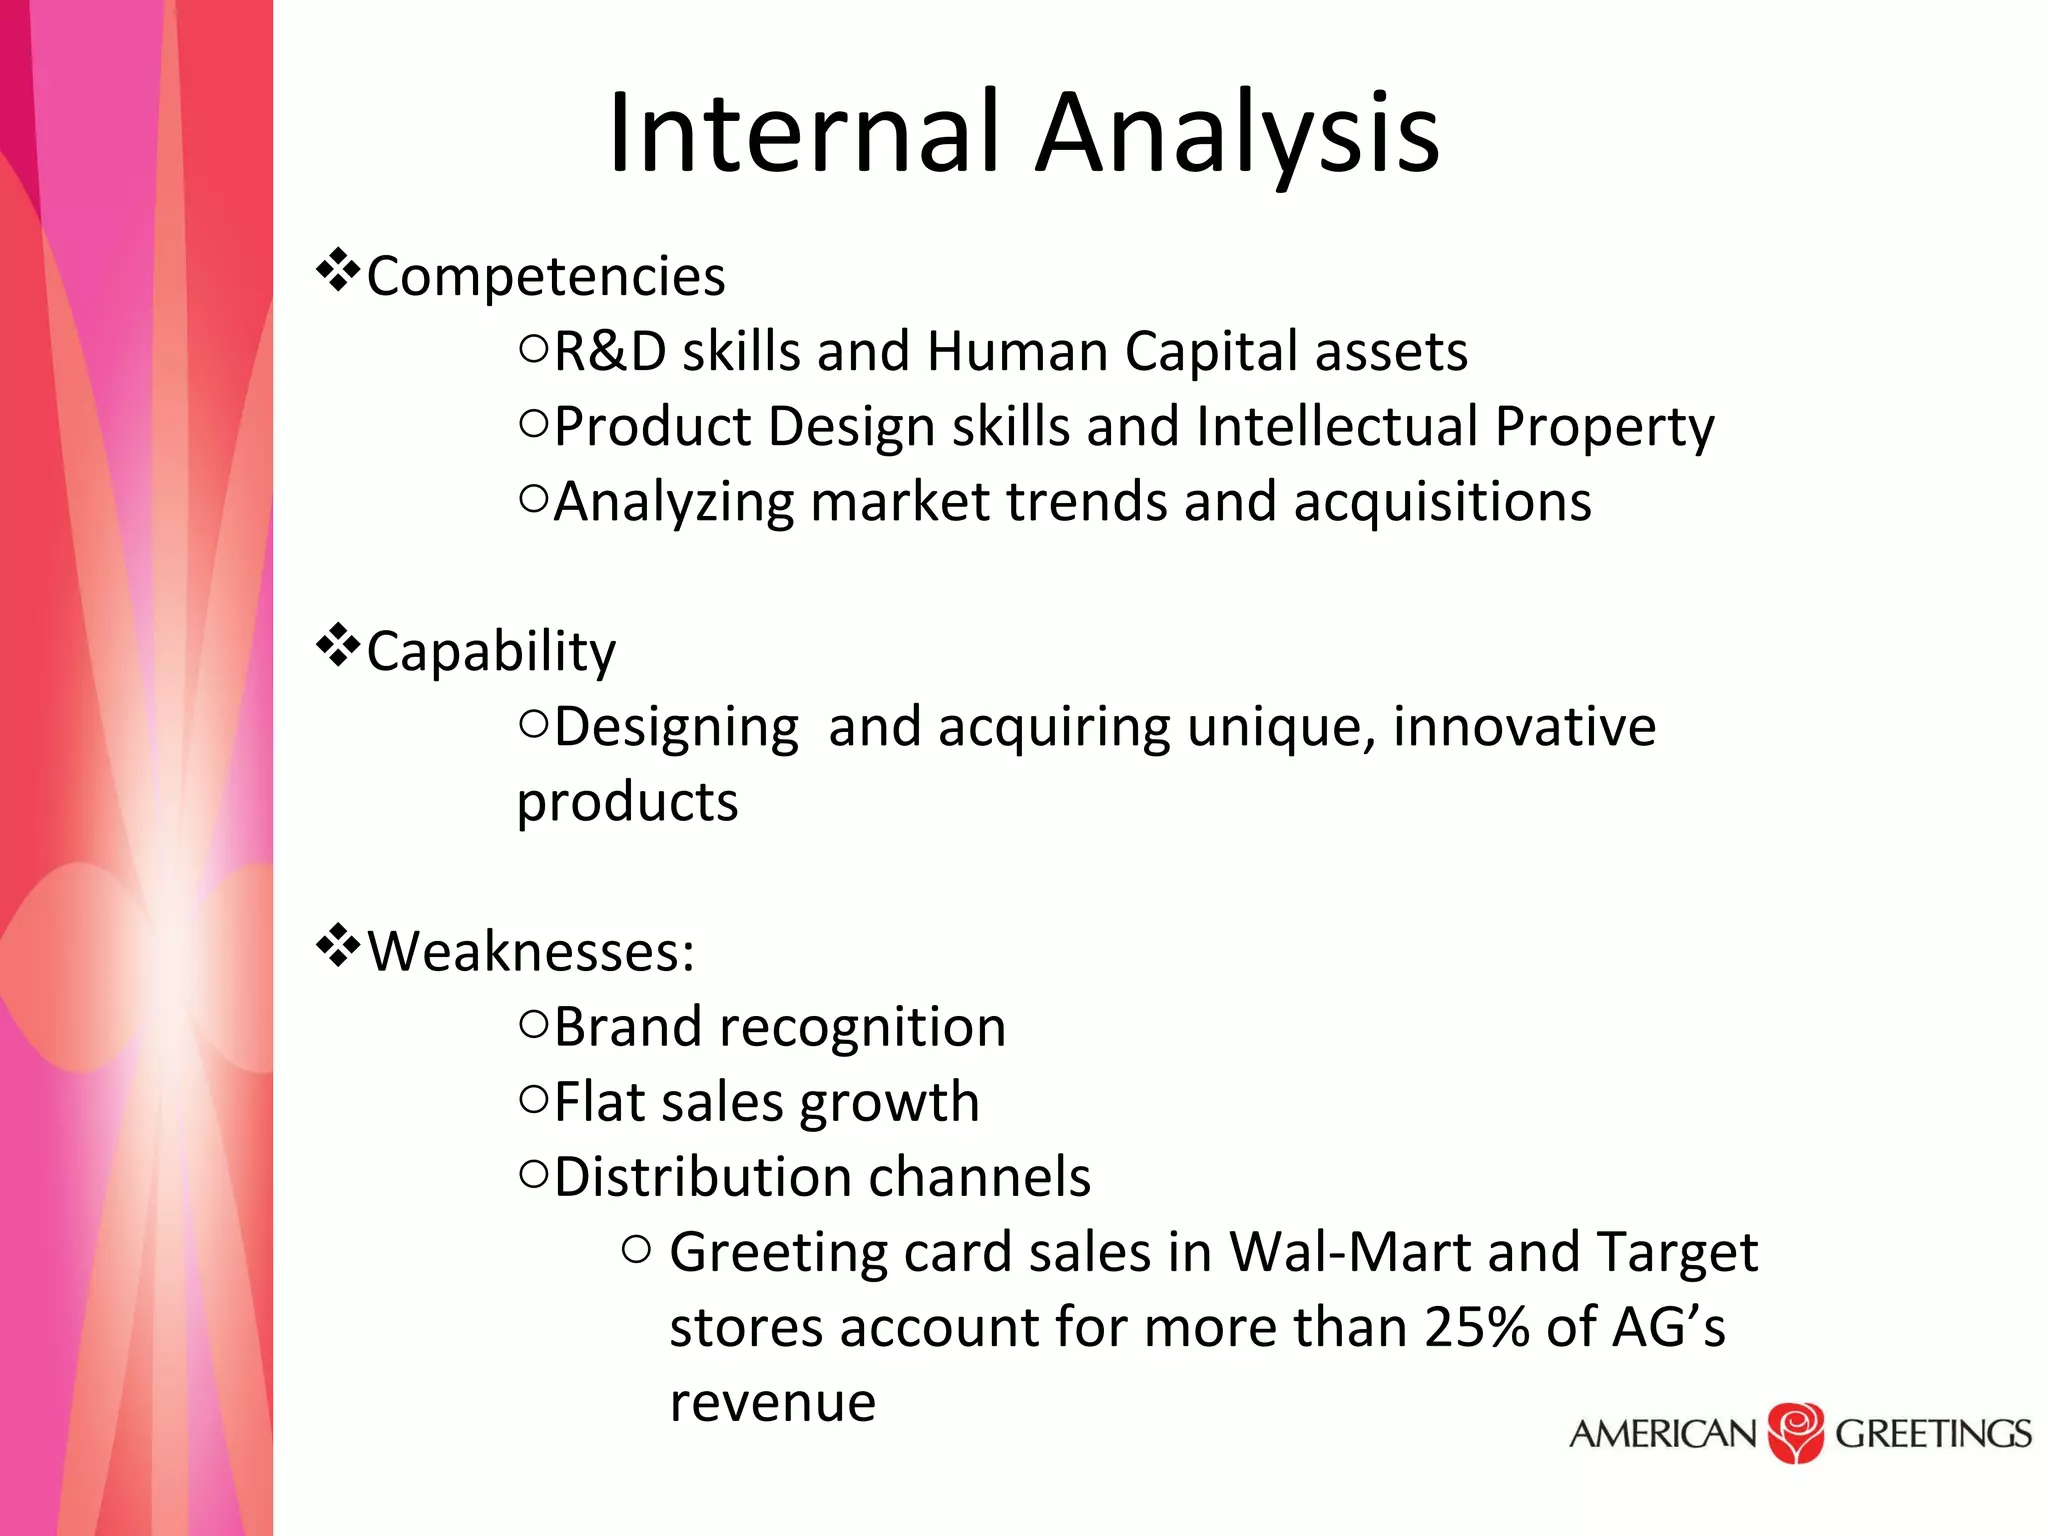
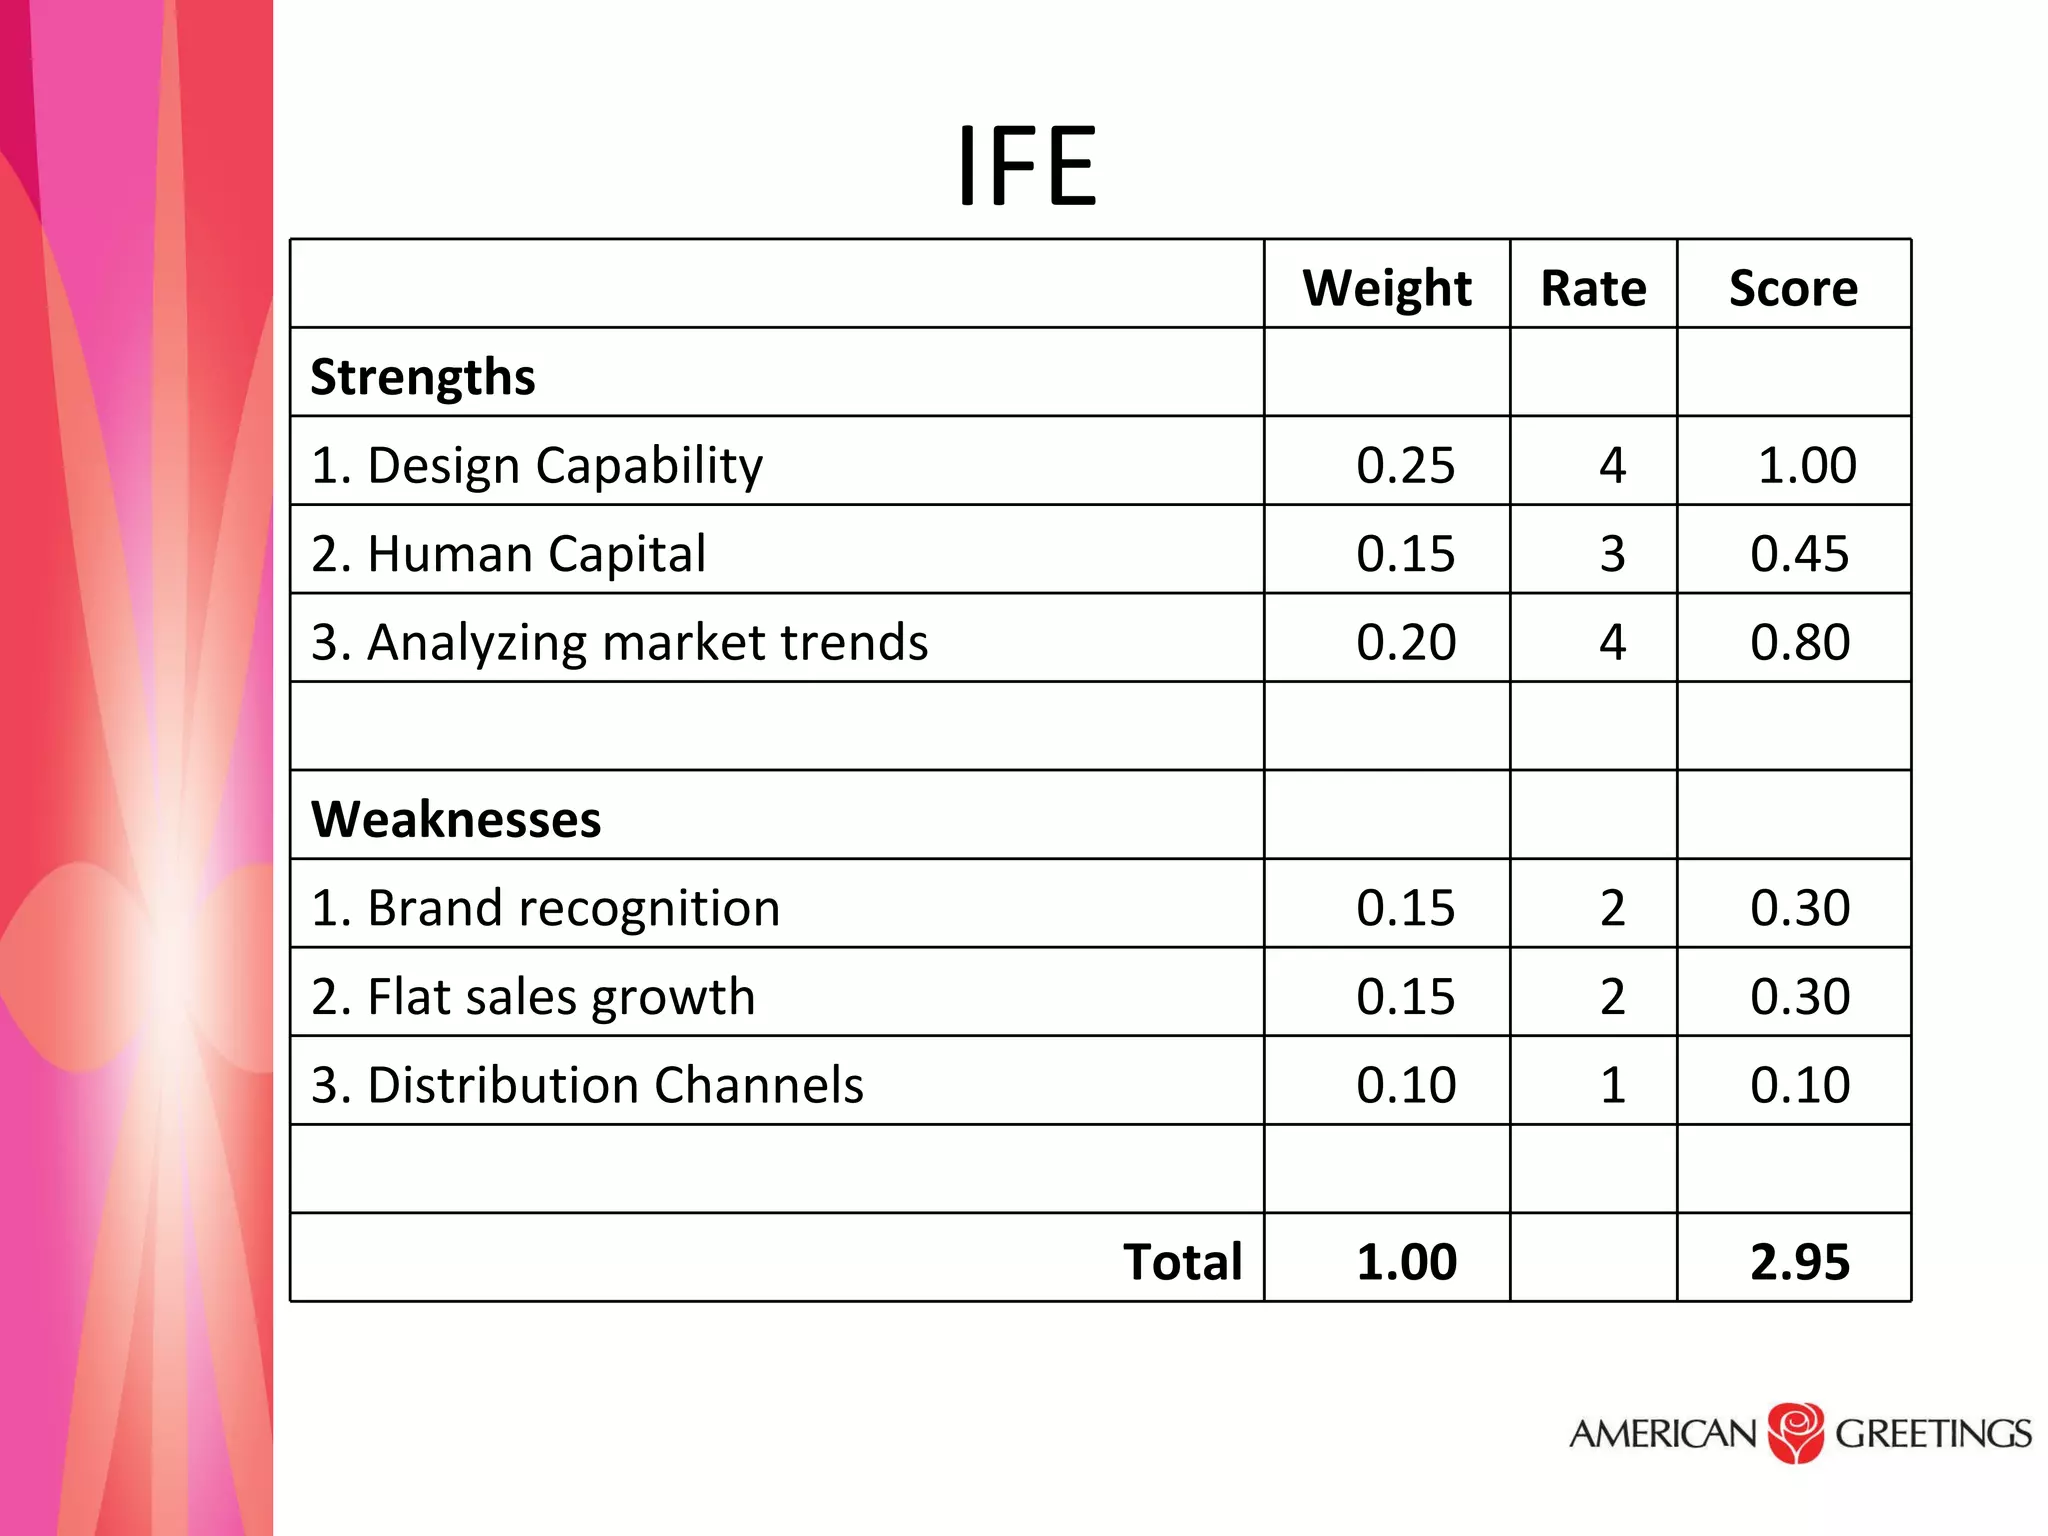
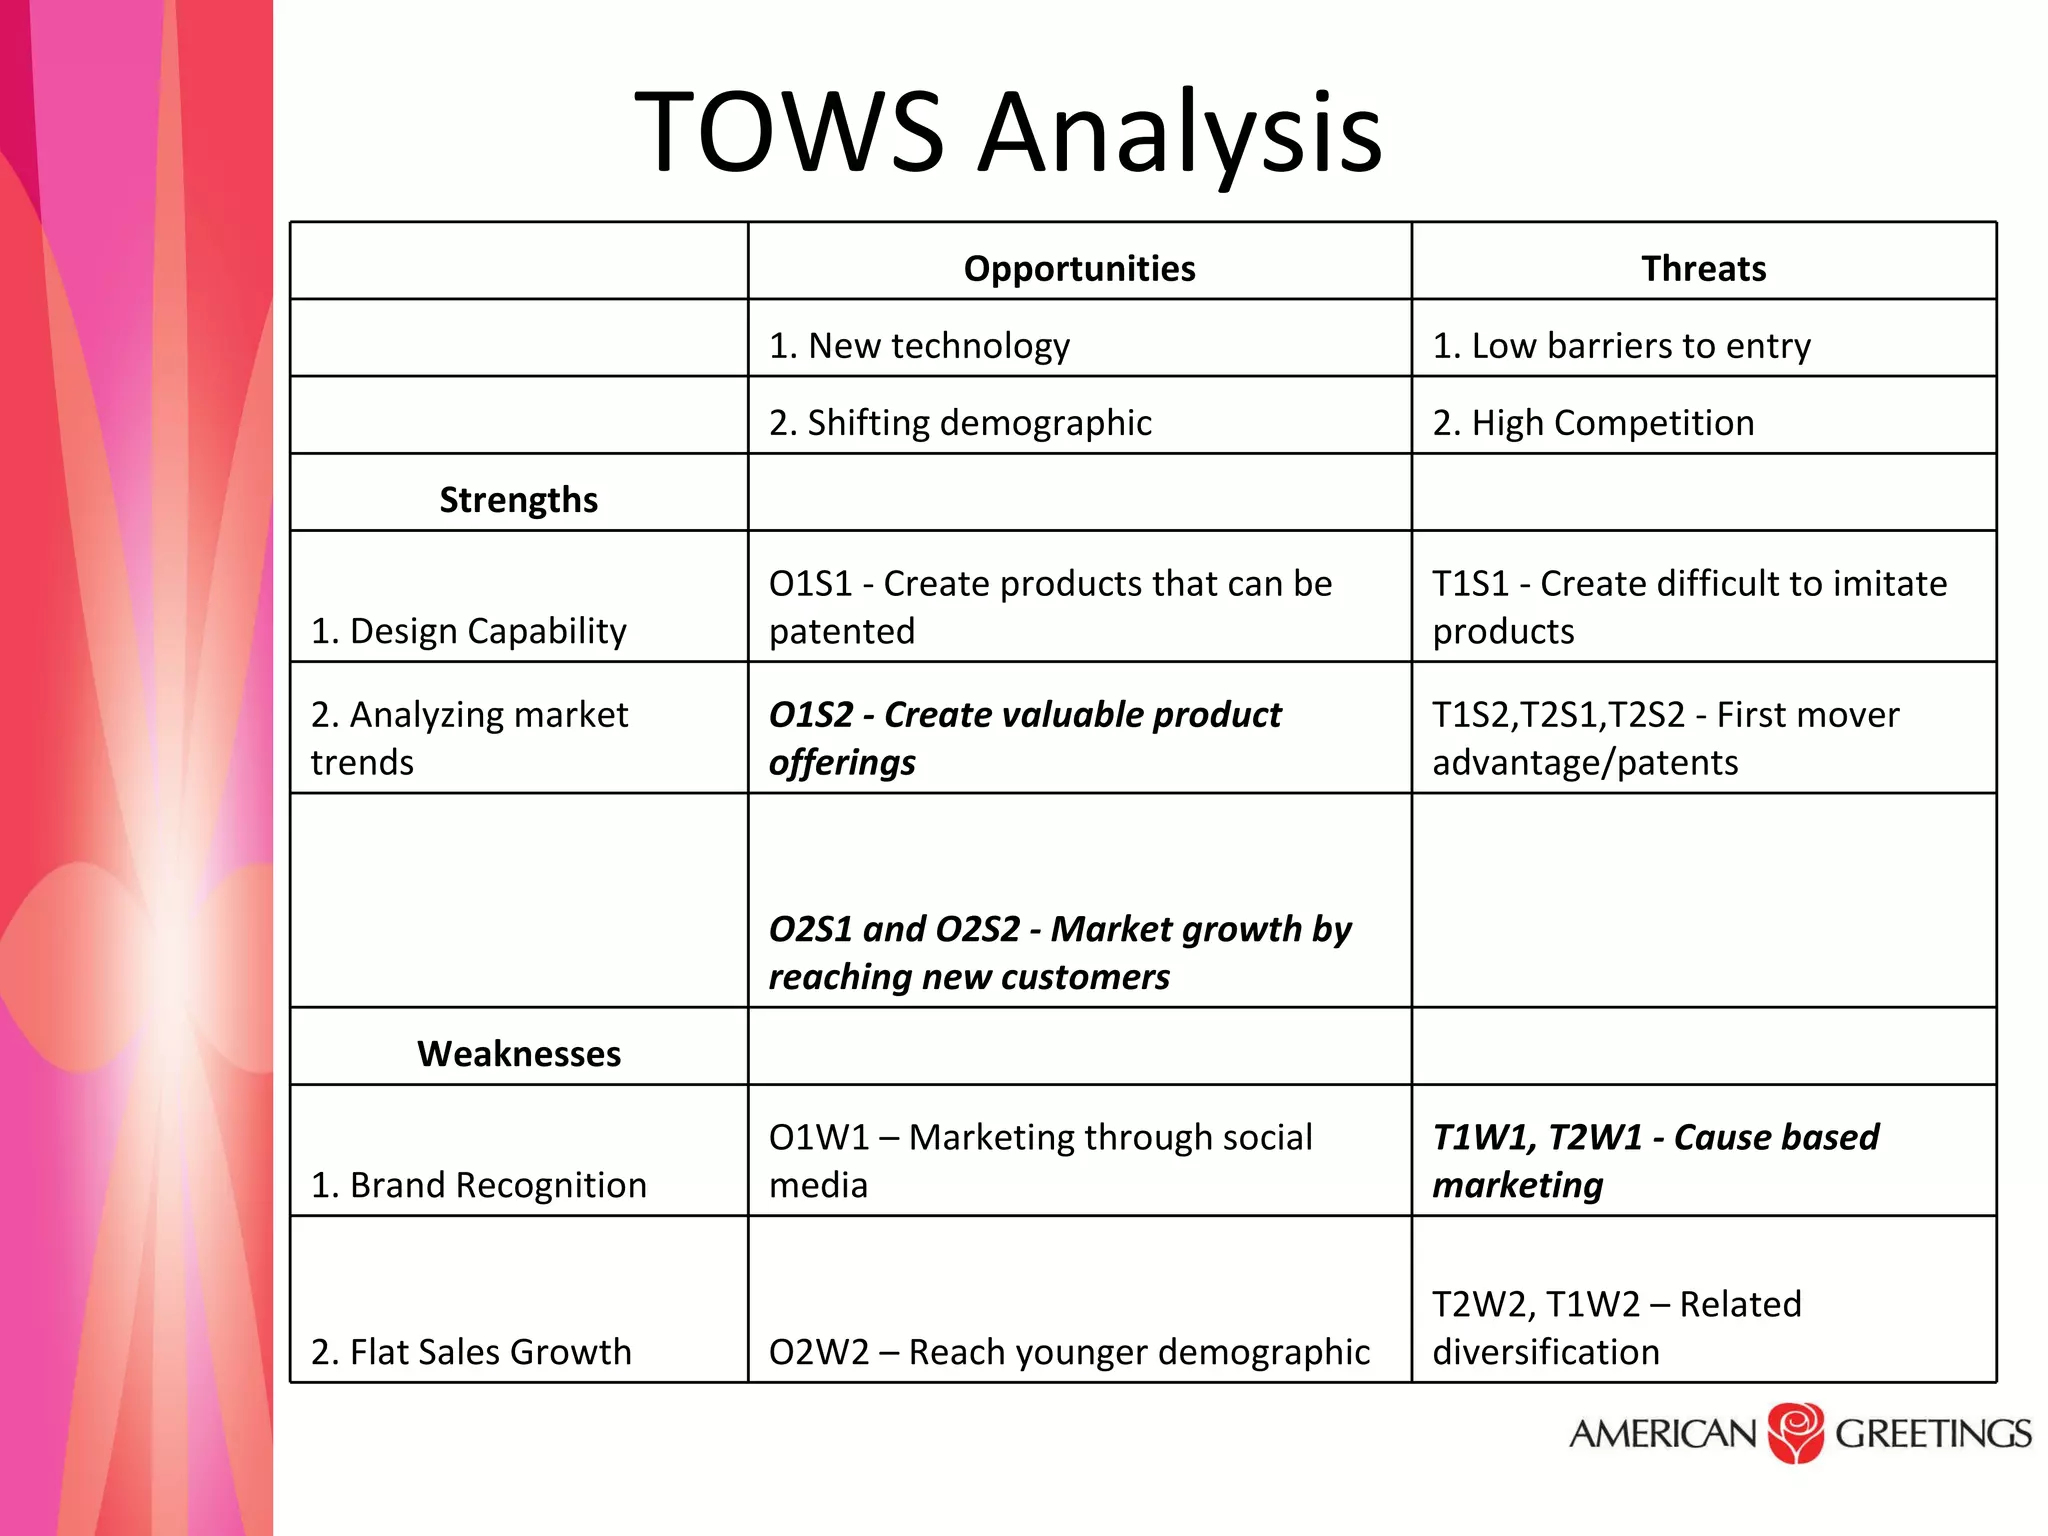
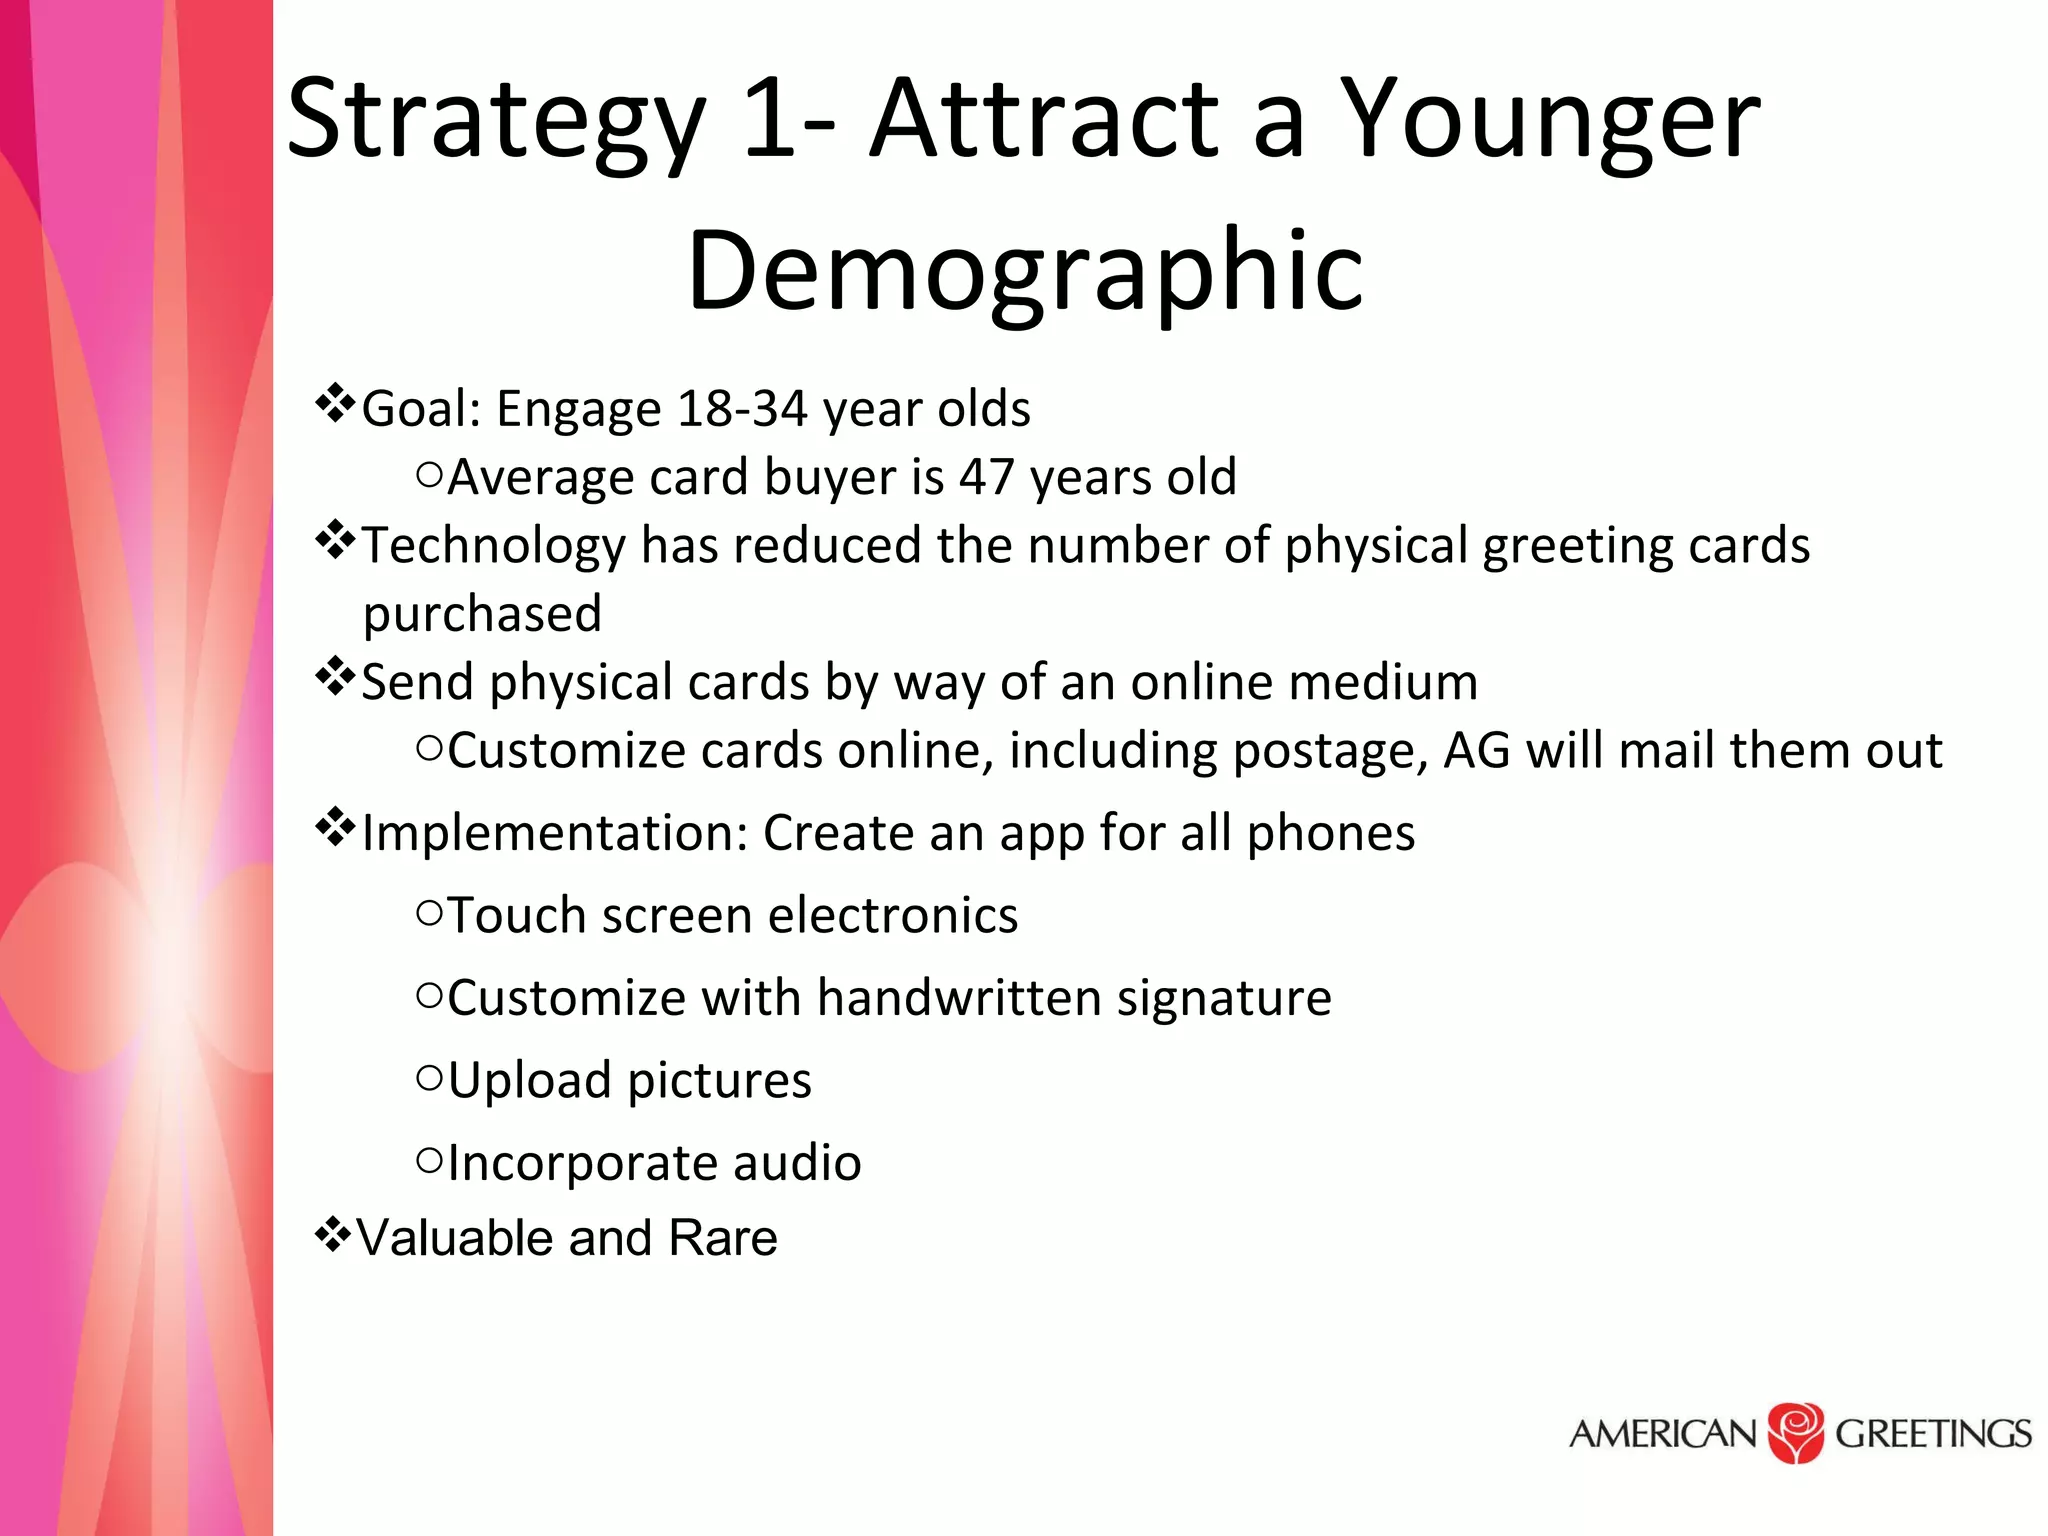
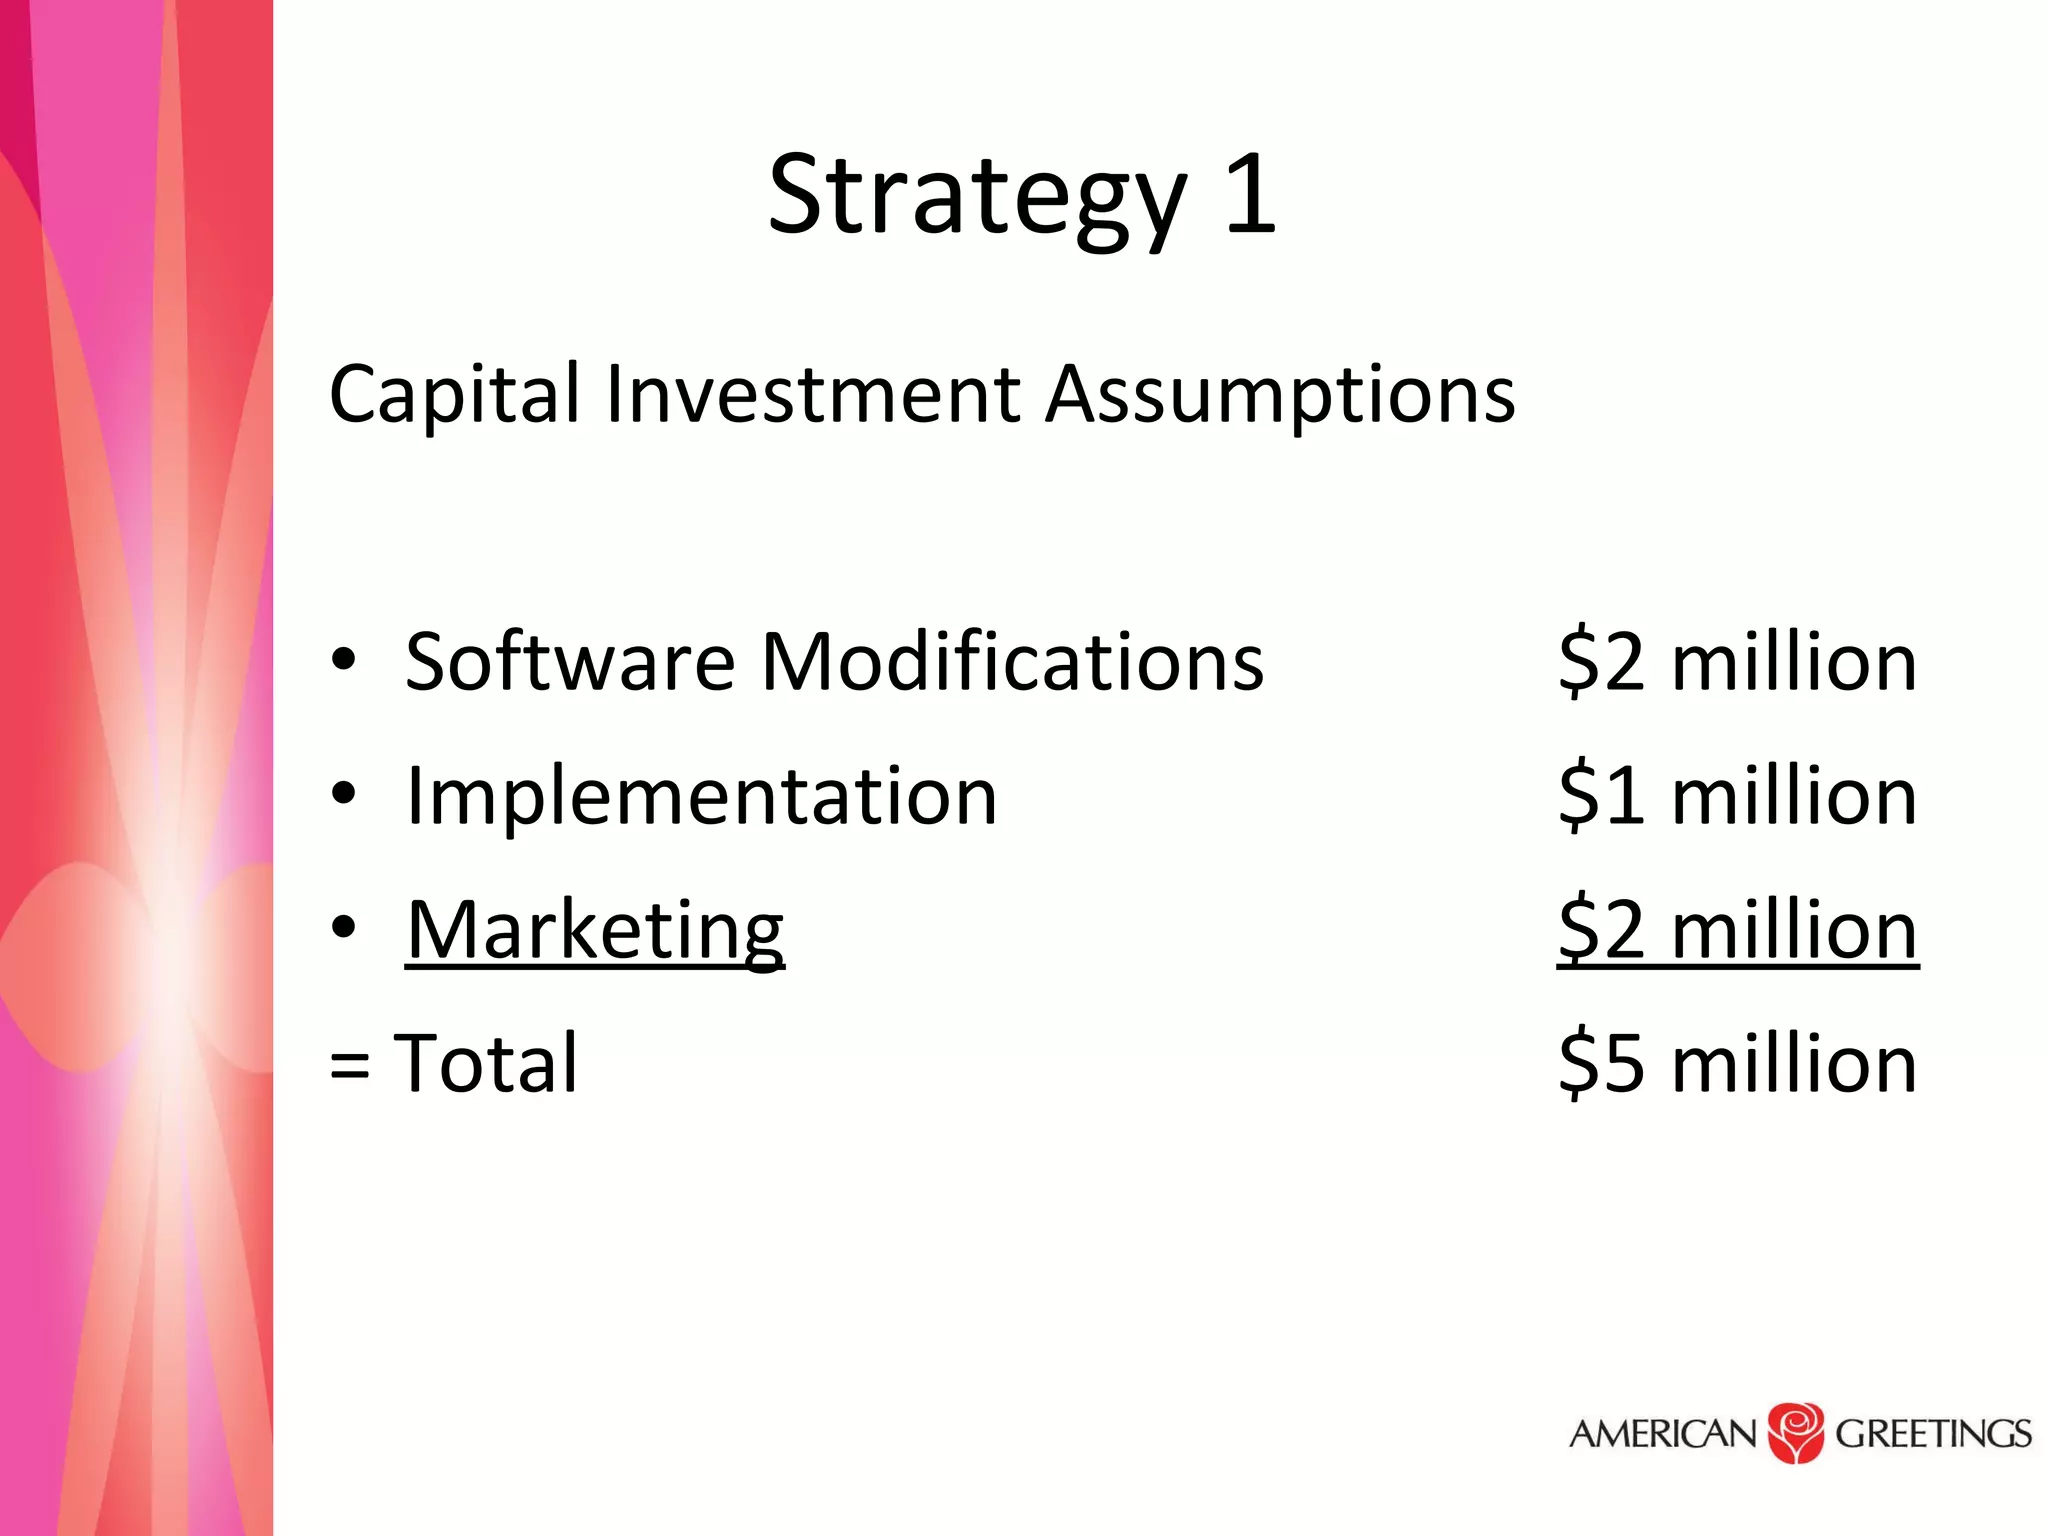
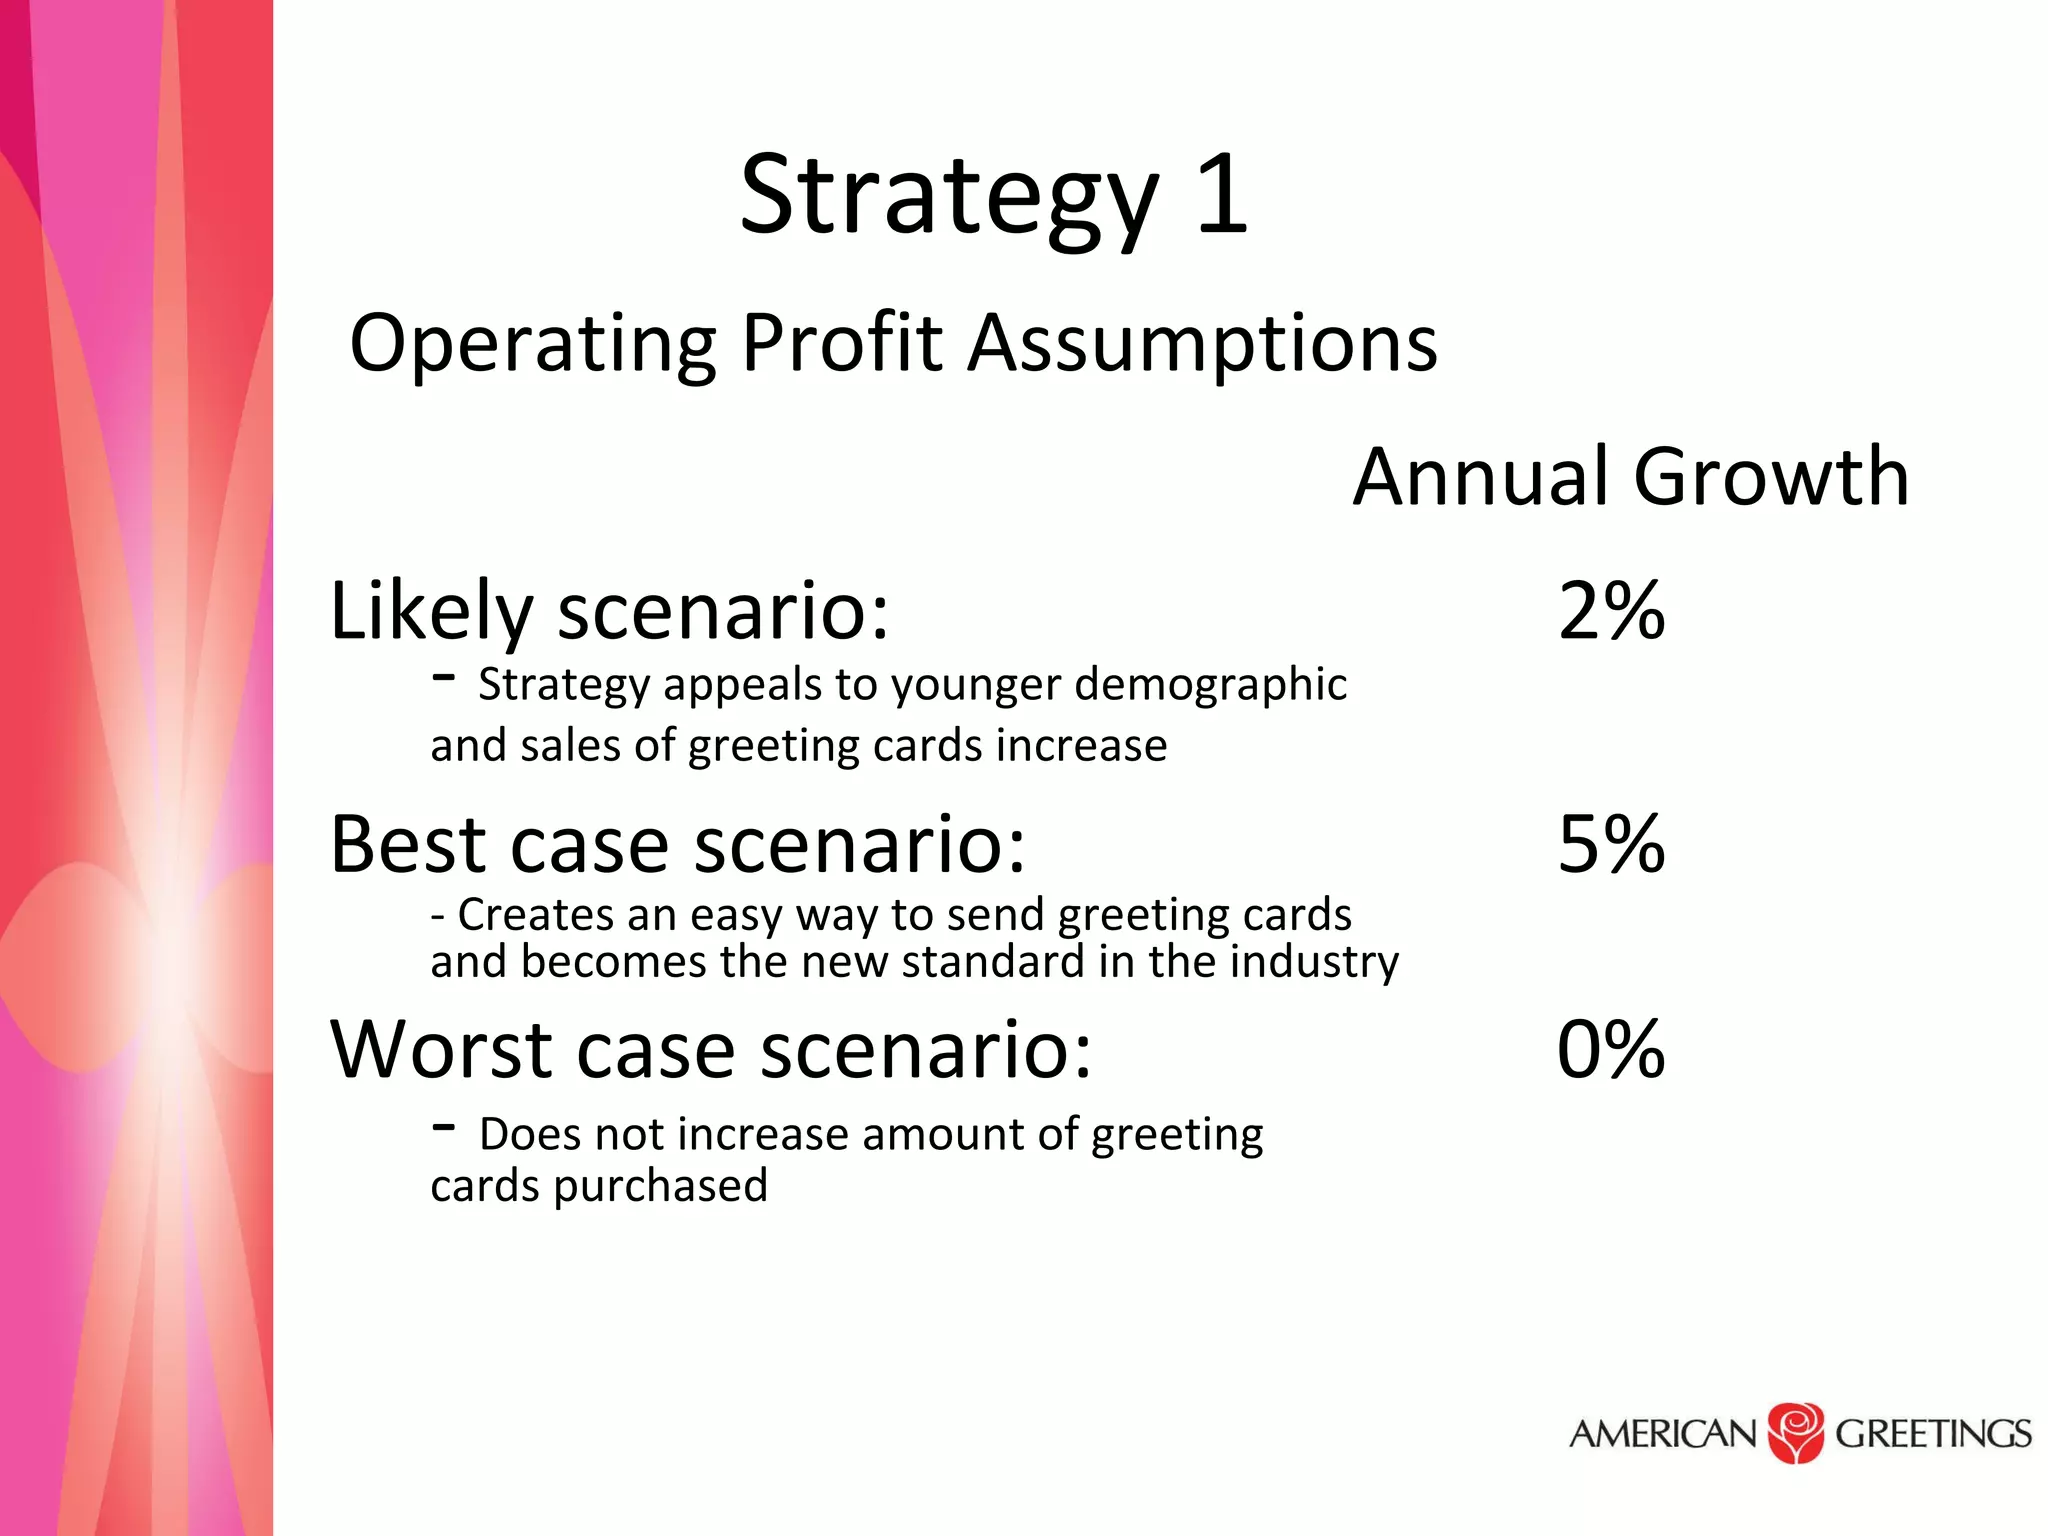
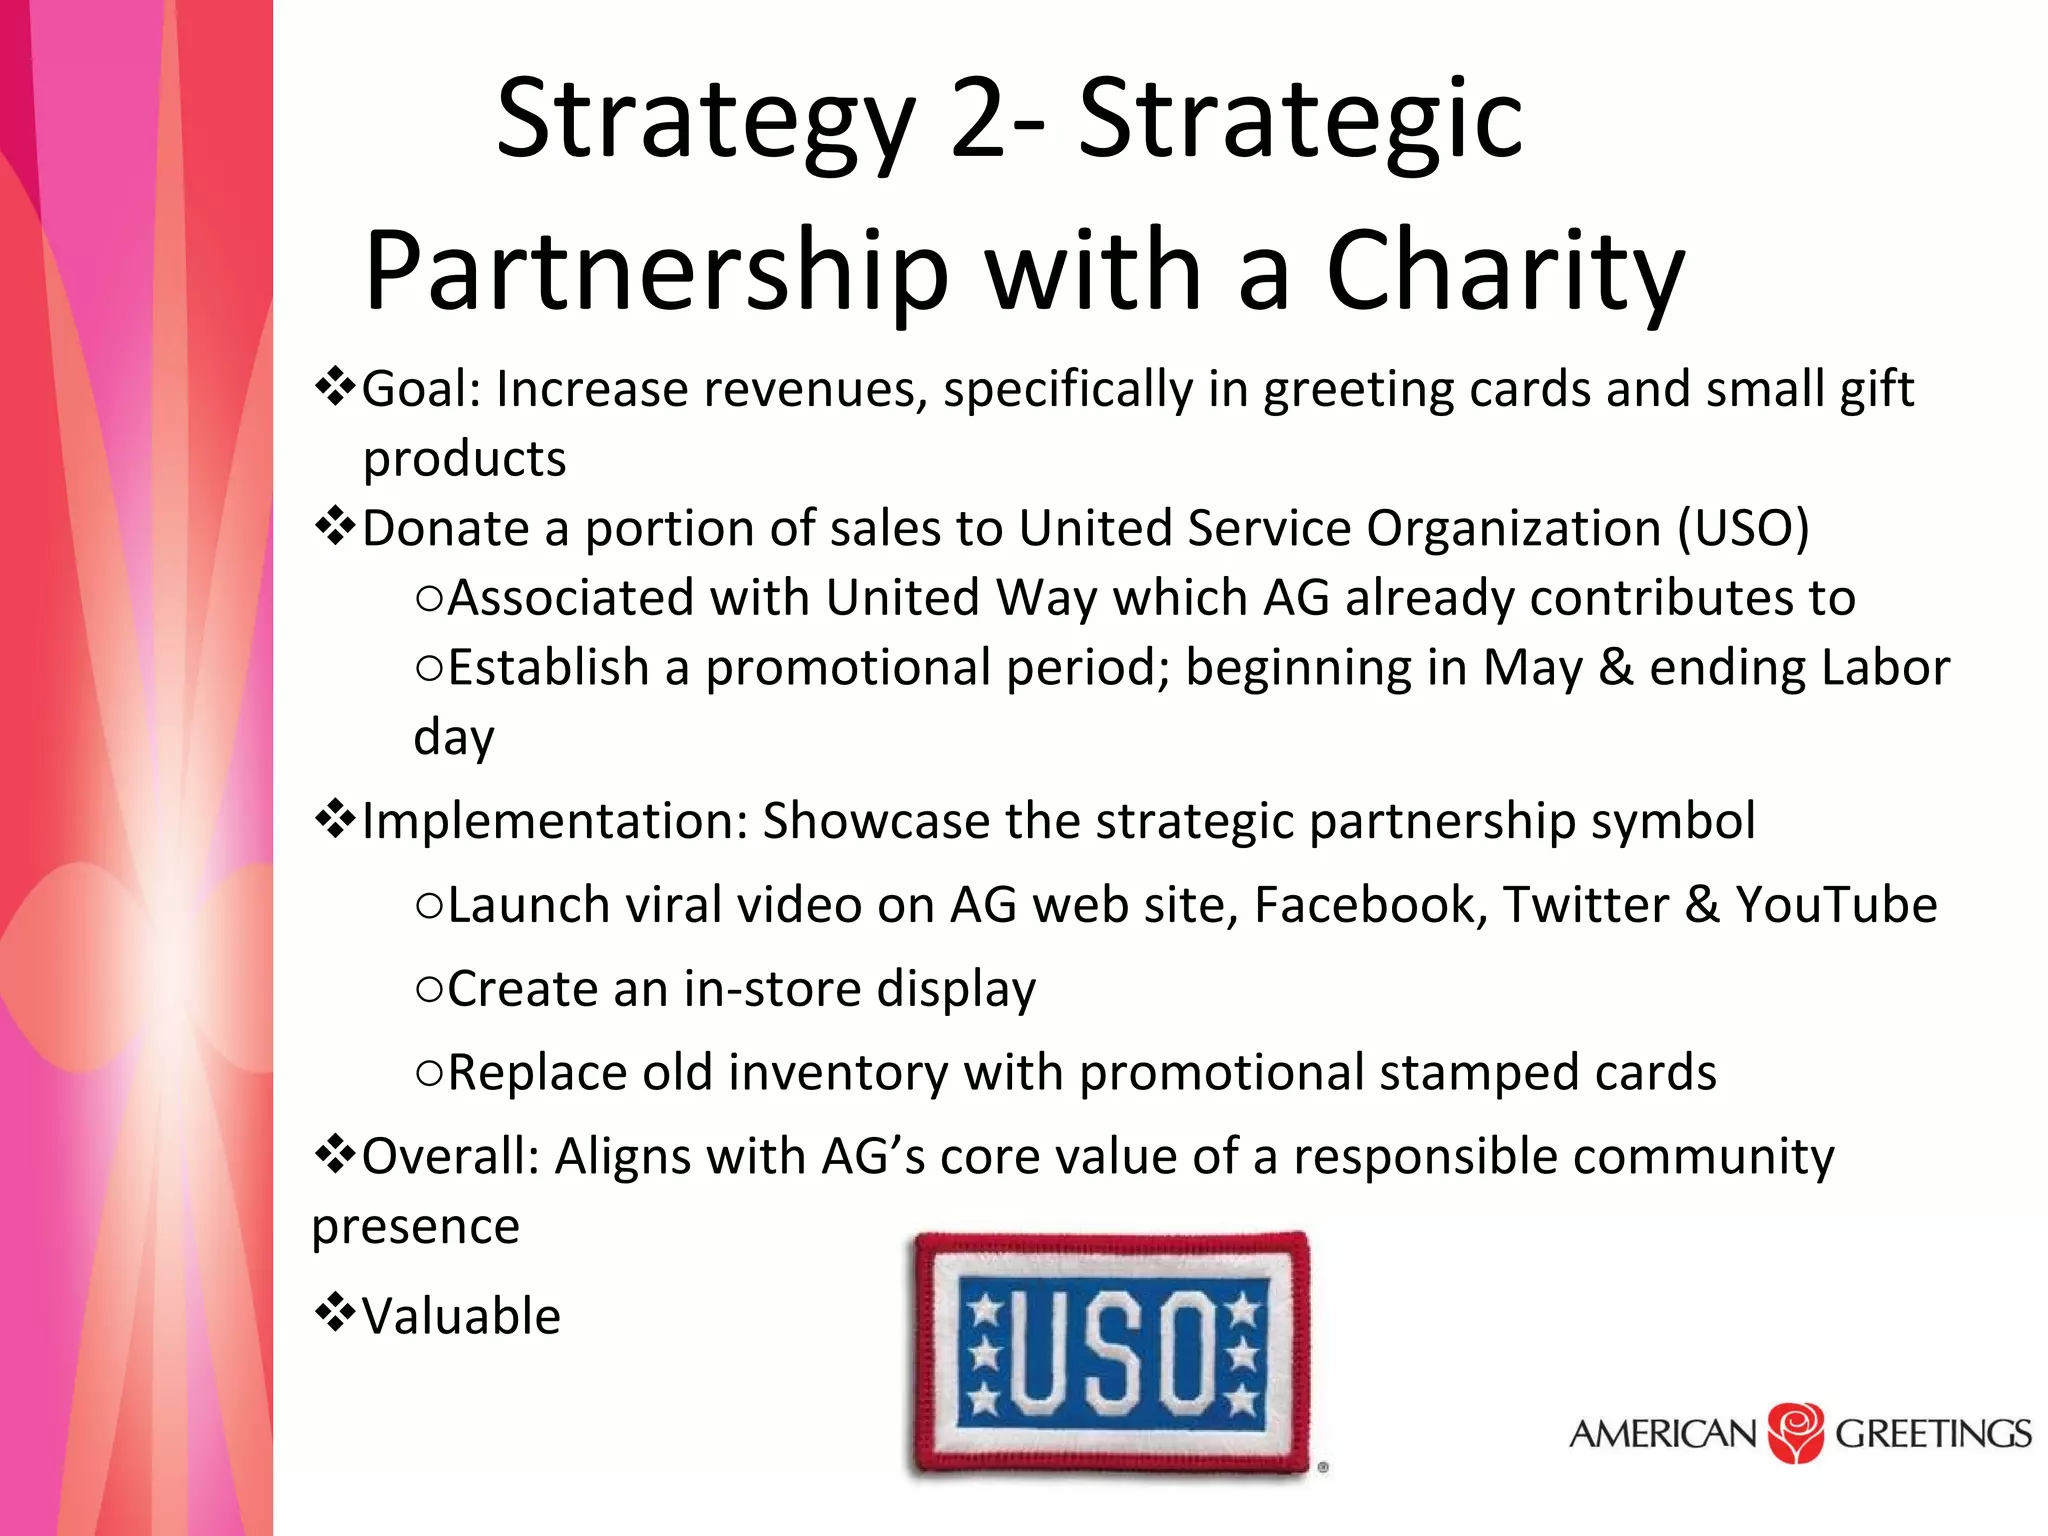
Sally Brocious Jason Gass Shanicka Hardaway  Andy Minderman  Katie Stinson May 4, 2011
Company Background  Operates predominantly in a single industry A leading manufacturer of social expression products  5 major greeting card brands  Family oriented culture CEO, Zev Weiss
Mission Statement  American Greetings (AG) creates: Innovative products & services to meet consumers’ needs to connect, express, & celebrate  Superior value for retail partners, customers and shareholders An environment for associates to excel  Collaborative & reliable relationships with suppliers  A responsible community presence through leadership & stability
External Analysis General Environment T O O O T O
External Analysis Industry Environment T T T T T
EFE    Weight Rate Score Opportunities       1. New technology 0.30  4  1.20  2. Shifting demographic 0.20  3  0.60  3. Consumer tastes & preferences 0.10  4  0.40         Threats       1. Economic Downturn 0.05  1  0.05  2. High Competition 0.15  2  0.30  3. Low barriers to entry 0.20 2  0.40          Total 1.00    2.95
Internal Analysis  Assets Valuable Rare Inimitable Intellectual Property x Acquisitions x Human Capital x Skills Valuable Rare Inimitable R&D x Product Design x Analyzing market trends  x
Internal Analysis Competencies R&D skills and Human Capital assets Product Design skills and Intellectual Property  Analyzing market trends and acquisitions  Capability Designing  and acquiring unique, innovative products Weaknesses: Brand recognition Flat sales growth Distribution channels  Greeting card sales in Wal-Mart and Target stores account for more than 25% of AG’s revenue
IFE    Weight Rate Score Strengths       1. Design Capability 0.25  4  1.00 2. Human Capital  0.15  3  0.45  3. Analyzing market trends  0.20  4  0.80          Weaknesses       1. Brand recognition  0.15  2  0.30  2. Flat sales growth 0.15  2  0.30  3. Distribution Channels 0.10  1  0.10          Total 1.00    2.95
Key Success Factors (KSFs) Who are our customers? Women, median age 47 What do they want? Products that help people connect and recognize life’s special moments How do we survive competition? Product design  Technological enhancements  Key Success Factors: Price  Quality products  Innovative products
Financial Performance  all figures in millions   2011 2010 2009* 2008 Revenue 1,592.6  1,635.9  1,690.7  1,776.5 Revenue Growth % -2.6% -3.2% -4.8% -1.0% Gross Profit 877.9 885.2  836.4  950.0  Operating Profit 174.7  139.1  (253.2) 128.8
Financial Performance all figures in millions   American Greetings Hallmark CSS Industries Current Market Share 36.0% 50.0% < 5%         Sales 1,560.2 4,000.0  440.1  Employees 8,000  13,400  2,000  Market Cap 960.2  N/A  183.6          Profit Margin 5.5% N/A  -5.7% Operating Margin 11.0% N/A  2.8% ROA 5.7% N/A  2.1% ROE 11.6% N/A  -9.7% Debt/Equity 0.31  N/A  0.16
Current EVA of  American Greetings  Equity 748.9 Net Operating Profit 174.7 Debt 232.7 NOPAT 97.5 Risk Free Rate 1% WACC 13.8% Risk Premium 8% Capital Employed 1,189.9 Return on Borrowings 5%     Effective Tax Rate 44.2%     EVA = NOPAT - (WACC*CE) =97.5 - (13.8%*1,189.9) =(66.9 million)
Current EVA of  American Greetings  IRR = 2.31% 5.1  4.8  4.5  4.3  (1.3) N/A EVA Increase/Decrease (49.6) (54.7) (59.5) (64.0) (68.2) (66.9) EVA           45.0 Capital Investment 10.6  10.1  9.6  9.2  8.7  N/A OP Increase/Decrease 223.0  212.3  202.2  192.6  183.4  174.7 Net Operating Profit 5 4 3 2 1 0   Year Year Year Year Year Year  
TOWS Analysis    Opportunities Threats   1. New technology 1. Low barriers to entry   2. Shifting demographic 2. High Competition Strengths     1. Design Capability O1S1 - Create products that can be patented T1S1 - Create difficult to imitate products 2. Analyzing market trends O1S2 - Create valuable product offerings T1S2,T2S1,T2S2 - First mover advantage/patents   O2S1 and O2S2 - Market growth by reaching new customers Weaknesses     1. Brand Recognition  O1W1 – Marketing through social media  T1W1, T2W1 - Cause based marketing  2. Flat Sales Growth  O2W2 – Reach younger demographic  T2W2, T1W2 – Related diversification
Strategy 1- Attract a Younger Demographic Goal: Engage 18-34 year olds  Average card buyer is 47 years old Technology has reduced the number of physical greeting cards  purchased Send physical cards by way of an online medium  Customize cards online, including postage, AG will mail them out Implementation: Create an app for all phones Touch screen electronics Customize with handwritten signature Upload pictures  Incorporate audio Valuable and Rare
Strategy 1 Capital Investment Assumptions Software Modifications $2 million Implementation $1 million Marketing $2 million = Total $5 million
Strategy 1  Operating Profit Assumptions Annual Growth Likely scenario: 2% -  Strategy appeals to younger demographic  and sales of greeting cards increase Best case scenario: 5% - Creates an easy way to send greeting cards  and becomes the new standard in the industry Worst case scenario: 0% -  Does not increase amount of greeting cards purchased
Strategy 1  - Likely IRR = 65.70% 1.3  1.2  1.2  1.2  1.3  N/A EVA Increase/Decrease (60.8) (62.0) (63.3) (64.5) (65.6) (66.9) EVA           5.0 Capital Investment 3.8  3.7  3.6  3.6  3.5  N/A OP Increase/Decrease 192.9  189.1  185.4  181.8  178.2  174.7 Net Operating Profit 5 4 3 2 1 0   Year Year Year Year Year Year  
Strategy 1  - Best IRR = 178.37% 5.1  4.8  4.5  4.3  4.2  N/A EVA Increase/Decrease (44.0) (49.1) (53.9) (58.4) (62.7) (66.9) EVA           5.0 Capital Investment 10.6  10.1  9.6  9.2  8.7  N/A OP Increase/Decrease 223.0  212.3  202.2  192.6  183.4  174.7 Net Operating Profit 5 4 3 2 1 0   Year Year Year Year Year Year  
Strategy 1  - Worst IRR = 0% (0.8) (0.8) (0.8) (0.8) (0.7) N/A EVA Increase/Decrease (70.9) (70.1) (69.2) (68.4) (67.6) (66.9) EVA           5.0 Capital Investment -  -  -  -  -  N/A OP Increase/Decrease 174.7  174.7  174.7  174.7  174.7  174.7 Net Operating Profit 5 4 3 2 1 0   Year Year Year Year Year Year  
Strategy 2- Strategic  Partnership with a Charity Goal: Increase revenues, specifically in greeting cards and small gift  products Donate a portion of sales to United Service Organization (USO) Associated with United Way which AG already contributes to Establish a promotional period; beginning in May & ending Labor day Implementation: Showcase the strategic partnership symbol  Launch viral video on AG web site, Facebook, Twitter & YouTube Create an in-store display  Replace old inventory with promotional stamped cards  Overall: Aligns with AG’s core value of a responsible community presence Valuable
Strategy 2  Capital Investment Assumptions Marketing (in-store) $2.0 million Software Modification $0.1 million =Total $2.1 million
Strategy 2 Operating Profit Assumptions Annual Growth Likely scenario: 1% - Increase brand recognition by appealing to those  who look for ways to be socially responsible Best case scenario: 3% - Increase brand recognition & sales revenue during and after promotional period Worst case scenario: 0% -  Promotion does not affect sales
Strategy 2 - Likely IRR = 79.5% 0.2  0.2  0.2  0.2  0.7  N/A EVA Increase/Decrease (65.5) (65.7) (65.9) (66.1) (66.2) (66.9) EVA           2.1 Capital Investment 1.8  1.8  1.8  1.8  1.7  N/A OP Increase/Decrease 183.6  181.8  180.0  178.2  176.4  174.7 Net Operating Profit 5 4 3 2 1 0   Year Year Year Year Year Year  
Strategy 2 - Best IRR = 252.04% 2.5  2.4  2.3  2.2  2.6  N/A EVA Increase/Decrease (55.0) (57.4) (59.8) (62.1) (64.3) (66.9) EVA           2.1 Capital Investment 5.9  5.7  5.6  5.4  5.2  N/A OP Increase/Decrease 202.5  196.6  190.9  185.3  179.9  174.7 Net Operating Profit 5 4 3 2 1 0   Year Year Year Year Year Year  
Strategy 2 - Worst IRR = 0% (0.8) (0.8) (0.8) (0.8) (0.3) N/A EVA Increase/Decrease (70.5) (69.7) (68.8) (68.0) (67.2) (66.9) EVA           2.1 Capital Investment -  -  -  -  -  N/A OP Increase/Decrease 174.7  174.7  174.7  174.7  174.7  174.7 Net Operating Profit 5 4 3 2 1 0   Year Year Year Year Year Year  
Recommendation – Strategy 1  Population is aging  Consumer trends are reflecting an increased use of technology Long-term benefit Increased application availability
Questions

American Greetings

  • 1.
    Sally Brocious JasonGass Shanicka Hardaway Andy Minderman Katie Stinson May 4, 2011
  • 2.
    Company Background Operates predominantly in a single industry A leading manufacturer of social expression products 5 major greeting card brands Family oriented culture CEO, Zev Weiss
  • 3.
    Mission Statement American Greetings (AG) creates: Innovative products & services to meet consumers’ needs to connect, express, & celebrate Superior value for retail partners, customers and shareholders An environment for associates to excel Collaborative & reliable relationships with suppliers A responsible community presence through leadership & stability
  • 4.
    External Analysis GeneralEnvironment T O O O T O
  • 5.
    External Analysis IndustryEnvironment T T T T T
  • 6.
    EFE  Weight Rate Score Opportunities       1. New technology 0.30 4 1.20 2. Shifting demographic 0.20 3 0.60 3. Consumer tastes & preferences 0.10 4 0.40         Threats       1. Economic Downturn 0.05 1 0.05 2. High Competition 0.15 2 0.30 3. Low barriers to entry 0.20 2 0.40         Total 1.00   2.95
  • 7.
    Internal Analysis Assets Valuable Rare Inimitable Intellectual Property x Acquisitions x Human Capital x Skills Valuable Rare Inimitable R&D x Product Design x Analyzing market trends x
  • 8.
    Internal Analysis CompetenciesR&D skills and Human Capital assets Product Design skills and Intellectual Property Analyzing market trends and acquisitions Capability Designing and acquiring unique, innovative products Weaknesses: Brand recognition Flat sales growth Distribution channels Greeting card sales in Wal-Mart and Target stores account for more than 25% of AG’s revenue
  • 9.
    IFE  Weight Rate Score Strengths       1. Design Capability 0.25 4 1.00 2. Human Capital 0.15 3 0.45 3. Analyzing market trends 0.20 4 0.80         Weaknesses       1. Brand recognition 0.15 2 0.30 2. Flat sales growth 0.15 2 0.30 3. Distribution Channels 0.10 1 0.10         Total 1.00   2.95
  • 10.
    Key Success Factors(KSFs) Who are our customers? Women, median age 47 What do they want? Products that help people connect and recognize life’s special moments How do we survive competition? Product design Technological enhancements Key Success Factors: Price Quality products Innovative products
  • 11.
    Financial Performance all figures in millions   2011 2010 2009* 2008 Revenue 1,592.6 1,635.9 1,690.7 1,776.5 Revenue Growth % -2.6% -3.2% -4.8% -1.0% Gross Profit 877.9 885.2 836.4 950.0 Operating Profit 174.7 139.1 (253.2) 128.8
  • 12.
    Financial Performance allfigures in millions   American Greetings Hallmark CSS Industries Current Market Share 36.0% 50.0% < 5%         Sales 1,560.2 4,000.0 440.1 Employees 8,000 13,400 2,000 Market Cap 960.2 N/A 183.6         Profit Margin 5.5% N/A -5.7% Operating Margin 11.0% N/A 2.8% ROA 5.7% N/A 2.1% ROE 11.6% N/A -9.7% Debt/Equity 0.31 N/A 0.16
  • 13.
    Current EVA of American Greetings Equity 748.9 Net Operating Profit 174.7 Debt 232.7 NOPAT 97.5 Risk Free Rate 1% WACC 13.8% Risk Premium 8% Capital Employed 1,189.9 Return on Borrowings 5%     Effective Tax Rate 44.2%     EVA = NOPAT - (WACC*CE) =97.5 - (13.8%*1,189.9) =(66.9 million)
  • 14.
    Current EVA of American Greetings IRR = 2.31% 5.1 4.8 4.5 4.3 (1.3) N/A EVA Increase/Decrease (49.6) (54.7) (59.5) (64.0) (68.2) (66.9) EVA           45.0 Capital Investment 10.6 10.1 9.6 9.2 8.7 N/A OP Increase/Decrease 223.0 212.3 202.2 192.6 183.4 174.7 Net Operating Profit 5 4 3 2 1 0   Year Year Year Year Year Year  
  • 15.
    TOWS Analysis   Opportunities Threats   1. New technology 1. Low barriers to entry   2. Shifting demographic 2. High Competition Strengths     1. Design Capability O1S1 - Create products that can be patented T1S1 - Create difficult to imitate products 2. Analyzing market trends O1S2 - Create valuable product offerings T1S2,T2S1,T2S2 - First mover advantage/patents   O2S1 and O2S2 - Market growth by reaching new customers Weaknesses     1. Brand Recognition O1W1 – Marketing through social media T1W1, T2W1 - Cause based marketing 2. Flat Sales Growth O2W2 – Reach younger demographic T2W2, T1W2 – Related diversification
  • 16.
    Strategy 1- Attracta Younger Demographic Goal: Engage 18-34 year olds Average card buyer is 47 years old Technology has reduced the number of physical greeting cards purchased Send physical cards by way of an online medium Customize cards online, including postage, AG will mail them out Implementation: Create an app for all phones Touch screen electronics Customize with handwritten signature Upload pictures Incorporate audio Valuable and Rare
  • 17.
    Strategy 1 CapitalInvestment Assumptions Software Modifications $2 million Implementation $1 million Marketing $2 million = Total $5 million
  • 18.
    Strategy 1 Operating Profit Assumptions Annual Growth Likely scenario: 2% - Strategy appeals to younger demographic and sales of greeting cards increase Best case scenario: 5% - Creates an easy way to send greeting cards and becomes the new standard in the industry Worst case scenario: 0% - Does not increase amount of greeting cards purchased
  • 19.
    Strategy 1 - Likely IRR = 65.70% 1.3 1.2 1.2 1.2 1.3 N/A EVA Increase/Decrease (60.8) (62.0) (63.3) (64.5) (65.6) (66.9) EVA           5.0 Capital Investment 3.8 3.7 3.6 3.6 3.5 N/A OP Increase/Decrease 192.9 189.1 185.4 181.8 178.2 174.7 Net Operating Profit 5 4 3 2 1 0   Year Year Year Year Year Year  
  • 20.
    Strategy 1 - Best IRR = 178.37% 5.1 4.8 4.5 4.3 4.2 N/A EVA Increase/Decrease (44.0) (49.1) (53.9) (58.4) (62.7) (66.9) EVA           5.0 Capital Investment 10.6 10.1 9.6 9.2 8.7 N/A OP Increase/Decrease 223.0 212.3 202.2 192.6 183.4 174.7 Net Operating Profit 5 4 3 2 1 0   Year Year Year Year Year Year  
  • 21.
    Strategy 1 - Worst IRR = 0% (0.8) (0.8) (0.8) (0.8) (0.7) N/A EVA Increase/Decrease (70.9) (70.1) (69.2) (68.4) (67.6) (66.9) EVA           5.0 Capital Investment - - - - - N/A OP Increase/Decrease 174.7 174.7 174.7 174.7 174.7 174.7 Net Operating Profit 5 4 3 2 1 0   Year Year Year Year Year Year  
  • 22.
    Strategy 2- Strategic Partnership with a Charity Goal: Increase revenues, specifically in greeting cards and small gift products Donate a portion of sales to United Service Organization (USO) Associated with United Way which AG already contributes to Establish a promotional period; beginning in May & ending Labor day Implementation: Showcase the strategic partnership symbol Launch viral video on AG web site, Facebook, Twitter & YouTube Create an in-store display Replace old inventory with promotional stamped cards Overall: Aligns with AG’s core value of a responsible community presence Valuable
  • 23.
    Strategy 2 Capital Investment Assumptions Marketing (in-store) $2.0 million Software Modification $0.1 million =Total $2.1 million
  • 24.
    Strategy 2 OperatingProfit Assumptions Annual Growth Likely scenario: 1% - Increase brand recognition by appealing to those who look for ways to be socially responsible Best case scenario: 3% - Increase brand recognition & sales revenue during and after promotional period Worst case scenario: 0% - Promotion does not affect sales
  • 25.
    Strategy 2 -Likely IRR = 79.5% 0.2 0.2 0.2 0.2 0.7 N/A EVA Increase/Decrease (65.5) (65.7) (65.9) (66.1) (66.2) (66.9) EVA           2.1 Capital Investment 1.8 1.8 1.8 1.8 1.7 N/A OP Increase/Decrease 183.6 181.8 180.0 178.2 176.4 174.7 Net Operating Profit 5 4 3 2 1 0   Year Year Year Year Year Year  
  • 26.
    Strategy 2 -Best IRR = 252.04% 2.5 2.4 2.3 2.2 2.6 N/A EVA Increase/Decrease (55.0) (57.4) (59.8) (62.1) (64.3) (66.9) EVA           2.1 Capital Investment 5.9 5.7 5.6 5.4 5.2 N/A OP Increase/Decrease 202.5 196.6 190.9 185.3 179.9 174.7 Net Operating Profit 5 4 3 2 1 0   Year Year Year Year Year Year  
  • 27.
    Strategy 2 -Worst IRR = 0% (0.8) (0.8) (0.8) (0.8) (0.3) N/A EVA Increase/Decrease (70.5) (69.7) (68.8) (68.0) (67.2) (66.9) EVA           2.1 Capital Investment - - - - - N/A OP Increase/Decrease 174.7 174.7 174.7 174.7 174.7 174.7 Net Operating Profit 5 4 3 2 1 0   Year Year Year Year Year Year  
  • 28.
    Recommendation – Strategy1 Population is aging Consumer trends are reflecting an increased use of technology Long-term benefit Increased application availability
  • 29.

Editor's Notes

  • #3 View earning release of 4-28-11, product leadership strategy based on continuous research; focusing on greeting cards
  • #8 Put this on 1 slide!
  • #10 Distribution channels is a weakness because AG relies heavily on Wal-Mart &amp; Target for over a quarter of their revenue.
  • #12 This first analysis is historic financial data for American greetings. As you can see, since the bad economic conditions in 2009, american greetings has begun to turn things around. Although it appears that their revenue is decreasing, their year over year it is slowly moving in a positive direction. The asterisk in 2009 is to note that operating profit was negatively affected by a 290 million dollar impairment of assets.
  • #13 Here we are comparing american greetings current financial state to it’s competitors. As andy stated earlier, American greetings and Hallmark account for 86% of the market share for greeting cards. This leaves little room for any other major player. Hallmark is private so Profit margin – profit after interest and taxes (net income) compared to sales (how efficiently a company turns revenues into profits ) Operating margin – operating profit compared to sales
  • #14 Capital employed = total assets less current liabilities
  • #15 Assume 5% annual growth rate. Assume 0.5% annual increase in capital employed after the first year Total increase in OP – 48.3M Total EVA over 5 yrs – 17.3M
  • #17 .Technology has affected sales, but not stopped the demand for physical cards. Just as an increase in postage costs &amp; the creation of long distance calling did not stop the demand for physical greeting cards. Apps are a $343 million industry, projected to be a $4.3 billion industry by 2013. An article from 4-26-11, states that 50% of 18-34 yr. olds own a smart phone.
  • #18 Software modification – updating software for app, updating web software and website, and updating software for production Implementation – adjustments to production lines, web support, customer service support Marketing – online through social media and commercial to air during primetime TV
  • #20 Assume 2% annual growth rate. Assume 0.5% annual increase in capital employed after the first year Total increase in OP – 18.2M Total EVA over 5 yrs – 6.1M
  • #21 Assume 5% annual growth rate. Assume 0.5% annual increase in capital employed after the first year Total increase in OP – 48.3M Total EVA over 5 yrs – 22.9M
  • #22 Assume no growth Assume 0.5% annual increase in capital employed after the first year Total increase in OP – 0 Total EVA over 5 yrs – (0.4M)
  • #24 Marketing – viral video, social media, in store displays Software modification – adjustments to production software to print USO logo
  • #26 Assume 1% annual growth rate. Assume 0.5% annual increase in capital employed after the first year Total increase in OP – 8.9M Total EVA over 5 yrs – 1.4M
  • #27 Assume 3% annual growth rate. Assume 0.5% annual increase in capital employed after the first year Total increase in OP – 27.8M Total EVA over 5 yrs – 11.9M
  • #28 Assume no growth Assume 0.5% annual increase in capital employed after the first year Total increase in OP – 0 Total EVA over 5 yrs – (3.6M)
  • #29 Apps are a $343 million industry, projected to be a $4.3 billion industry by 2013. An article from 4-26-11, states that 50% of 18-34 yr. olds own a smart phone.
  • #30 Discuss that apps are growing.