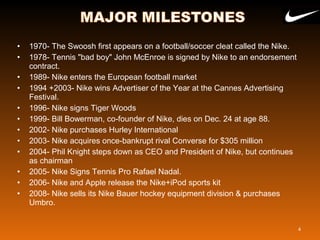
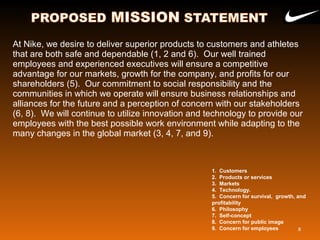
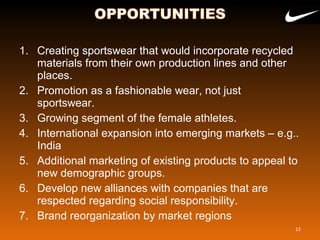
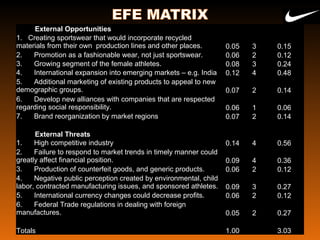
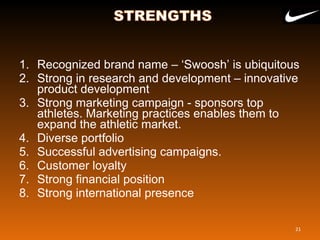
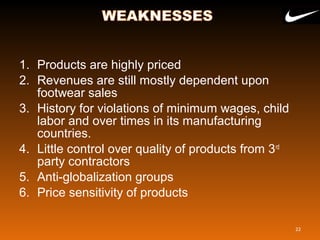
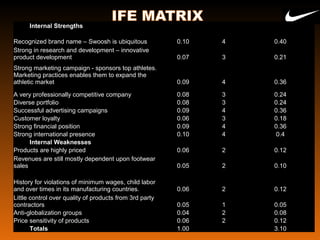
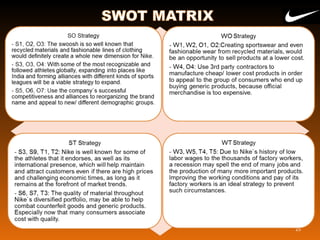
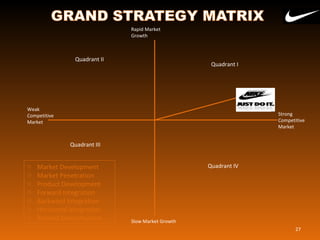
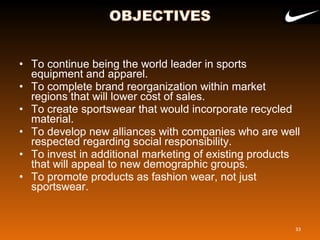
Jarryd Phillips, Jermaine West, Spencer Jacoby, Othniel
Hyliger, Steven Pelletier
Nike, Inc. Strategic Analysis 2009
2
HISTORY
MAJOR MILESTONES
CURRENT VISION & MISSION
STATEMENTS
PROPOSED VISION & MISSION
STATEMENTS
EXTERNAL ASSESSMENT
POSITIONING MAP
CPM MATRIX
OPPORTUNITIES & THREATS
EFE MATRIX
INTERNAL ASSESSMENT
ORGANIZATIONAL CHART
2009 INCOME STATEMENT
2009 BALANCE SHEET
CURRENT FINANCIAL RATIOS
FINANCIAL TRENDS
STRENGTH & WEAKNESSES
IFE MATRIX
STRATEGIC ASSESSMENT
SWOT MATRIX
SPACE MATRIX
GRAND STRATEGY MATRIX
BCG MATRIX
IE MATRIX
MATRIX ANALYSIS
QSPM
RECOMMENDATIONS
OBJECTIVES
STRATEGIC IMPLEMENTATION
PROJECTED INCOME STATEMENT
PROJECTED BALANCE SHEET
PROJECTED FINANCIAL RATIOS
EVALUATION
BALANCED SCORECARD
SOURCES
QUESTIONS
3
• 1970- The Swoosh first appears on a football/soccer cleat called the Nike.
• 1978- Tennis "bad boy" John McEnroe is signed by Nike to an endorsement
contract.
• 1989- Nike enters the European football market
• 1994 +2003- Nike wins Advertiser of the Year at the Cannes Advertising
Festival.
• 1996- Nike signs Tiger Woods
• 1999- Bill Bowerman, co-founder of Nike, dies on Dec. 24 at age 88.
• 2002- Nike purchases Hurley International
• 2003- Nike acquires once-bankrupt rival Converse for $305 million
• 2004- Phil Knight steps down as CEO and President of Nike, but continues
as chairman
• 2005- Nike Signs Tennis Pro Rafael Nadal.
• 2006- Nike and Apple release the Nike+iPod sports kit
• 2008- Nike sells its Nike Bauer hockey equipment division & purchases
Umbro.
4
"To bring inspiration and innovation to every
athlete in the world"
If you have a body, you are an athlete.
5
Nike co-founder Bill Bowerman
To lead in corporate citizenship through
proactive programs that reflect caring for the
world family of Nike, our teammates, our
consumers, and those who provide services
to Nike.
6
To equip every athlete with products that
combine performance, quality, and fashion.
7
At Nike, we desire to deliver superior products to customers and athletes
that are both safe and dependable (1, 2 and 6). Our well trained
employees and experienced executives will ensure a competitive
advantage for our markets, growth for the company, and profits for our
shareholders (5). Our commitment to social responsibility and the
communities in which we operate will ensure business relationships and
alliances for the future and a perception of concern with our stakeholders
(6, 8). We will continue to utilize innovation and technology to provide our
employees with the best possible work environment while adapting to the
many changes in the global market (3, 4, 7, and 9).
8
1. Customers
2. Products or services
3. Markets
4. Technology.
5. Concern for survival, growth, and
profitability
6. Philosophy
7. Self-concept
8. Concern for public image
9. Concern for employees
9
10
High Performance
Low Performance
High PriceLow Price
NIKE ADIDAS PUMA
Critical Success factors Weights Rating
Weighted
Score Rating
Weighted
Score Rating
Weighted
Score
0.0 to 1.0 1 to 4 1 to 4 1 to 4
Advertising 0.10 3 0.30 4 0.40 3 0.20
Product Quality 0.08 4 0.32 3 0.24 2 0.16
Price Competitiveness 0.08 2 0.16 3 0.24 1 0.08
Management 0.06 3 0.18 4 0.24 2 0.12
Financial Position 0.08 4 0.32 3 0.24 1 0.08
Customer Loyalty 0.05 3 0.15 2 0.10 1 0.05
Global Expansion 0.05 3 0.15 4 0.20 2 0.10
Market Share 0.08 4 0.32 2 0.16 1 0.08
Brand 0.09 4 0.36 3 0.27 1 0.09
Endorsement Deals 0.10 4 0.40 3 0.30 3 0.30
Portfolio Diversification 0.08 3 0.24 4 0.32 2 0.16
Product Placement 0.09 3 0.27 2 0.18 1 0.09
Research & Development 0.06 3 0.18 4 0.24 1 0.06
Totals 1.00 3.35 3.13 1.57
11
1. Creating sportswear that would incorporate recycled
materials from their own production lines and other
places.
2. Promotion as a fashionable wear, not just
sportswear.
3. Growing segment of the female athletes.
4. International expansion into emerging markets – e.g..
India
5. Additional marketing of existing products to appeal to
new demographic groups.
6. Develop new alliances with companies that are
respected regarding social responsibility.
7. Brand reorganization by market regions
12
1. High competitive industry
2. Failure to respond to market trends in timely
manner could greatly affect financial position.
3. Production of counterfeit goods, and generic
products.
4. Negative public perception created by
environmental, child labor, contracted
manufacturing issues, and sponsored athletes.
5. International currency changes could decrease
profits.
6. Federal Trade regulations in dealing with foreign
manufactures.
13
14
External Opportunities
1. Creating sportswear that would incorporate recycled
materials from their own production lines and other places. 0.05 3 0.15
2. Promotion as a fashionable wear, not just sportswear. 0.06 2 0.12
3. Growing segment of the female athletes. 0.08 3 0.24
4. International expansion into emerging markets – e.g. India 0.12 4 0.48
5. Additional marketing of existing products to appeal to new
demographic groups. 0.07 2 0.14
6. Develop new alliances with companies that are respected
regarding social responsibility. 0.06 1 0.06
7. Brand reorganization by market regions 0.07 2 0.14
External Threats
1. High competitive industry 0.14 4 0.56
2. Failure to respond to market trends in timely manner could
greatly affect financial position. 0.09 4 0.36
3. Production of counterfeit goods, and generic products. 0.06 2 0.12
4. Negative public perception created by environmental, child
labor, contracted manufacturing issues, and sponsored athletes. 0.09 3 0.27
5. International currency changes could decrease profits. 0.06 2 0.12
6. Federal Trade regulations in dealing with foreign
manufactures. 0.05 2 0.27
Totals 1.00 3.03
15
16
Year Ended May 31
(In millions, except per share data) 2009 2008 2007
Revenues $ 19,176.10 $ 18,627.0 $ 16,325.9
Cost of sales $ 10,571.70 $ 10,239.6 $ 9,165.4
Gross margin $ 8,604.40 $ 8,387.4 $ 7,160.5
Selling and administrative expense $ 6,149.60 $ 5,953.7 $ 5,028.7
Restructuring charges (Note 16) $ 195.00 $ - $ -
Goodwill impairment (Note 4) $ 199.30 $ - $ -
Intangible and other asset impairment (Note 4) $ 202.00 $ - $ -
Interest income, net (Notes 1, 7 and 8) $ (9.50) $ (77.1) $ (67.2)
Other (income) expense, net (Notes 17 and 18) $ (88.50) $ 7.9 $ (0.9)
Income before income taxes $ 1,956.50 $ 2,502.9 $ 2,199.9
Income taxes (Note 9) $ 469.80 $ 619.5 $ 708.4
Net income $ 1,486.70 $ 1,883.4 $ 1,491.5
Basic earnings per common share (Note 12) $ 3.07 $ 3.80 $ 2.96
Diluted earnings per common share (Note 12) $ 3.03 $ 3.74 $ 2.93
Dividends declared per common share $ 0.98 $ 0.875 $ 0.71
17
18
May 31,
2009 2008
(In millions)
ASSETS
Current assets:
Cash and equivalents $ 2,291.10 $ 2,133.90
Short-term investments $ 1,164.00 $ 642.20
Accounts receivable, net (Note 1) $ 2,883.90 $ 2,795.30
Inventories (Notes 1 and 2) $ 2,357.00 $ 2,438.40
Deferred income taxes (Note 9) $ 272.40 $ 227.20
Prepaid expenses and other current assets $ 765.60 $ 602.30
Total current assets $ 9,734.00 $ 8,839.30
Property, plant and equipment, net (Note 3) $ 1,957.70 $ 1,891.10
Identifiable intangible assets, net (Note 4) $ 467.40 $ 743.10
Goodwill (Note 4) $ 193.50 $ 448.80
Deferred income taxes and other assets (Notes 9 and 18) $ 897.00 $ 520.40
Total assets $ 13,249.60 $ 12,442.70
LIABILITIES AND SHAREHOLDERS’ EQUITY
Current liabilities:
Current portion of long-term debt (Note 8) $ 32.00 $ 6.30
Notes payable (Note 7) $ 342.90 $ 177.70
Accounts payable (Note 7) $ 1,031.90 $ 1,287.60
Accrued liabilities (Notes 5 and 18) $ 1,783.90 $ 1,761.90
Income taxes payable (Note 9) $ 86.30 $ 88.00
Total current liabilities $ 3,277.00 $ 3,321.50
Long-term debt (Note 8) $ 437.20 $ 441.10
Deferred income taxes and other liabilities (Note 9) $ 842.00 $ 854.50
Commitments and contingencies (Notes 15 and 18) $ - $ -
Redeemable Preferred Stock (Note 10) $ 0.3 $ 0.3
Shareholders’ equity:
Common stock at stated value (Note 11):
Class A convertible — 95.3 and 96.8 shares outstanding $ 0.1 $ 0.1
Class B— 390.2 and 394.3 shares outstanding $ 2.7 $ 2.7
Capital in excess of stated value $ 2,871.40 $ 2,497.80
Accumulated other comprehensive income (Note 14) $ 367.50 $ 251.40
Retained earnings $ 5,451.40 $ 5,073.30
Total shareholders’ equity 8693.1 7825.3
Liquidity Ratios
Current 2.97
Quick 2.25
Leverage Ratios
Debt to total assets 0.06
Debt to equity 0.09
Long-term debt to equity 0.05
Times-interest-earned ratio 61.06
Activity Ratios
Fixed Assets Turnover 9.8
Total Assets Turnover 1.45
Inventory Turnover 8.14
Profitability Ratios
Gross profit margin 0.45
Operating profit margin 0.13
Net profit margin 0.08
Return on assets 0.11
Return on equity 0.17
Price-earnings ratio 18.83
EPS 3.03
Growth Ratios 3 Years
Sales Growth% 0.28226
Net Income Growth% 0.06803
Earnings per share Growth% -0.4261
Dividends per share Growth% -0.1695
19
Date Sales EBIT DEPRECIATION TOTAL NET INCOME LONG TERM DEBT
May-09 19.18 Bill 1.96 Bill 347.00 Mill 1.49 Bill 437.20 Mill
May-08 18.63 Bill 2.50 Bill 312.80 Mill 1.88 Bill 441.10 Mill
May-07 16.33 Bill 2.20 Bill 279.60 Mill 1.49 Bill 409.90 Mill
May-06 14.95 Bill 2.14 Bill 291.80 Mill 1.39 Bill 410.70 Mill
May-05 13.74 Bill 1.86 Bill 266.50 Mill 1.21 Bill 687.30 Mill
20
1. Recognized brand name – ‘Swoosh’ is ubiquitous
2. Strong in research and development – innovative
product development
3. Strong marketing campaign - sponsors top
athletes. Marketing practices enables them to
expand the athletic market.
4. Diverse portfolio
5. Successful advertising campaigns.
6. Customer loyalty
7. Strong financial position
8. Strong international presence
21
1. Products are highly priced
2. Revenues are still mostly dependent upon
footwear sales
3. History for violations of minimum wages, child
labor and over times in its manufacturing
countries.
4. Little control over quality of products from 3rd
party contractors
5. Anti-globalization groups
6. Price sensitivity of products
22
23
Internal Strengths      
Recognized brand name – Swoosh is ubiquitous 0.10 4 0.40
Strong in research and development – innovative 
product development    0.07 3 0.21
Strong marketing campaign - sponsors top athletes. 
Marketing practices enables them to expand the 
athletic market 0.09 4 0.36
A very professionally competitive company  0.08 3 0.24
Diverse portfolio  0.08 3 0.24
Successful advertising campaigns 0.09 4 0.36
Customer loyalty 0.06 3 0.18
Strong financial position 0.09 4 0.36
Strong international presence     0.10 4 0.4
Internal Weaknesses      
Products are highly priced 0.06 2 0.12
Revenues are still mostly dependent upon footwear 
sales 0.05 2 0.10
History for violations of minimum wages, child labor 
and over times in its manufacturing countries. 0.06 2 0.12
Little control over quality of products from 3rd party 
contractors 0.05 1 0.05
Anti-globalization groups 0.04 2 0.08
Price sensitivity of products 0.06 2 0.12
Totals 1.00   3.10
24
25
26
Financial Strength rating is 1 (worst) to 6 (best) Ratings
1 Liquidity  6.0
2 Leverage  6.0
3 Working capital  6.0
4 Return on assets  4.0
5 Return on equity  4.0
6 Price per earnings  6.0
7 Earnings per share  5.0
Industry Strength  rating is 1 (worst) to 6 (best) FS Total 37.0
1 Profit potential  6.0
2 Extent Leveraged  5.0
3 Economies of scale  5.0
4 Growth potential  5.0
5 Financial stability  6.0
6 Resource utilization  5.0
7 Diverse Portfolio  5.0
Environmental Stability rating is -1 (best) to -6 (worst) IS Total 37.0
1 Price range of competing products  -2.0
2 Competitive pressure  -2.0
3 Ease of exit from market  -1.0
4 Successful and recognized advertising   -1.0
5 Endorsement agreements  -1.0
6 Price elasticity of demand  -1.0
7 Risk involved in business  -1.0
Competitive advantage rating is -1 (best) to -6 (worst) ES Total -9.0
1 Market share  -1.0
2 Global presence  -1.0
3 Strong investor reputation  -1.0
4 Technological innovation  -1.0
5 Product life cycle   -2.0
6 Customer loyalty  -1.0
7 Control over suppliers and distributors  -3.0
CS total  -10.0
ES average  -1.29
CA average -1.43
IS average 5.29
FS average 5.29
X Coordinate 3.86
Y Coordinate 4.00
Strategy ->>>> Aggressive
27
Rapid Market
Growth
Slow Market Growth
Weak
Competitive
Market
Strong
Competitive
Market
Quadrant II
Quadrant III
Quadrant I
Quadrant IVo Market Development
o Market Penetration
o Product Development
o Forward Integration
o Backward Integration
o Horizontal Integration
o Related Diversification
Divisions Revenue % Revenue Profits % Profits RMSP IG Rate%
(1) U.S. 6,542.9 39% 837.2 35% 1 1.20%
(2) AMEA 5,512.2 33% 877.1 37% 1 -2.20%
(3) Asia Pacific 3,322.0 20% 394.6 17% 1 2.70%
(4) Americas 1,284.7 8% 263.6 11% 1 1.20%
Total 16,661.8 100% 2,372.5 100%
28
1.0 0.9 0.8 0.7 0.6 0.5 0.4 0.3 0.2 0.1 0 LowHigh
+25
0
+5
+15
+20
-25
-20
-15
-5
Low
IGR
Stars Question Marks
Cash Cow Dogs
(2) 37%
(1) 35%
(3) 17%
(4) 11%
III
III IV
29
High 3-4
Medium 2-2.99
Low 1-1.99
Strong 3-4 Average 2-2.99 Weak 1-1.99
E
F
E
I F E
Alternative Strategies IE SPACE GRAND BCG Count
Forward Integration x x x x 4
Backward Integration x x x x 4
Horizontal Integration x x x x 4
Market Penetration x x x x 4
Market Development x x x x 4
Product Development x x x x 4
Related Diversification x x 2
Unrelated Diversification x 1
Horizontal Diversification
Joint Venture
Retrenchment x 1
Divestiture x 1
Liquidation x 1
30
31
Market Expansion Prod/Recycle/Materials Add. Sports Accessories
Key factors Weight AS TAS AS TAS AS TAS
External 1 to 4 1 to 4 1 to 4
Create products from recycled materials 0.1 3 0.3 2 0.2 4 0.4
Promotion as a fashionable wear, not just sportswear. 0.07 3 0.21 1 0.07 2 0.14
Growing segment of the female athletes 0.08 - - - - - -
International expansion into emerging markets - India 0.12 4 0.48 2 0.24 1 0.12
Add. marketing of existing prod - appeal to new groups 0.1 3 0.3 2 0.2 4 0.4
New alliances with co. respected for social responsibility 0.06 3 0.18 2 0.12 1 0.06
Brand reorganization by market regions 0.06 4 0.24 1 0.06 2 0.12
High competitive industry 0.08 4 0.32 3 0.24 2 0.16
Failure to respond to market trends in timely manner 0.06 - - - - - -
Negative public perception 0.06 - - - - - -
Federal Trade regulations with foreign manufactures 0.08 4 0.32 3 0.32 2 0.16
International currency changes could decrease profits 0.07 2 0.14 4 0.32 3 0.21
Production of counterfeit goods, and generic products 0.06 3 0.18 2 0.12 1 0.06
total should be 1.0 1
Internal 1 to 4 1 to 4 1 to 4
Recognized brand name – Swoosh is ubiquitous 0.1 4 0.4 3 0.3 2 0.2
Strong in research and development/innovation 0.09 4 0.36 2 0.18 3 0.27
Strong marketing campaign/sponsors top athletes 0.08 2 0.16 1 0.08 3 0.24
Diverse portfolio 0.09 1 0.09 3 0.27 2 0.18
Successful advertising campaigns 0.07 1 0.07 2 0.14 3 0.21
Customer loyalty 0.07 3 0.21 2 0.14 1 0.07
Strong financial position 0.08 2 0.16 3 0.24 4 0.32
Strong international presence 0.08 4 0.32 3 0.24 1 0.08
Products are highly priced 0.06 1 0.06 2 0.12 3 0.18
Revenues still mostly dependent upon footwear sales 0.05 3 0.15 2 0.1 1 0.05
Violations for wages and child labor in manuf. countries 0.06 - - - - - -
Little control over quality of prod. from 3rd party contract. 0.06 2 0.12 3 0.18 1 0.06
Anti-globalization groups 0.05 - - - - - -
Price sensitivity of products 0.06 3 0.18 2 0.12 1 0.06
total should be 1.0 1 0
4.95 4 3.75
32
• To continue being the world leader in sports 
equipment and apparel.
• To complete brand reorganization within market 
regions that will lower cost of sales. 
• To create sportswear that would incorporate recycled 
material.
• To develop new alliances with companies who are well 
respected regarding social responsibility.
• To invest in additional marketing of existing products 
that will appeal to new demographic groups.
• To promote products as fashion wear, not just 
sportswear.
33
34
35
Year Ended May 31 Projected
2009 2010
(In millions, except per share data)
Revenues $ 19,176.10 $ 19,463.74
Forecasted 1.5%
revenue increase.
Cost of sales $ 10,571.70 $ 10,730.28 1.5% increase.
Gross margin $ 8,604.40 $ 8,733.47
Selling and administrative expense $ 6,149.60 $ 6,351.95
3.3% increase
from previous
year.
Restructuring charges (Note 16) $ 195.00 $ -
Goodwill impairment (Note 4) $ 199.30 $ 50.00
Intangible and other asset impairment (Note 4) $ 202.00 $ -
Interest income, net (Notes 1, 7 and 8) $ (9.50) $ (9.50)
Other (income) expense, net (Notes 17 and 18) $ (88.50) $ (88.50)
Income before income taxes $ 1,956.50 $ 2,429.52
Income taxes (Note 9) $ 469.80 $ 583.08
Based on 24%
from 2009
Net income $ 1,486.70 $ 1,846.43
Basic earnings per common share (Note 12) $ 3.07 $ 3.20
Diluted earnings per common share (Note 12) $ 3.03 $ 3.16
Dividends declared per common share $ 0.98 $ 1.00
36
Year Ended May 31, Projected
2009 2010
ASSETS
Current assets:
Cash and equivalents $ 2,291.10 $ 2,163.80 Minus $161.67 in investment.
Short-term investments $ 1,164.00 $ 1,164.00
Accounts receivable, net (Note 1) $ 2,883.90 $ 2,976.18 3.2% previous
Inventories (Notes 1 and 2) $ 2,357.00 $ 2,628.00 Influenced by the cricket line
Deferred income taxes (Note 9) $ 272.40 $ 272.40
Prepaid expenses and other current assets $ 765.60 $ 900.00
Total current assets $ 9,734.00 $ 10,104.38
Property, plant and equipment, net (Note 3) $ 1,957.70 $ 1,972.70 Plus $15 million for three new stores.
Identifiable intangible assets, net (Note 4) $ 467.40 $ 467.40
Goodwill (Note 4) $ 193.50 $ 95.00
Deferred income taxes and other assets (Notes 9 and 18) $ 897.00 $ 977.56
Total assets $ 13,249.60 $ 13,617.04
LIABILITIES AND SHAREHOLDERS’ EQUITY
Current liabilities:
Current portion of long-term debt (Note 8) $ 32.00 $ 6.90
Notes payable (Note 7) $ 342.90 $ 375.00
Accounts payable (Note 7) $ 1,031.90 $ 1,051.50
Accrued liabilities (Notes 5 and 18) $ 1,783.90 $ 1,783.90
Income taxes payable (Note 9) $ 86.30 $ 90.00
Total current liabilities $ 3,277.00 $ 3,307.30
Long-term debt (Note 8) $ 437.20 $ 405.20 Less portion of $32.0
Deferred income taxes and other liabilities (Note 9) $ 842.00 $ 872.71
Commitments and contingencies (Notes 15 and 18) $ -
Redeemable Preferred Stock (Note 10) $ 0.30 $ 0.30
Shareholders’ equity:
Common stock at stated value (Note 11):
Class A convertible — 95.3 and 96.8 shares outstanding $ 0.10 $ 0.10
Class B— 390.2 and 394.3 shares outstanding $ 2.70 $ 2.70
Capital in excess of stated value $ 2,871.40 $ 2,995.40
Accumulated other comprehensive income (Note 14) $ 367.50 $ 367.50
Retained earnings $ 5,451.40 $ 5,665.83
Total shareholders’ equity $ 8,693.10 $ 9,031.53
Total liabilities and shareholders’ equity $ 13,249.60 $ 13,617.04
2009 Projected 2010
Liquidity Ratios
Current 2.97 3.06
Quick 2.25 2.26
Leverage Ratios
Debt to total assets 0.06 0.06
Debt to equity 0.09 0.09
Long-term debt to equity 0.05 0.04
Times-interest-earned ratio 48.55 65.66
Activity Ratios
Fixed Assets Turnover 9.8 9.87
Total Assets Turnover 1.45 1.43
Inventory Turnover 8.14 7.41
Profitability Ratios
Gross profit margin 0.45 0.45
Operating profit margin 0.1 0.12
Net profit margin 0.08 0.09
Return on assets 0.11 0.14
Return on equity 0.17 0.20
Price-earnings ratio 18.83 17.83
EPS 3.03 3.20
Growth Ratios 3 Years 1 Year
Sales Growth% 0.28226 1.50
Net Income Growth% 0.06803 24.20
Earnings per share Growth% -0.4261 4.23
Dividends per share Growth% -0.1695 2.04
37
38
39
Area of Objectives Measure Time Expectation Primary Responsibility
Customers      
1. Customer satisfaction Customer and online surveys Quarterly Managers/ Marketing
2. Customer Loyalty Product and purchasing reviews. 
Memberships and number of returning and 
new customers.
Quarterly Marketing
3. Accessibility Open more stores in various countries. Biannually- Annually Marketing
Managers/Employees      
1. Improve working conditions Increase in productivity, employee surveys. Quarterly CEO
2. Improve employee training Increase in productivity and overall operating 
efficiency
Quarterly Human Resources
Community/Social Responsibility      
1. Business Ethics Endorse positive role model athlete`s.  
Increase promotion of sports and wellness.
Annually CEO
2. Environmentally Friendly Recycle materials, improve reputation and 
customer perspective.
Biannually CEO
3. Community involvement Run local sports camps, community/ city 
events- increase customer awareness.
Biannually Regional Managers
Operations/ Processes      
1. Improve Brand Image Increase in sales and customer 
recommendations.
Quarterly CEO
2. Product Innovation Number of new stores, products and 
marketing
Quarterly CEO/ Marketing
3. Market Penetration Number of stores and sales in new/ other 
countries
Annually Marketing
Financial      
1. Reduce Cost of production Decrease in production expenses. Annually CFO
2. Increase Revenue Increase in annual sales Annually CFO
• http://www.youtube.com/watch?v=4Uugz5Y7u6M
40
• http://investors.nikeinc.com/Investors/Financial-Reports-and-Filings/Annual-Reports/default.aspx
• http://investors.nikeinc.com/Theme/Nike/files/doc_financials/AnnualReports/2009/docs/Nike_2009_10-K.p
• http://investors.nikeinc.com/Theme/Nike/files/doc_financials/AnnualReports/2006/docs/10k.pdf
• http://
investing.businessweek.com/research/stocks/financials/financials.asp?ticker=NKE:US&dataset=incomeS
• http://finance.yahoo.com/q/is?s=NKE+Income+Statement&annual
• http://www.nike.com/nikeos/p/nike/en_US/?&ref
• Datamonitor.com – UMFK library sites
• http://en.wikipedia.org/wiki/List_of_most_populous_cities_in_India
• www.yahoofinance.com
• https://materials.proxyvote.com/Approved/654106/20090724/AR_44240/HTML2/default.htm
• http://en.wikipedia.org/wiki/Nike_timeline
• http://nikeinc.com/pages/history-heritage
• http://investing.money.msn.com/investments/financial-statements?symbol=NKE 
• http://www.nike.com/nikeos/p/nike/en_IN/store_locator 
• Strategic Management Concepts and Cases 13th
 Edition. Fred R. David.
41
42

Nike pp final

  • 1.
    Jarryd Phillips, JermaineWest, Spencer Jacoby, Othniel Hyliger, Steven Pelletier Nike, Inc. Strategic Analysis 2009
  • 2.
    2 HISTORY MAJOR MILESTONES CURRENT VISION& MISSION STATEMENTS PROPOSED VISION & MISSION STATEMENTS EXTERNAL ASSESSMENT POSITIONING MAP CPM MATRIX OPPORTUNITIES & THREATS EFE MATRIX INTERNAL ASSESSMENT ORGANIZATIONAL CHART 2009 INCOME STATEMENT 2009 BALANCE SHEET CURRENT FINANCIAL RATIOS FINANCIAL TRENDS STRENGTH & WEAKNESSES IFE MATRIX STRATEGIC ASSESSMENT SWOT MATRIX SPACE MATRIX GRAND STRATEGY MATRIX BCG MATRIX IE MATRIX MATRIX ANALYSIS QSPM RECOMMENDATIONS OBJECTIVES STRATEGIC IMPLEMENTATION PROJECTED INCOME STATEMENT PROJECTED BALANCE SHEET PROJECTED FINANCIAL RATIOS EVALUATION BALANCED SCORECARD SOURCES QUESTIONS
  • 3.
  • 4.
    • 1970- TheSwoosh first appears on a football/soccer cleat called the Nike. • 1978- Tennis "bad boy" John McEnroe is signed by Nike to an endorsement contract. • 1989- Nike enters the European football market • 1994 +2003- Nike wins Advertiser of the Year at the Cannes Advertising Festival. • 1996- Nike signs Tiger Woods • 1999- Bill Bowerman, co-founder of Nike, dies on Dec. 24 at age 88. • 2002- Nike purchases Hurley International • 2003- Nike acquires once-bankrupt rival Converse for $305 million • 2004- Phil Knight steps down as CEO and President of Nike, but continues as chairman • 2005- Nike Signs Tennis Pro Rafael Nadal. • 2006- Nike and Apple release the Nike+iPod sports kit • 2008- Nike sells its Nike Bauer hockey equipment division & purchases Umbro. 4
  • 5.
    "To bring inspirationand innovation to every athlete in the world" If you have a body, you are an athlete. 5 Nike co-founder Bill Bowerman
  • 6.
    To lead incorporate citizenship through proactive programs that reflect caring for the world family of Nike, our teammates, our consumers, and those who provide services to Nike. 6
  • 7.
    To equip everyathlete with products that combine performance, quality, and fashion. 7
  • 8.
    At Nike, wedesire to deliver superior products to customers and athletes that are both safe and dependable (1, 2 and 6). Our well trained employees and experienced executives will ensure a competitive advantage for our markets, growth for the company, and profits for our shareholders (5). Our commitment to social responsibility and the communities in which we operate will ensure business relationships and alliances for the future and a perception of concern with our stakeholders (6, 8). We will continue to utilize innovation and technology to provide our employees with the best possible work environment while adapting to the many changes in the global market (3, 4, 7, and 9). 8 1. Customers 2. Products or services 3. Markets 4. Technology. 5. Concern for survival, growth, and profitability 6. Philosophy 7. Self-concept 8. Concern for public image 9. Concern for employees
  • 9.
  • 10.
  • 11.
    NIKE ADIDAS PUMA CriticalSuccess factors Weights Rating Weighted Score Rating Weighted Score Rating Weighted Score 0.0 to 1.0 1 to 4 1 to 4 1 to 4 Advertising 0.10 3 0.30 4 0.40 3 0.20 Product Quality 0.08 4 0.32 3 0.24 2 0.16 Price Competitiveness 0.08 2 0.16 3 0.24 1 0.08 Management 0.06 3 0.18 4 0.24 2 0.12 Financial Position 0.08 4 0.32 3 0.24 1 0.08 Customer Loyalty 0.05 3 0.15 2 0.10 1 0.05 Global Expansion 0.05 3 0.15 4 0.20 2 0.10 Market Share 0.08 4 0.32 2 0.16 1 0.08 Brand 0.09 4 0.36 3 0.27 1 0.09 Endorsement Deals 0.10 4 0.40 3 0.30 3 0.30 Portfolio Diversification 0.08 3 0.24 4 0.32 2 0.16 Product Placement 0.09 3 0.27 2 0.18 1 0.09 Research & Development 0.06 3 0.18 4 0.24 1 0.06 Totals 1.00 3.35 3.13 1.57 11
  • 12.
    1. Creating sportswearthat would incorporate recycled materials from their own production lines and other places. 2. Promotion as a fashionable wear, not just sportswear. 3. Growing segment of the female athletes. 4. International expansion into emerging markets – e.g.. India 5. Additional marketing of existing products to appeal to new demographic groups. 6. Develop new alliances with companies that are respected regarding social responsibility. 7. Brand reorganization by market regions 12
  • 13.
    1. High competitiveindustry 2. Failure to respond to market trends in timely manner could greatly affect financial position. 3. Production of counterfeit goods, and generic products. 4. Negative public perception created by environmental, child labor, contracted manufacturing issues, and sponsored athletes. 5. International currency changes could decrease profits. 6. Federal Trade regulations in dealing with foreign manufactures. 13
  • 14.
    14 External Opportunities 1. Creatingsportswear that would incorporate recycled materials from their own production lines and other places. 0.05 3 0.15 2. Promotion as a fashionable wear, not just sportswear. 0.06 2 0.12 3. Growing segment of the female athletes. 0.08 3 0.24 4. International expansion into emerging markets – e.g. India 0.12 4 0.48 5. Additional marketing of existing products to appeal to new demographic groups. 0.07 2 0.14 6. Develop new alliances with companies that are respected regarding social responsibility. 0.06 1 0.06 7. Brand reorganization by market regions 0.07 2 0.14 External Threats 1. High competitive industry 0.14 4 0.56 2. Failure to respond to market trends in timely manner could greatly affect financial position. 0.09 4 0.36 3. Production of counterfeit goods, and generic products. 0.06 2 0.12 4. Negative public perception created by environmental, child labor, contracted manufacturing issues, and sponsored athletes. 0.09 3 0.27 5. International currency changes could decrease profits. 0.06 2 0.12 6. Federal Trade regulations in dealing with foreign manufactures. 0.05 2 0.27 Totals 1.00 3.03
  • 15.
  • 16.
  • 17.
    Year Ended May31 (In millions, except per share data) 2009 2008 2007 Revenues $ 19,176.10 $ 18,627.0 $ 16,325.9 Cost of sales $ 10,571.70 $ 10,239.6 $ 9,165.4 Gross margin $ 8,604.40 $ 8,387.4 $ 7,160.5 Selling and administrative expense $ 6,149.60 $ 5,953.7 $ 5,028.7 Restructuring charges (Note 16) $ 195.00 $ - $ - Goodwill impairment (Note 4) $ 199.30 $ - $ - Intangible and other asset impairment (Note 4) $ 202.00 $ - $ - Interest income, net (Notes 1, 7 and 8) $ (9.50) $ (77.1) $ (67.2) Other (income) expense, net (Notes 17 and 18) $ (88.50) $ 7.9 $ (0.9) Income before income taxes $ 1,956.50 $ 2,502.9 $ 2,199.9 Income taxes (Note 9) $ 469.80 $ 619.5 $ 708.4 Net income $ 1,486.70 $ 1,883.4 $ 1,491.5 Basic earnings per common share (Note 12) $ 3.07 $ 3.80 $ 2.96 Diluted earnings per common share (Note 12) $ 3.03 $ 3.74 $ 2.93 Dividends declared per common share $ 0.98 $ 0.875 $ 0.71 17
  • 18.
    18 May 31, 2009 2008 (Inmillions) ASSETS Current assets: Cash and equivalents $ 2,291.10 $ 2,133.90 Short-term investments $ 1,164.00 $ 642.20 Accounts receivable, net (Note 1) $ 2,883.90 $ 2,795.30 Inventories (Notes 1 and 2) $ 2,357.00 $ 2,438.40 Deferred income taxes (Note 9) $ 272.40 $ 227.20 Prepaid expenses and other current assets $ 765.60 $ 602.30 Total current assets $ 9,734.00 $ 8,839.30 Property, plant and equipment, net (Note 3) $ 1,957.70 $ 1,891.10 Identifiable intangible assets, net (Note 4) $ 467.40 $ 743.10 Goodwill (Note 4) $ 193.50 $ 448.80 Deferred income taxes and other assets (Notes 9 and 18) $ 897.00 $ 520.40 Total assets $ 13,249.60 $ 12,442.70 LIABILITIES AND SHAREHOLDERS’ EQUITY Current liabilities: Current portion of long-term debt (Note 8) $ 32.00 $ 6.30 Notes payable (Note 7) $ 342.90 $ 177.70 Accounts payable (Note 7) $ 1,031.90 $ 1,287.60 Accrued liabilities (Notes 5 and 18) $ 1,783.90 $ 1,761.90 Income taxes payable (Note 9) $ 86.30 $ 88.00 Total current liabilities $ 3,277.00 $ 3,321.50 Long-term debt (Note 8) $ 437.20 $ 441.10 Deferred income taxes and other liabilities (Note 9) $ 842.00 $ 854.50 Commitments and contingencies (Notes 15 and 18) $ - $ - Redeemable Preferred Stock (Note 10) $ 0.3 $ 0.3 Shareholders’ equity: Common stock at stated value (Note 11): Class A convertible — 95.3 and 96.8 shares outstanding $ 0.1 $ 0.1 Class B— 390.2 and 394.3 shares outstanding $ 2.7 $ 2.7 Capital in excess of stated value $ 2,871.40 $ 2,497.80 Accumulated other comprehensive income (Note 14) $ 367.50 $ 251.40 Retained earnings $ 5,451.40 $ 5,073.30 Total shareholders’ equity 8693.1 7825.3
  • 19.
    Liquidity Ratios Current 2.97 Quick2.25 Leverage Ratios Debt to total assets 0.06 Debt to equity 0.09 Long-term debt to equity 0.05 Times-interest-earned ratio 61.06 Activity Ratios Fixed Assets Turnover 9.8 Total Assets Turnover 1.45 Inventory Turnover 8.14 Profitability Ratios Gross profit margin 0.45 Operating profit margin 0.13 Net profit margin 0.08 Return on assets 0.11 Return on equity 0.17 Price-earnings ratio 18.83 EPS 3.03 Growth Ratios 3 Years Sales Growth% 0.28226 Net Income Growth% 0.06803 Earnings per share Growth% -0.4261 Dividends per share Growth% -0.1695 19
  • 20.
    Date Sales EBITDEPRECIATION TOTAL NET INCOME LONG TERM DEBT May-09 19.18 Bill 1.96 Bill 347.00 Mill 1.49 Bill 437.20 Mill May-08 18.63 Bill 2.50 Bill 312.80 Mill 1.88 Bill 441.10 Mill May-07 16.33 Bill 2.20 Bill 279.60 Mill 1.49 Bill 409.90 Mill May-06 14.95 Bill 2.14 Bill 291.80 Mill 1.39 Bill 410.70 Mill May-05 13.74 Bill 1.86 Bill 266.50 Mill 1.21 Bill 687.30 Mill 20
  • 21.
    1. Recognized brandname – ‘Swoosh’ is ubiquitous 2. Strong in research and development – innovative product development 3. Strong marketing campaign - sponsors top athletes. Marketing practices enables them to expand the athletic market. 4. Diverse portfolio 5. Successful advertising campaigns. 6. Customer loyalty 7. Strong financial position 8. Strong international presence 21
  • 22.
    1. Products arehighly priced 2. Revenues are still mostly dependent upon footwear sales 3. History for violations of minimum wages, child labor and over times in its manufacturing countries. 4. Little control over quality of products from 3rd party contractors 5. Anti-globalization groups 6. Price sensitivity of products 22
  • 23.
    23 Internal Strengths      Recognized brand name – Swoosh is ubiquitous 0.10 4 0.40 Strong in research and development – innovative  product development    0.07 3 0.21 Strong marketing campaign - sponsors top athletes.  Marketing practices enables them to expand the  athletic market 0.09 4 0.36 A very professionally competitive company  0.08 3 0.24 Diverse portfolio  0.08 3 0.24 Successful advertising campaigns 0.09 4 0.36 Customer loyalty 0.06 3 0.18 Strong financial position 0.09 4 0.36 Strong international presence     0.10 4 0.4 Internal Weaknesses       Products are highly priced 0.06 2 0.12 Revenues are still mostly dependent upon footwear  sales 0.05 2 0.10 History for violations of minimum wages, child labor  and over times in its manufacturing countries. 0.06 2 0.12 Little control over quality of products from 3rd party  contractors 0.05 1 0.05 Anti-globalization groups 0.04 2 0.08 Price sensitivity of products 0.06 2 0.12 Totals 1.00   3.10
  • 24.
  • 25.
  • 26.
    26 Financial Strength rating is 1 (worst) to 6 (best)Ratings 1 Liquidity  6.0 2 Leverage  6.0 3 Working capital  6.0 4 Return on assets  4.0 5 Return on equity  4.0 6 Price per earnings  6.0 7 Earnings per share  5.0 Industry Strength  rating is 1 (worst) to 6 (best) FS Total 37.0 1 Profit potential  6.0 2 Extent Leveraged  5.0 3 Economies of scale  5.0 4 Growth potential  5.0 5 Financial stability  6.0 6 Resource utilization  5.0 7 Diverse Portfolio  5.0 Environmental Stability rating is -1 (best) to -6 (worst) IS Total 37.0 1 Price range of competing products  -2.0 2 Competitive pressure  -2.0 3 Ease of exit from market  -1.0 4 Successful and recognized advertising   -1.0 5 Endorsement agreements  -1.0 6 Price elasticity of demand  -1.0 7 Risk involved in business  -1.0 Competitive advantage rating is -1 (best) to -6 (worst) ES Total -9.0 1 Market share  -1.0 2 Global presence  -1.0 3 Strong investor reputation  -1.0 4 Technological innovation  -1.0 5 Product life cycle   -2.0 6 Customer loyalty  -1.0 7 Control over suppliers and distributors  -3.0 CS total  -10.0 ES average  -1.29 CA average -1.43 IS average 5.29 FS average 5.29 X Coordinate 3.86 Y Coordinate 4.00 Strategy ->>>> Aggressive
  • 27.
    27 Rapid Market Growth Slow MarketGrowth Weak Competitive Market Strong Competitive Market Quadrant II Quadrant III Quadrant I Quadrant IVo Market Development o Market Penetration o Product Development o Forward Integration o Backward Integration o Horizontal Integration o Related Diversification
  • 28.
    Divisions Revenue %Revenue Profits % Profits RMSP IG Rate% (1) U.S. 6,542.9 39% 837.2 35% 1 1.20% (2) AMEA 5,512.2 33% 877.1 37% 1 -2.20% (3) Asia Pacific 3,322.0 20% 394.6 17% 1 2.70% (4) Americas 1,284.7 8% 263.6 11% 1 1.20% Total 16,661.8 100% 2,372.5 100% 28 1.0 0.9 0.8 0.7 0.6 0.5 0.4 0.3 0.2 0.1 0 LowHigh +25 0 +5 +15 +20 -25 -20 -15 -5 Low IGR Stars Question Marks Cash Cow Dogs (2) 37% (1) 35% (3) 17% (4) 11% III III IV
  • 29.
    29 High 3-4 Medium 2-2.99 Low1-1.99 Strong 3-4 Average 2-2.99 Weak 1-1.99 E F E I F E
  • 30.
    Alternative Strategies IESPACE GRAND BCG Count Forward Integration x x x x 4 Backward Integration x x x x 4 Horizontal Integration x x x x 4 Market Penetration x x x x 4 Market Development x x x x 4 Product Development x x x x 4 Related Diversification x x 2 Unrelated Diversification x 1 Horizontal Diversification Joint Venture Retrenchment x 1 Divestiture x 1 Liquidation x 1 30
  • 31.
    31 Market Expansion Prod/Recycle/MaterialsAdd. Sports Accessories Key factors Weight AS TAS AS TAS AS TAS External 1 to 4 1 to 4 1 to 4 Create products from recycled materials 0.1 3 0.3 2 0.2 4 0.4 Promotion as a fashionable wear, not just sportswear. 0.07 3 0.21 1 0.07 2 0.14 Growing segment of the female athletes 0.08 - - - - - - International expansion into emerging markets - India 0.12 4 0.48 2 0.24 1 0.12 Add. marketing of existing prod - appeal to new groups 0.1 3 0.3 2 0.2 4 0.4 New alliances with co. respected for social responsibility 0.06 3 0.18 2 0.12 1 0.06 Brand reorganization by market regions 0.06 4 0.24 1 0.06 2 0.12 High competitive industry 0.08 4 0.32 3 0.24 2 0.16 Failure to respond to market trends in timely manner 0.06 - - - - - - Negative public perception 0.06 - - - - - - Federal Trade regulations with foreign manufactures 0.08 4 0.32 3 0.32 2 0.16 International currency changes could decrease profits 0.07 2 0.14 4 0.32 3 0.21 Production of counterfeit goods, and generic products 0.06 3 0.18 2 0.12 1 0.06 total should be 1.0 1 Internal 1 to 4 1 to 4 1 to 4 Recognized brand name – Swoosh is ubiquitous 0.1 4 0.4 3 0.3 2 0.2 Strong in research and development/innovation 0.09 4 0.36 2 0.18 3 0.27 Strong marketing campaign/sponsors top athletes 0.08 2 0.16 1 0.08 3 0.24 Diverse portfolio 0.09 1 0.09 3 0.27 2 0.18 Successful advertising campaigns 0.07 1 0.07 2 0.14 3 0.21 Customer loyalty 0.07 3 0.21 2 0.14 1 0.07 Strong financial position 0.08 2 0.16 3 0.24 4 0.32 Strong international presence 0.08 4 0.32 3 0.24 1 0.08 Products are highly priced 0.06 1 0.06 2 0.12 3 0.18 Revenues still mostly dependent upon footwear sales 0.05 3 0.15 2 0.1 1 0.05 Violations for wages and child labor in manuf. countries 0.06 - - - - - - Little control over quality of prod. from 3rd party contract. 0.06 2 0.12 3 0.18 1 0.06 Anti-globalization groups 0.05 - - - - - - Price sensitivity of products 0.06 3 0.18 2 0.12 1 0.06 total should be 1.0 1 0 4.95 4 3.75
  • 32.
  • 33.
    • To continue being the world leader in sports  equipment and apparel. • To complete brand reorganization within market  regions that will lower cost of sales.  •To create sportswear that would incorporate recycled  material. • To develop new alliances with companies who are well  respected regarding social responsibility. • To invest in additional marketing of existing products  that will appeal to new demographic groups. • To promote products as fashion wear, not just  sportswear. 33
  • 34.
  • 35.
    35 Year Ended May31 Projected 2009 2010 (In millions, except per share data) Revenues $ 19,176.10 $ 19,463.74 Forecasted 1.5% revenue increase. Cost of sales $ 10,571.70 $ 10,730.28 1.5% increase. Gross margin $ 8,604.40 $ 8,733.47 Selling and administrative expense $ 6,149.60 $ 6,351.95 3.3% increase from previous year. Restructuring charges (Note 16) $ 195.00 $ - Goodwill impairment (Note 4) $ 199.30 $ 50.00 Intangible and other asset impairment (Note 4) $ 202.00 $ - Interest income, net (Notes 1, 7 and 8) $ (9.50) $ (9.50) Other (income) expense, net (Notes 17 and 18) $ (88.50) $ (88.50) Income before income taxes $ 1,956.50 $ 2,429.52 Income taxes (Note 9) $ 469.80 $ 583.08 Based on 24% from 2009 Net income $ 1,486.70 $ 1,846.43 Basic earnings per common share (Note 12) $ 3.07 $ 3.20 Diluted earnings per common share (Note 12) $ 3.03 $ 3.16 Dividends declared per common share $ 0.98 $ 1.00
  • 36.
    36 Year Ended May31, Projected 2009 2010 ASSETS Current assets: Cash and equivalents $ 2,291.10 $ 2,163.80 Minus $161.67 in investment. Short-term investments $ 1,164.00 $ 1,164.00 Accounts receivable, net (Note 1) $ 2,883.90 $ 2,976.18 3.2% previous Inventories (Notes 1 and 2) $ 2,357.00 $ 2,628.00 Influenced by the cricket line Deferred income taxes (Note 9) $ 272.40 $ 272.40 Prepaid expenses and other current assets $ 765.60 $ 900.00 Total current assets $ 9,734.00 $ 10,104.38 Property, plant and equipment, net (Note 3) $ 1,957.70 $ 1,972.70 Plus $15 million for three new stores. Identifiable intangible assets, net (Note 4) $ 467.40 $ 467.40 Goodwill (Note 4) $ 193.50 $ 95.00 Deferred income taxes and other assets (Notes 9 and 18) $ 897.00 $ 977.56 Total assets $ 13,249.60 $ 13,617.04 LIABILITIES AND SHAREHOLDERS’ EQUITY Current liabilities: Current portion of long-term debt (Note 8) $ 32.00 $ 6.90 Notes payable (Note 7) $ 342.90 $ 375.00 Accounts payable (Note 7) $ 1,031.90 $ 1,051.50 Accrued liabilities (Notes 5 and 18) $ 1,783.90 $ 1,783.90 Income taxes payable (Note 9) $ 86.30 $ 90.00 Total current liabilities $ 3,277.00 $ 3,307.30 Long-term debt (Note 8) $ 437.20 $ 405.20 Less portion of $32.0 Deferred income taxes and other liabilities (Note 9) $ 842.00 $ 872.71 Commitments and contingencies (Notes 15 and 18) $ - Redeemable Preferred Stock (Note 10) $ 0.30 $ 0.30 Shareholders’ equity: Common stock at stated value (Note 11): Class A convertible — 95.3 and 96.8 shares outstanding $ 0.10 $ 0.10 Class B— 390.2 and 394.3 shares outstanding $ 2.70 $ 2.70 Capital in excess of stated value $ 2,871.40 $ 2,995.40 Accumulated other comprehensive income (Note 14) $ 367.50 $ 367.50 Retained earnings $ 5,451.40 $ 5,665.83 Total shareholders’ equity $ 8,693.10 $ 9,031.53 Total liabilities and shareholders’ equity $ 13,249.60 $ 13,617.04
  • 37.
    2009 Projected 2010 LiquidityRatios Current 2.97 3.06 Quick 2.25 2.26 Leverage Ratios Debt to total assets 0.06 0.06 Debt to equity 0.09 0.09 Long-term debt to equity 0.05 0.04 Times-interest-earned ratio 48.55 65.66 Activity Ratios Fixed Assets Turnover 9.8 9.87 Total Assets Turnover 1.45 1.43 Inventory Turnover 8.14 7.41 Profitability Ratios Gross profit margin 0.45 0.45 Operating profit margin 0.1 0.12 Net profit margin 0.08 0.09 Return on assets 0.11 0.14 Return on equity 0.17 0.20 Price-earnings ratio 18.83 17.83 EPS 3.03 3.20 Growth Ratios 3 Years 1 Year Sales Growth% 0.28226 1.50 Net Income Growth% 0.06803 24.20 Earnings per share Growth% -0.4261 4.23 Dividends per share Growth% -0.1695 2.04 37
  • 38.
  • 39.
    39 Area of ObjectivesMeasure Time Expectation Primary Responsibility Customers       1. Customer satisfaction Customer and online surveys Quarterly Managers/ Marketing 2. Customer Loyalty Product and purchasing reviews.  Memberships and number of returning and  new customers. Quarterly Marketing 3. Accessibility Open more stores in various countries. Biannually- Annually Marketing Managers/Employees       1. Improve working conditions Increase in productivity, employee surveys. Quarterly CEO 2. Improve employee training Increase in productivity and overall operating  efficiency Quarterly Human Resources Community/Social Responsibility       1. Business Ethics Endorse positive role model athlete`s.   Increase promotion of sports and wellness. Annually CEO 2. Environmentally Friendly Recycle materials, improve reputation and  customer perspective. Biannually CEO 3. Community involvement Run local sports camps, community/ city  events- increase customer awareness. Biannually Regional Managers Operations/ Processes       1. Improve Brand Image Increase in sales and customer  recommendations. Quarterly CEO 2. Product Innovation Number of new stores, products and  marketing Quarterly CEO/ Marketing 3. Market Penetration Number of stores and sales in new/ other  countries Annually Marketing Financial       1. Reduce Cost of production Decrease in production expenses. Annually CFO 2. Increase Revenue Increase in annual sales Annually CFO
  • 40.
  • 41.
    • http://investors.nikeinc.com/Investors/Financial-Reports-and-Filings/Annual-Reports/default.aspx • http://investors.nikeinc.com/Theme/Nike/files/doc_financials/AnnualReports/2009/docs/Nike_2009_10-K.p •http://investors.nikeinc.com/Theme/Nike/files/doc_financials/AnnualReports/2006/docs/10k.pdf • http:// investing.businessweek.com/research/stocks/financials/financials.asp?ticker=NKE:US&dataset=incomeS • http://finance.yahoo.com/q/is?s=NKE+Income+Statement&annual • http://www.nike.com/nikeos/p/nike/en_US/?&ref • Datamonitor.com – UMFK library sites • http://en.wikipedia.org/wiki/List_of_most_populous_cities_in_India • www.yahoofinance.com • https://materials.proxyvote.com/Approved/654106/20090724/AR_44240/HTML2/default.htm • http://en.wikipedia.org/wiki/Nike_timeline • http://nikeinc.com/pages/history-heritage • http://investing.money.msn.com/investments/financial-statements?symbol=NKE  • http://www.nike.com/nikeos/p/nike/en_IN/store_locator  • Strategic Management Concepts and Cases 13th  Edition. Fred R. David. 41
  • 42.