Download to read offline


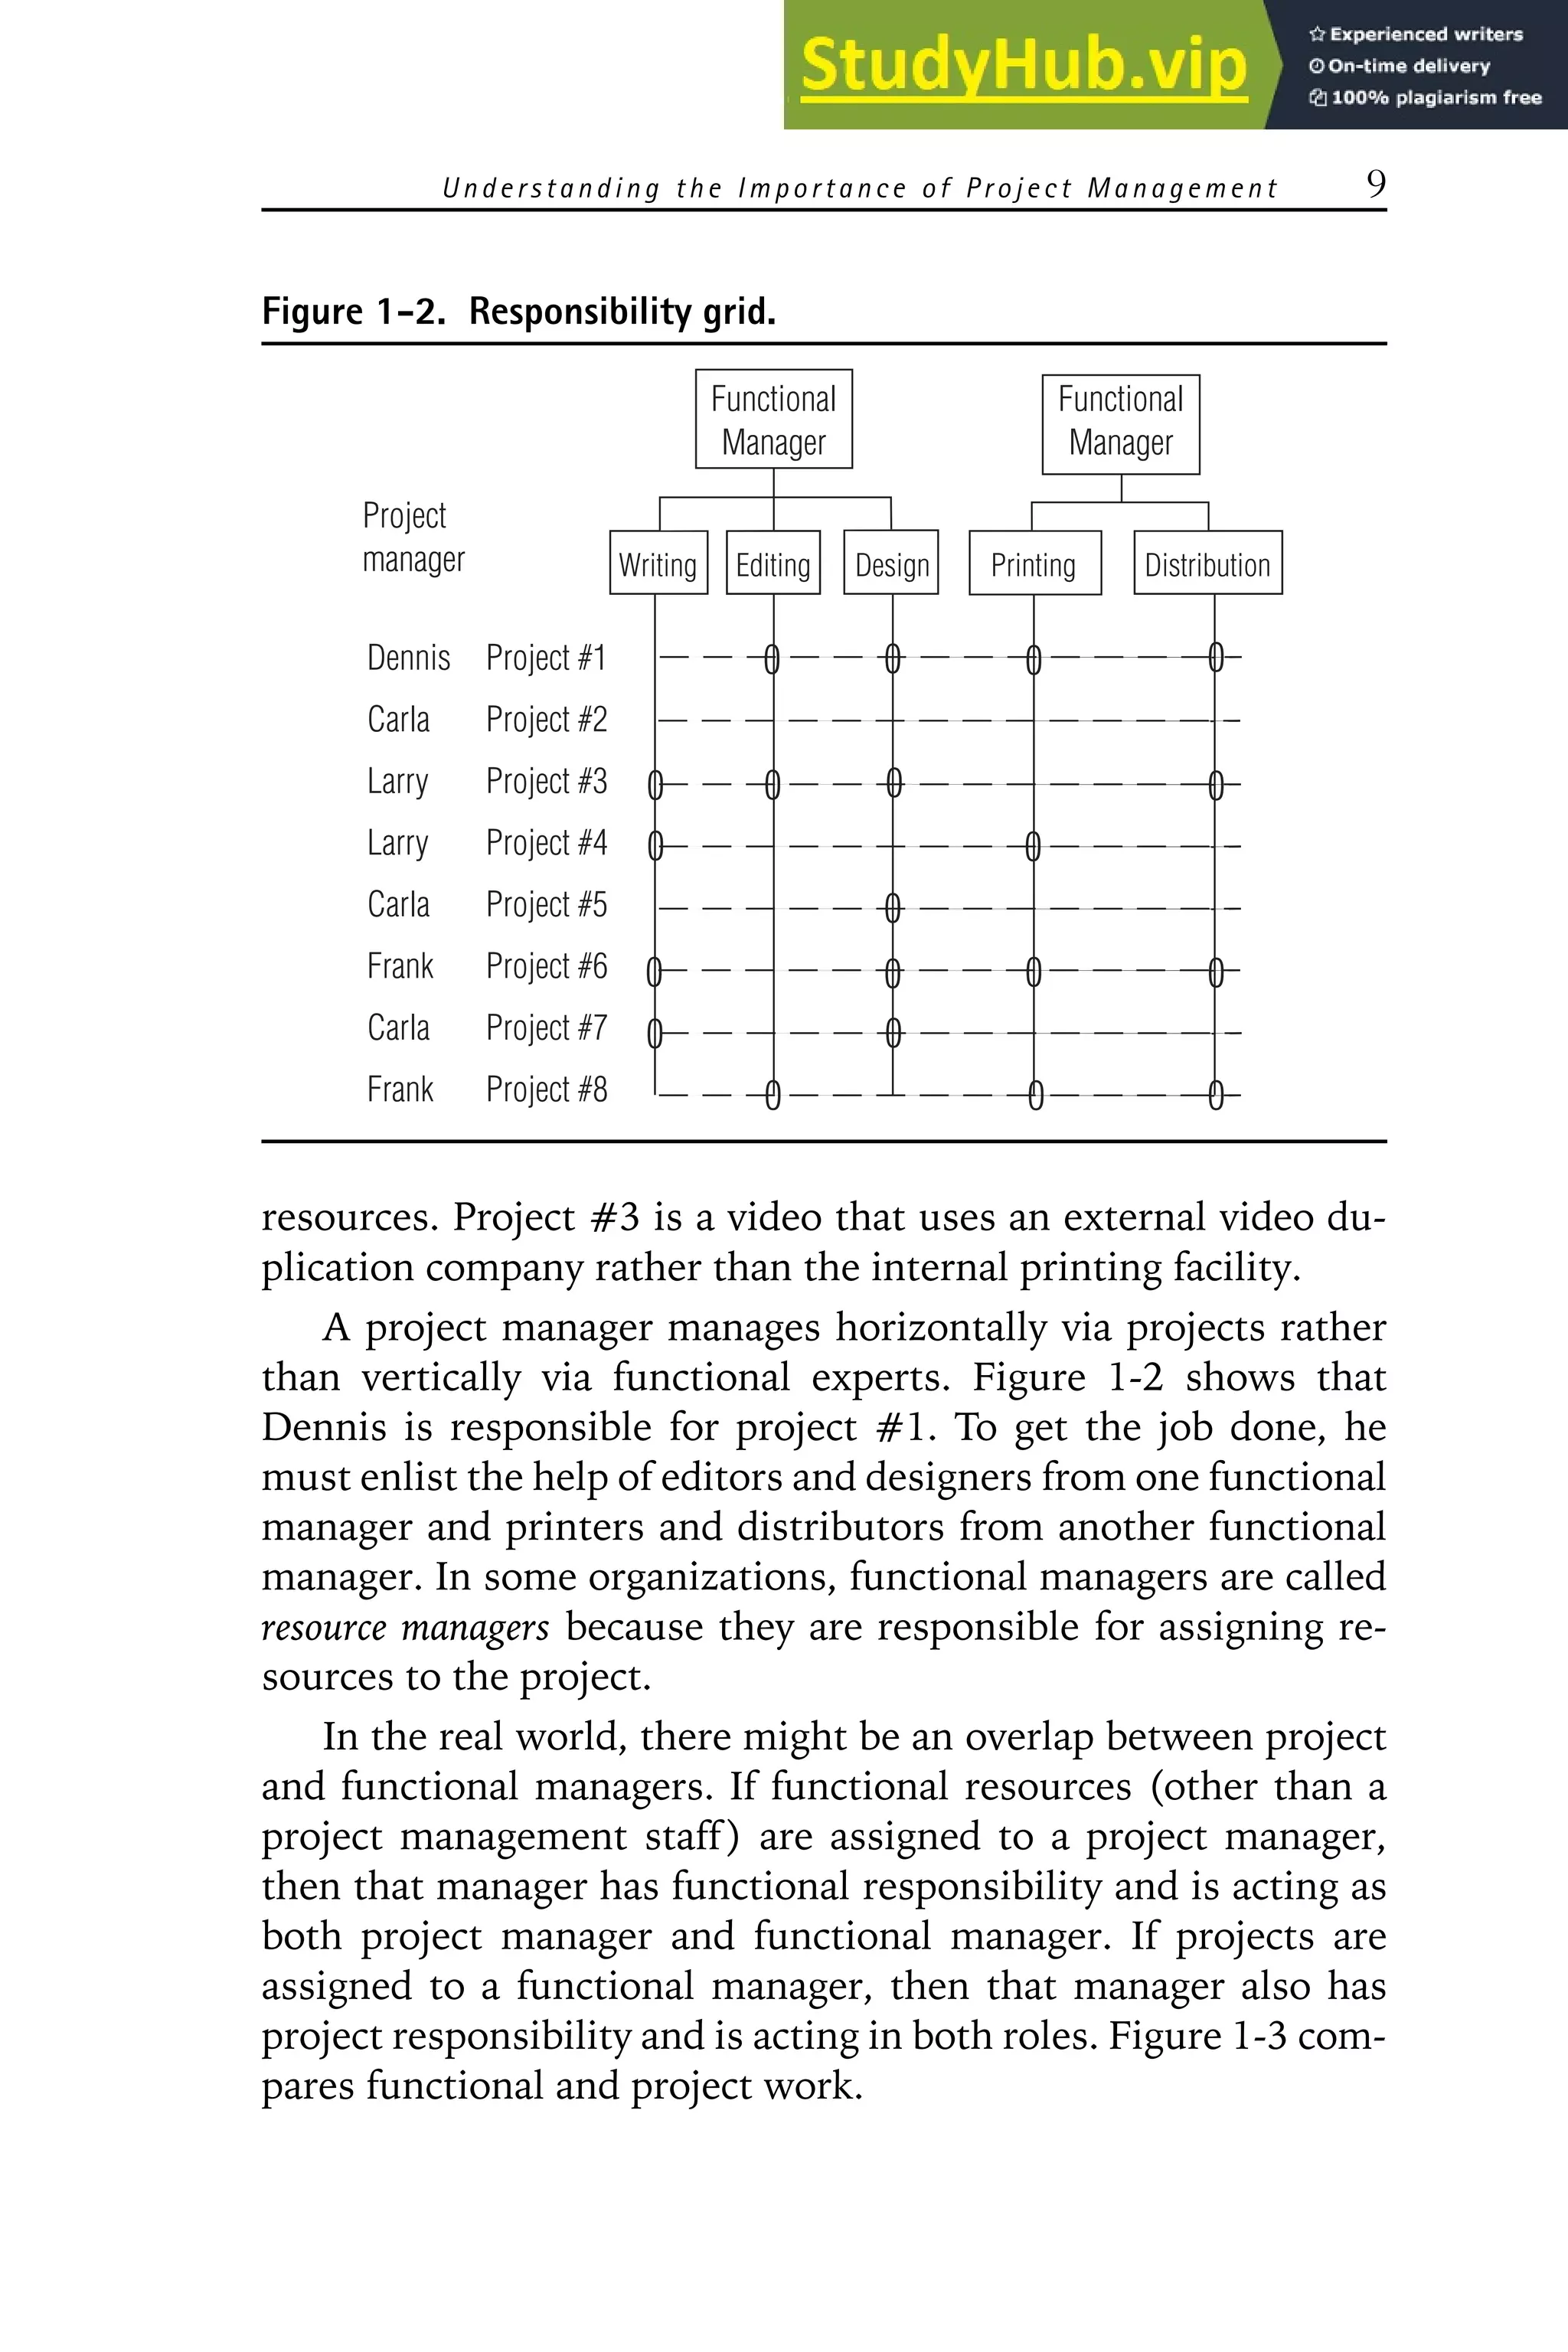
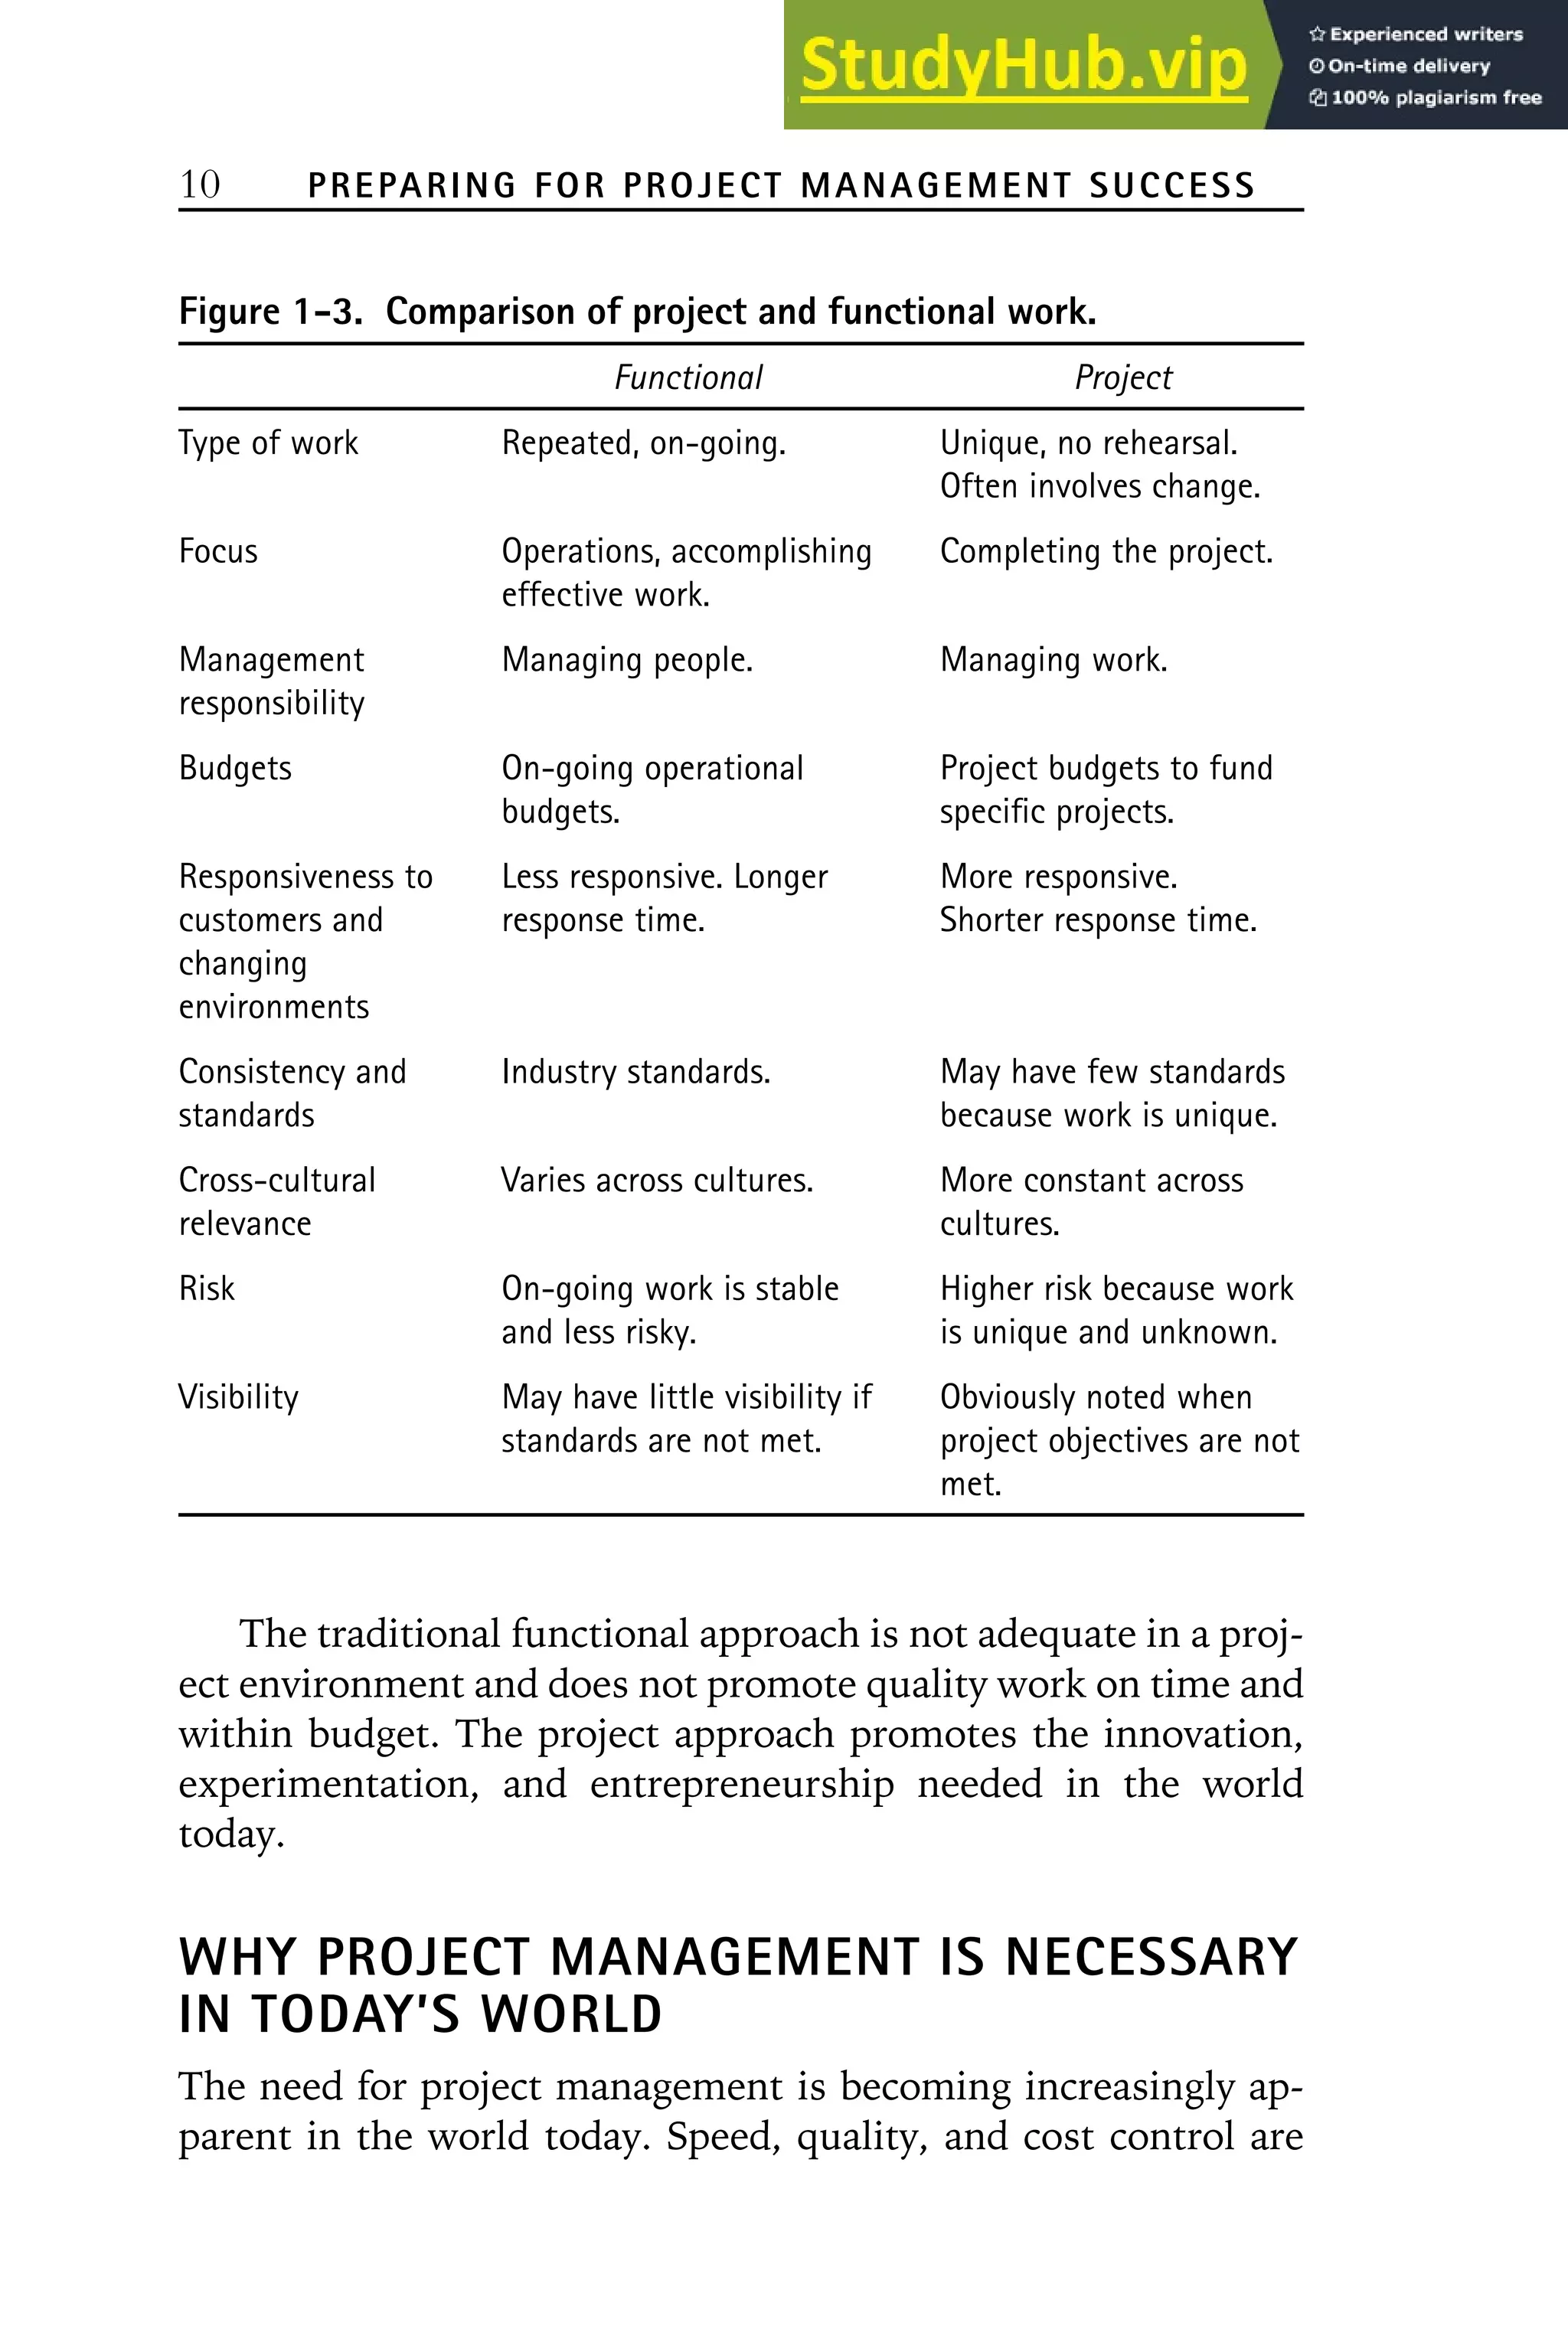
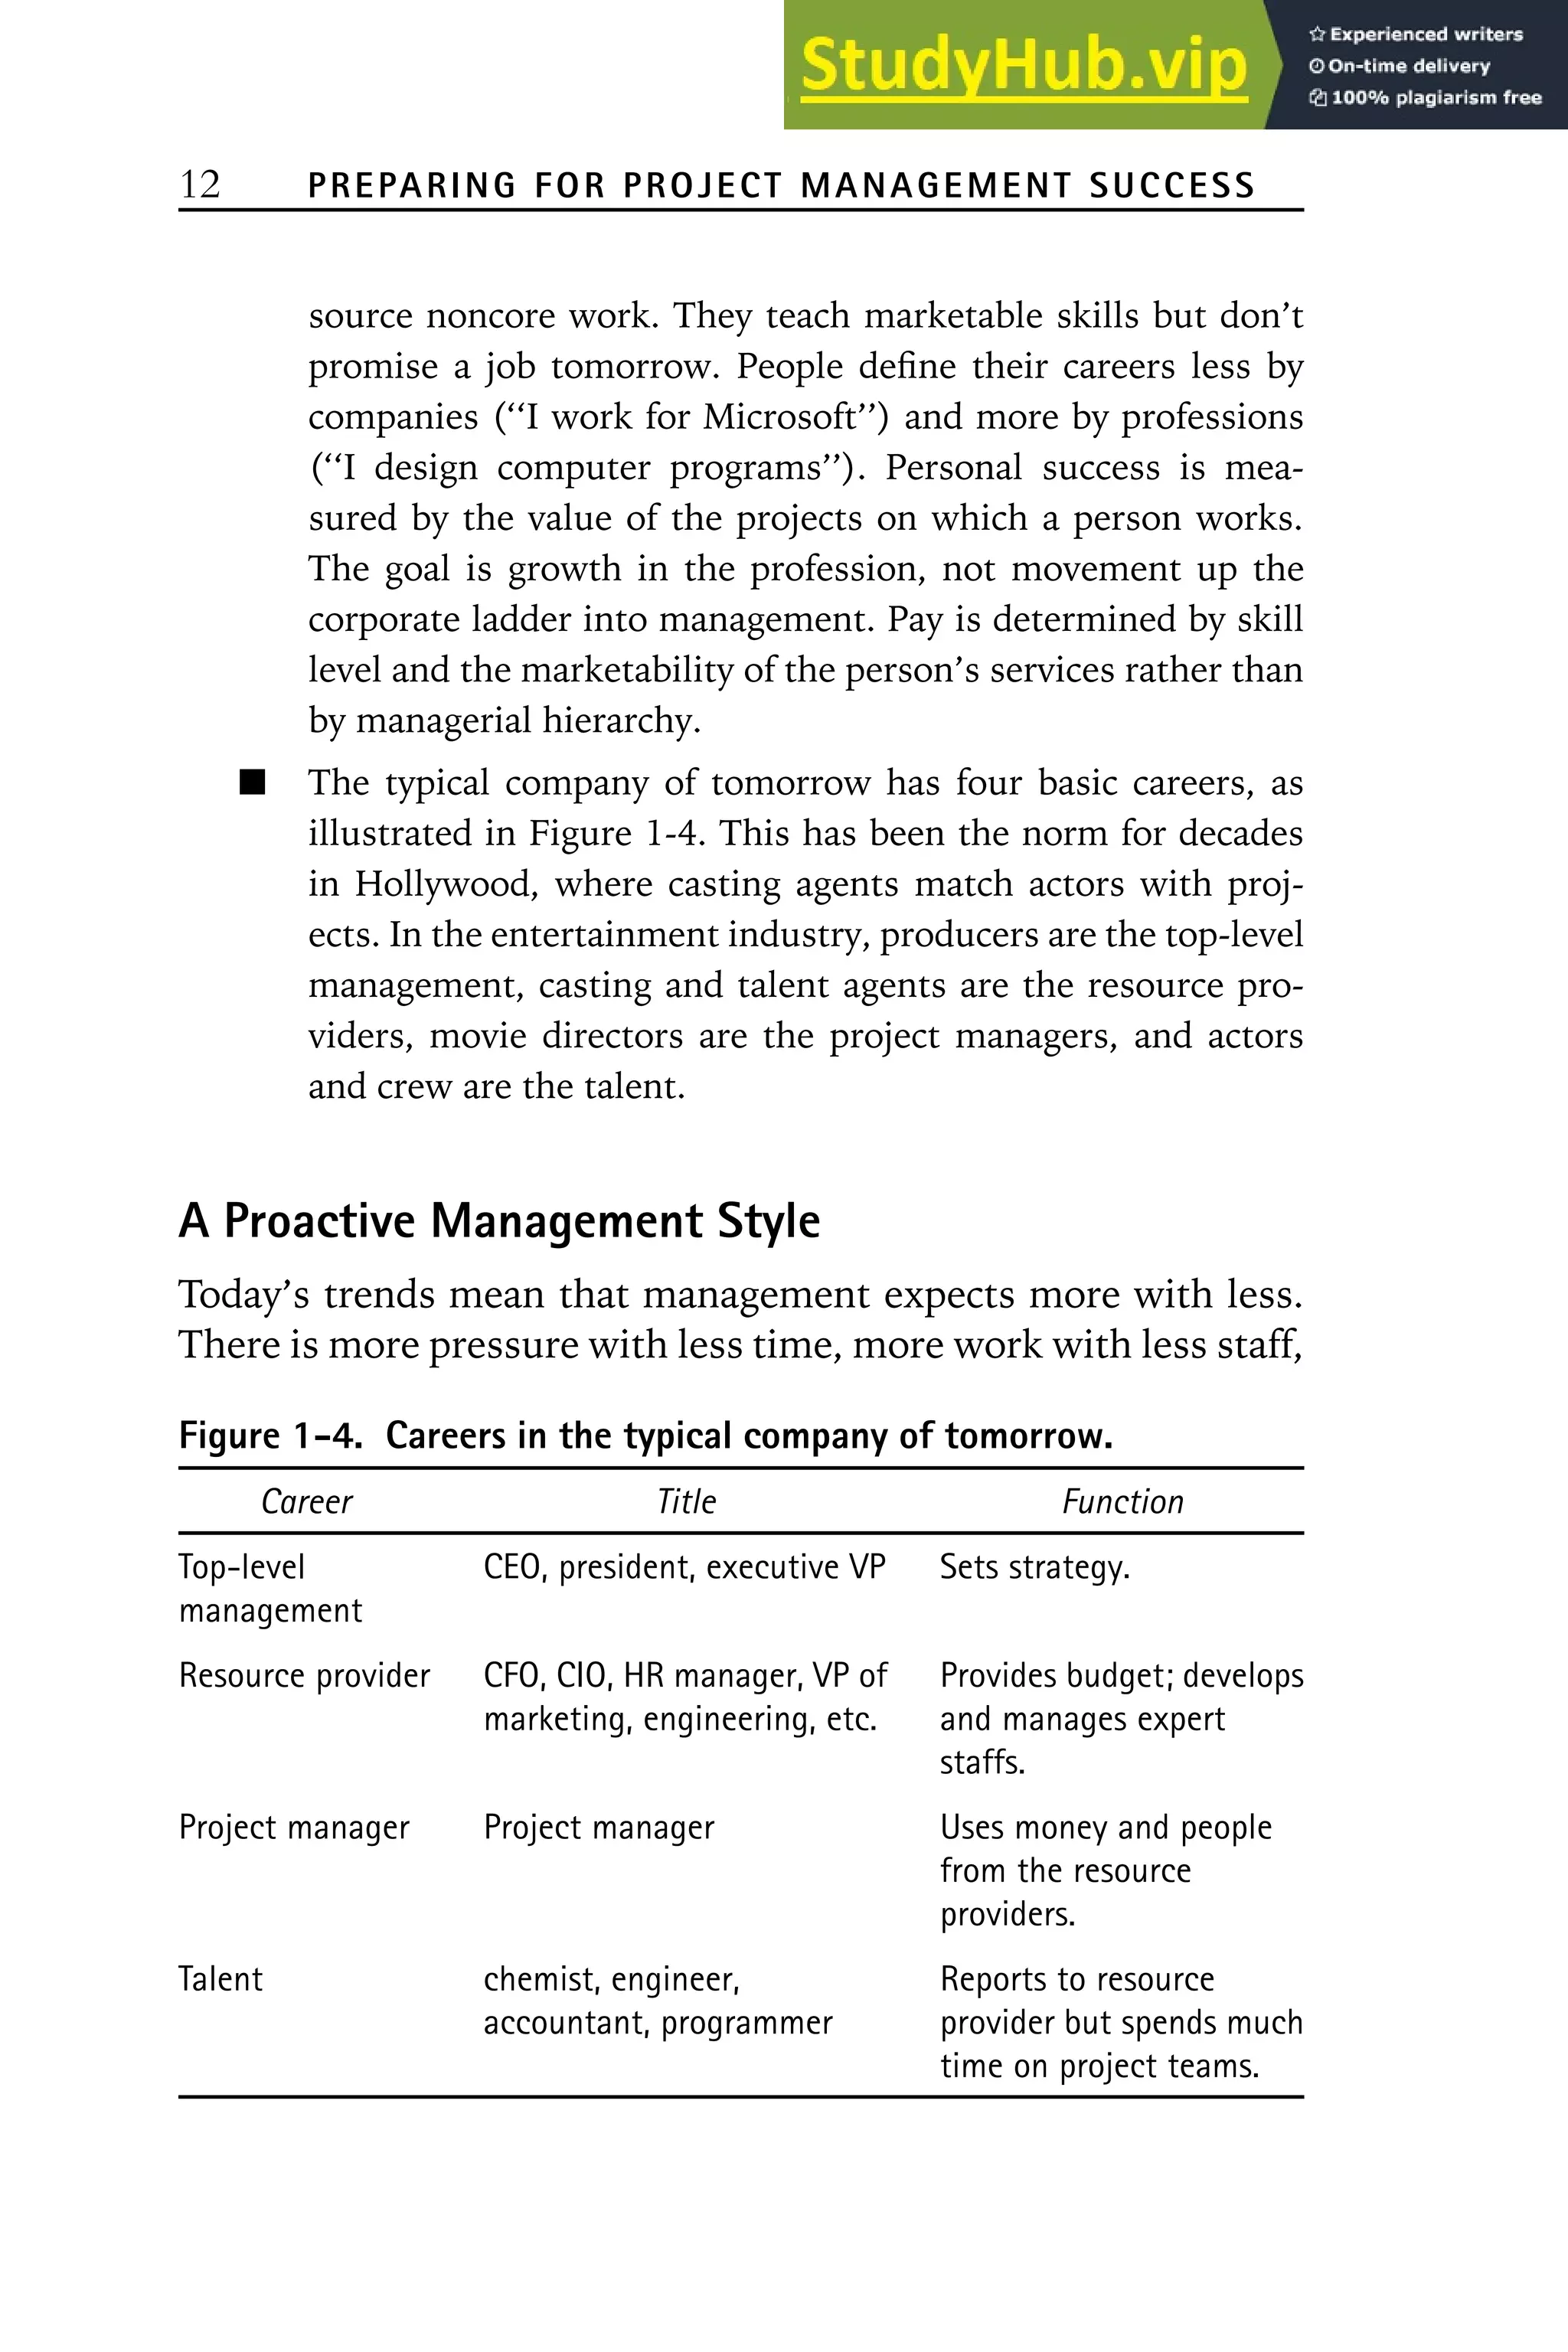
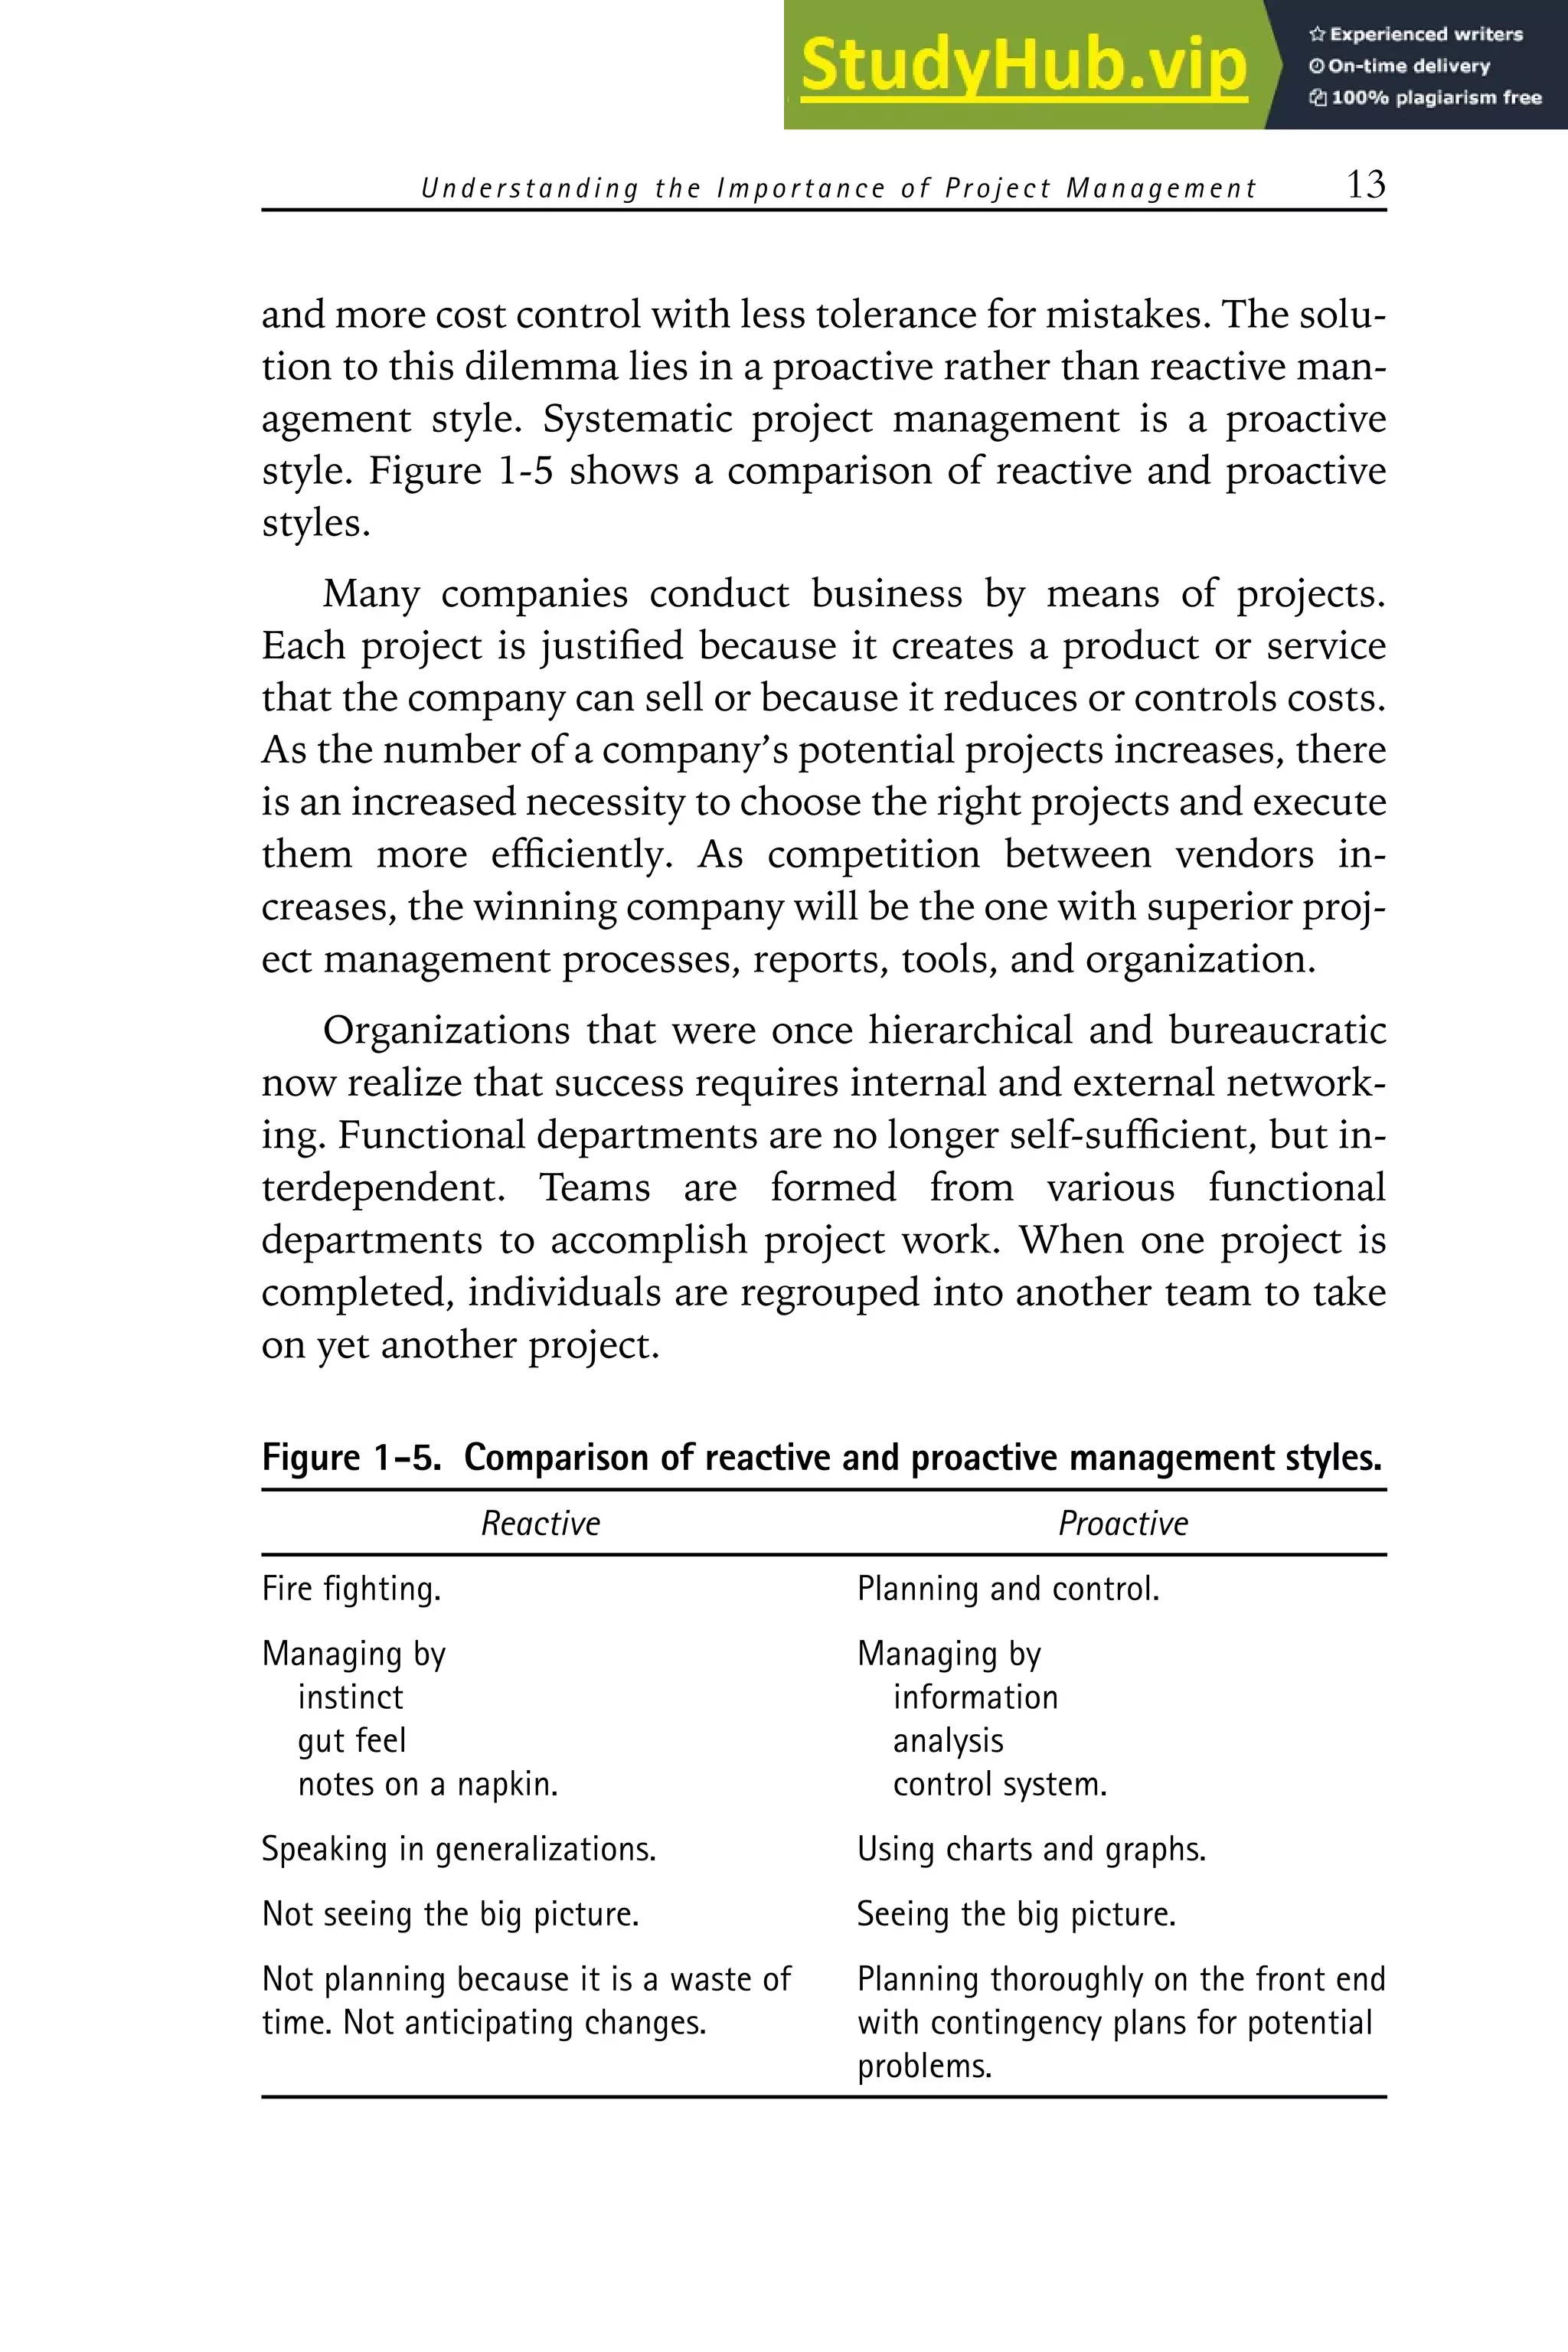


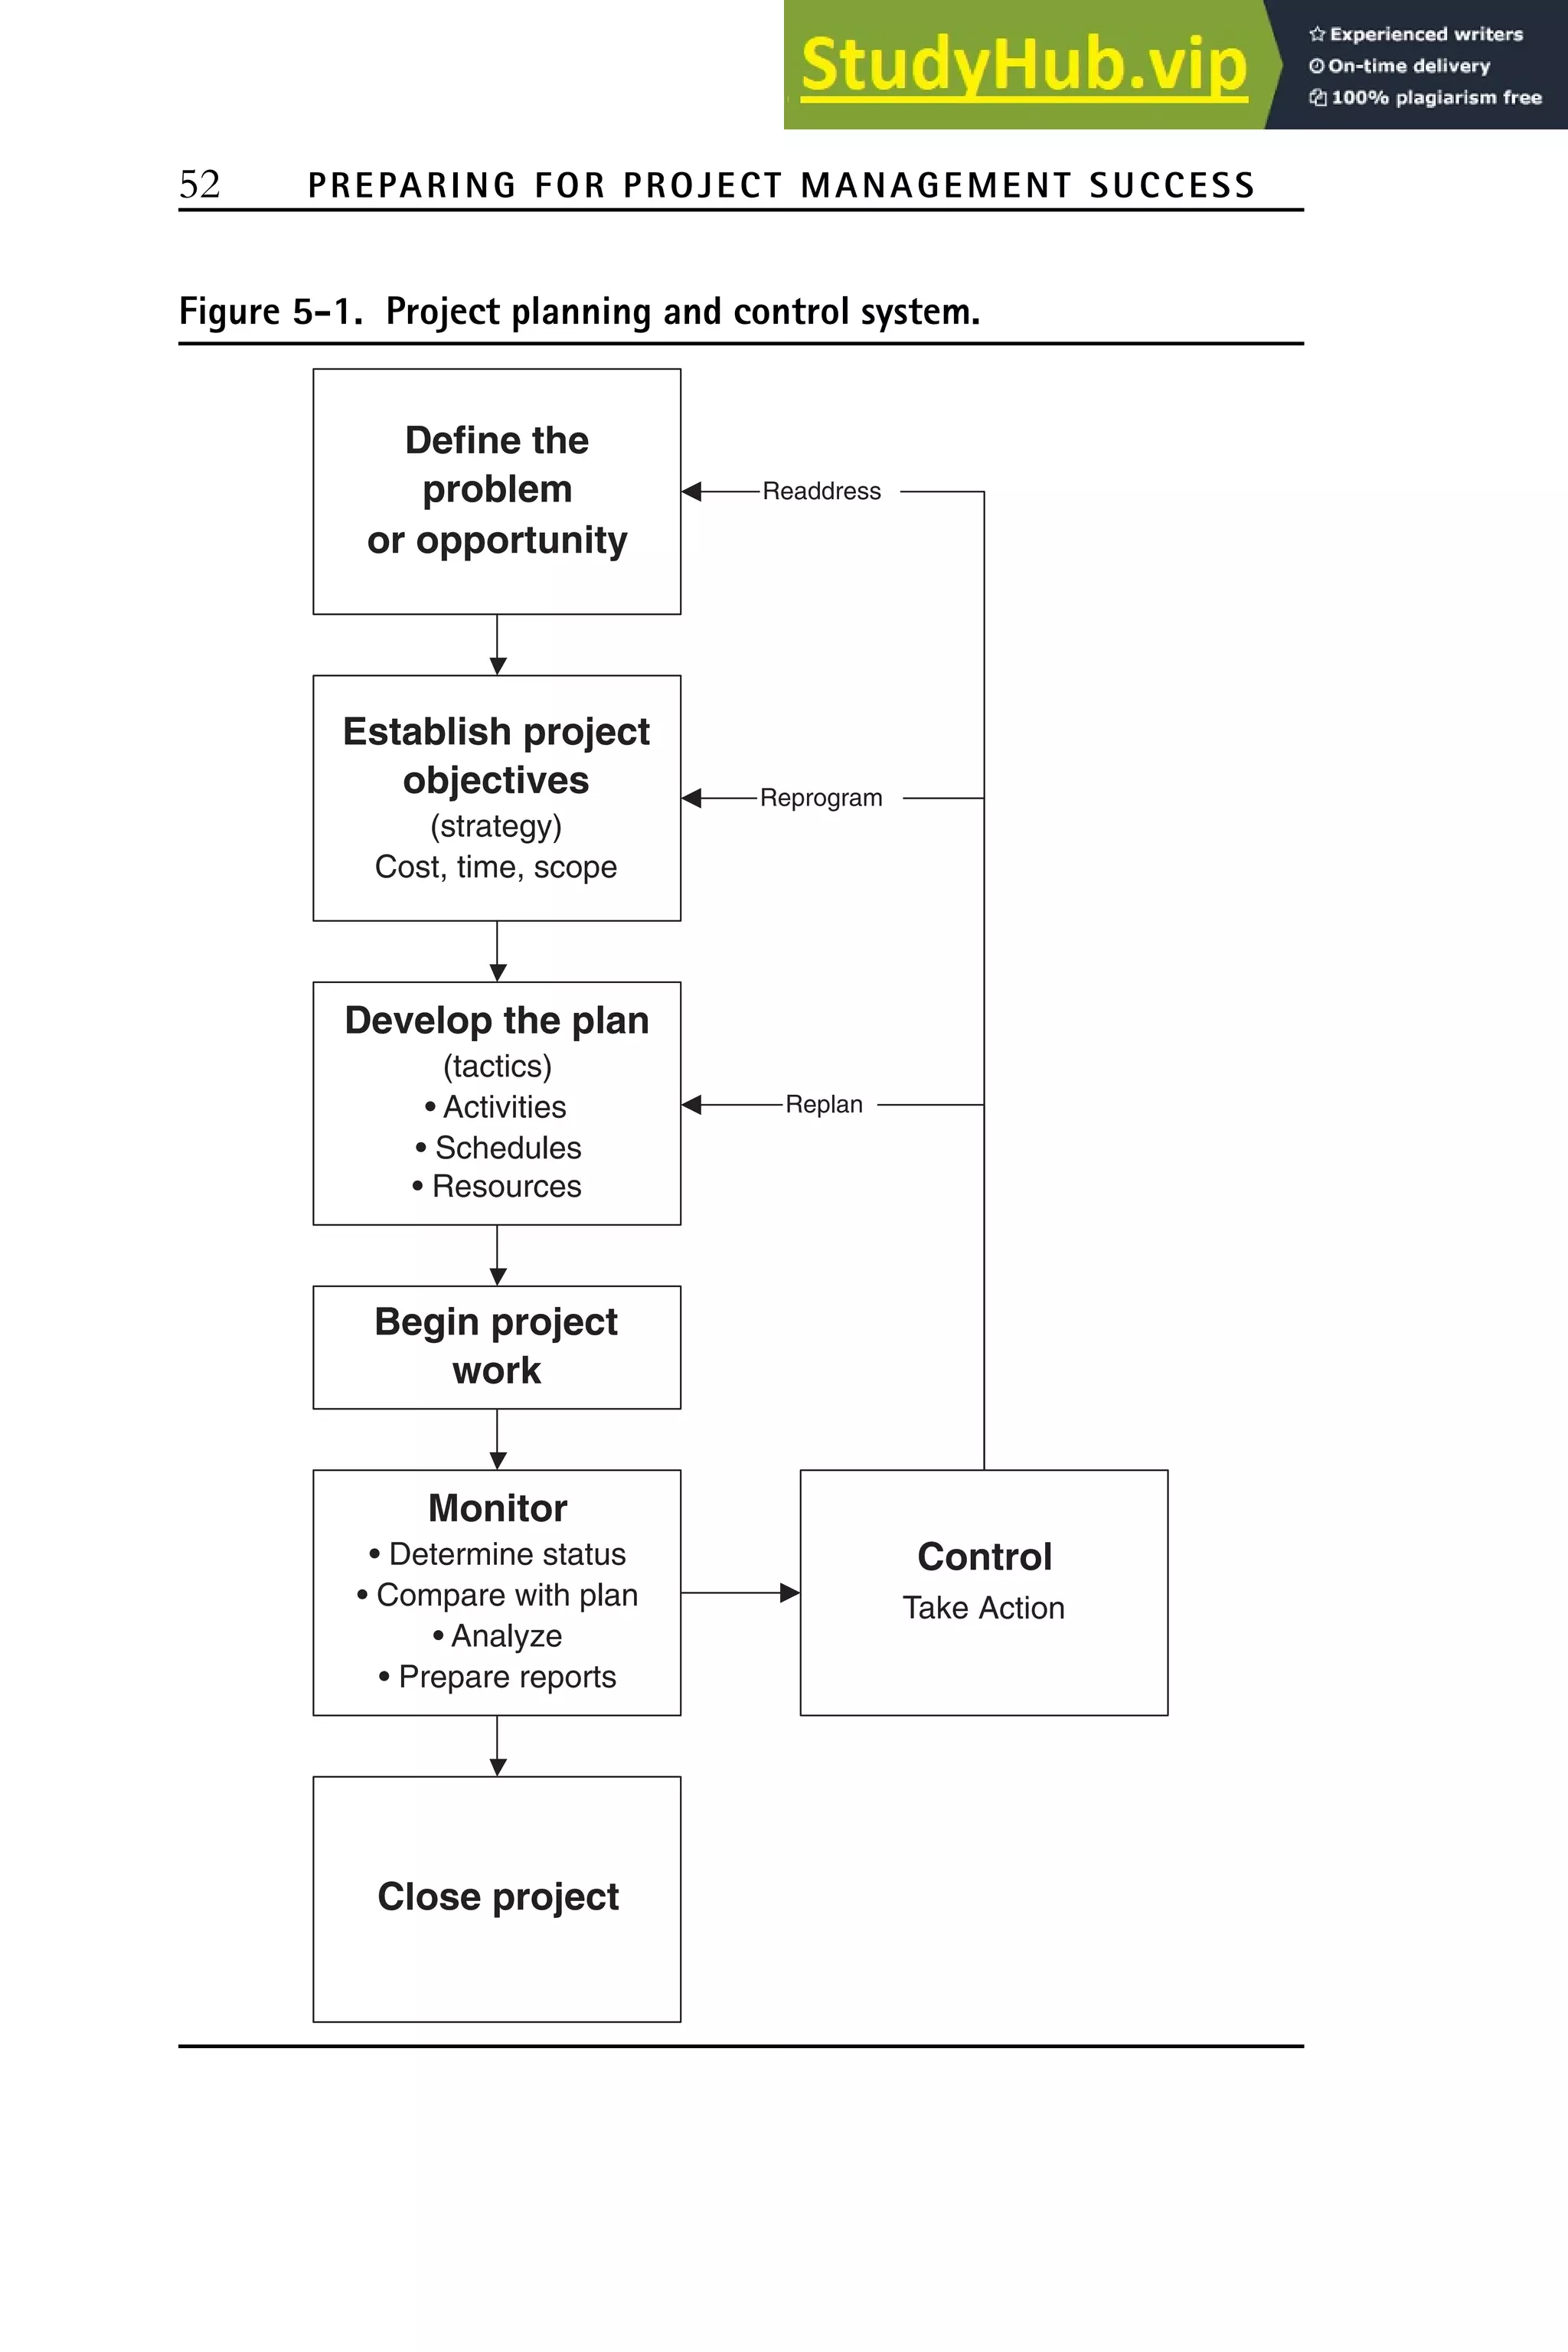


This document provides an overview of project management. It defines project management as a set of principles, methods, and techniques used to effectively plan and control project work. The objective of project management is to optimize project cost, time, and quality. While project management has existed for centuries, it emerged as a formal management concept in the 1950s-1960s to help manage complex aerospace projects. Today, project management is necessary for most organizations due to business trends like globalization, rapid technological change, and the need to be innovative.


