![Alternative Sewage Treatment Option: The Effect of use of Water Hyacinth (Eichornia crassipes) in the Treatment of Domestic Sewage A. E. Adeniran Works & Physical Planning Department University of Lagos, Nigeria [email_address] [email_address]](https://image.slidesharecdn.com/alternativesewagetreatmentoption-110826120532-phpapp02/85/Alternative-sewage-treatment-option-for-Developing-Countries-1-320.jpg)
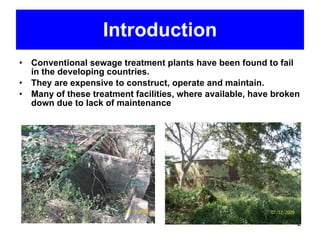

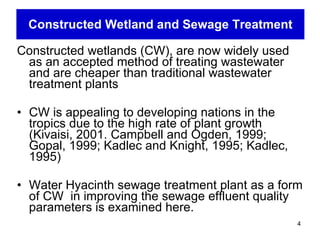
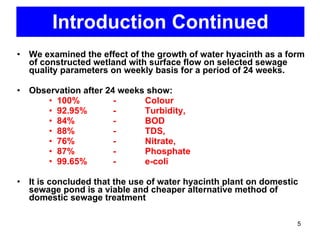
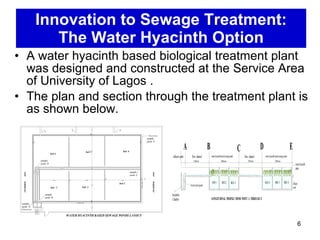


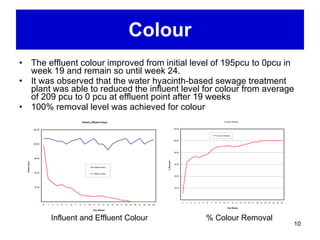
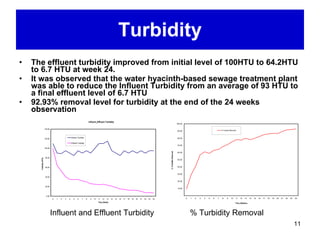


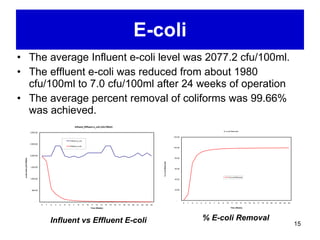


The document discusses the effectiveness of using water hyacinth (Eichhornia crassipes) as a constructed wetland (CW) for treating domestic sewage, highlighting its viability and cost advantages over traditional treatment methods. It reports significant reductions in sewage quality parameters such as color, turbidity, biochemical oxygen demand (BOD), nitrate, phosphate, and E. coli over a 24-week period, achieving up to 100% color removal and 99.66% E. coli removal. The findings suggest that water hyacinth-based treatment systems are not only effective but also economically beneficial for developing regions facing sewage management challenges.


![[Duncan_Mara]_Domestic_Wastewater_Treatment_in_Dev(z-lib.org).pdf](https://cdn.slidesharecdn.com/ss_thumbnails/duncanmaradomesticwastewatertreatmentindevz-lib-230720090216-408bdb51-thumbnail.jpg?width=640&height=640&fit=bounds)


