Download as PDF, PPTX


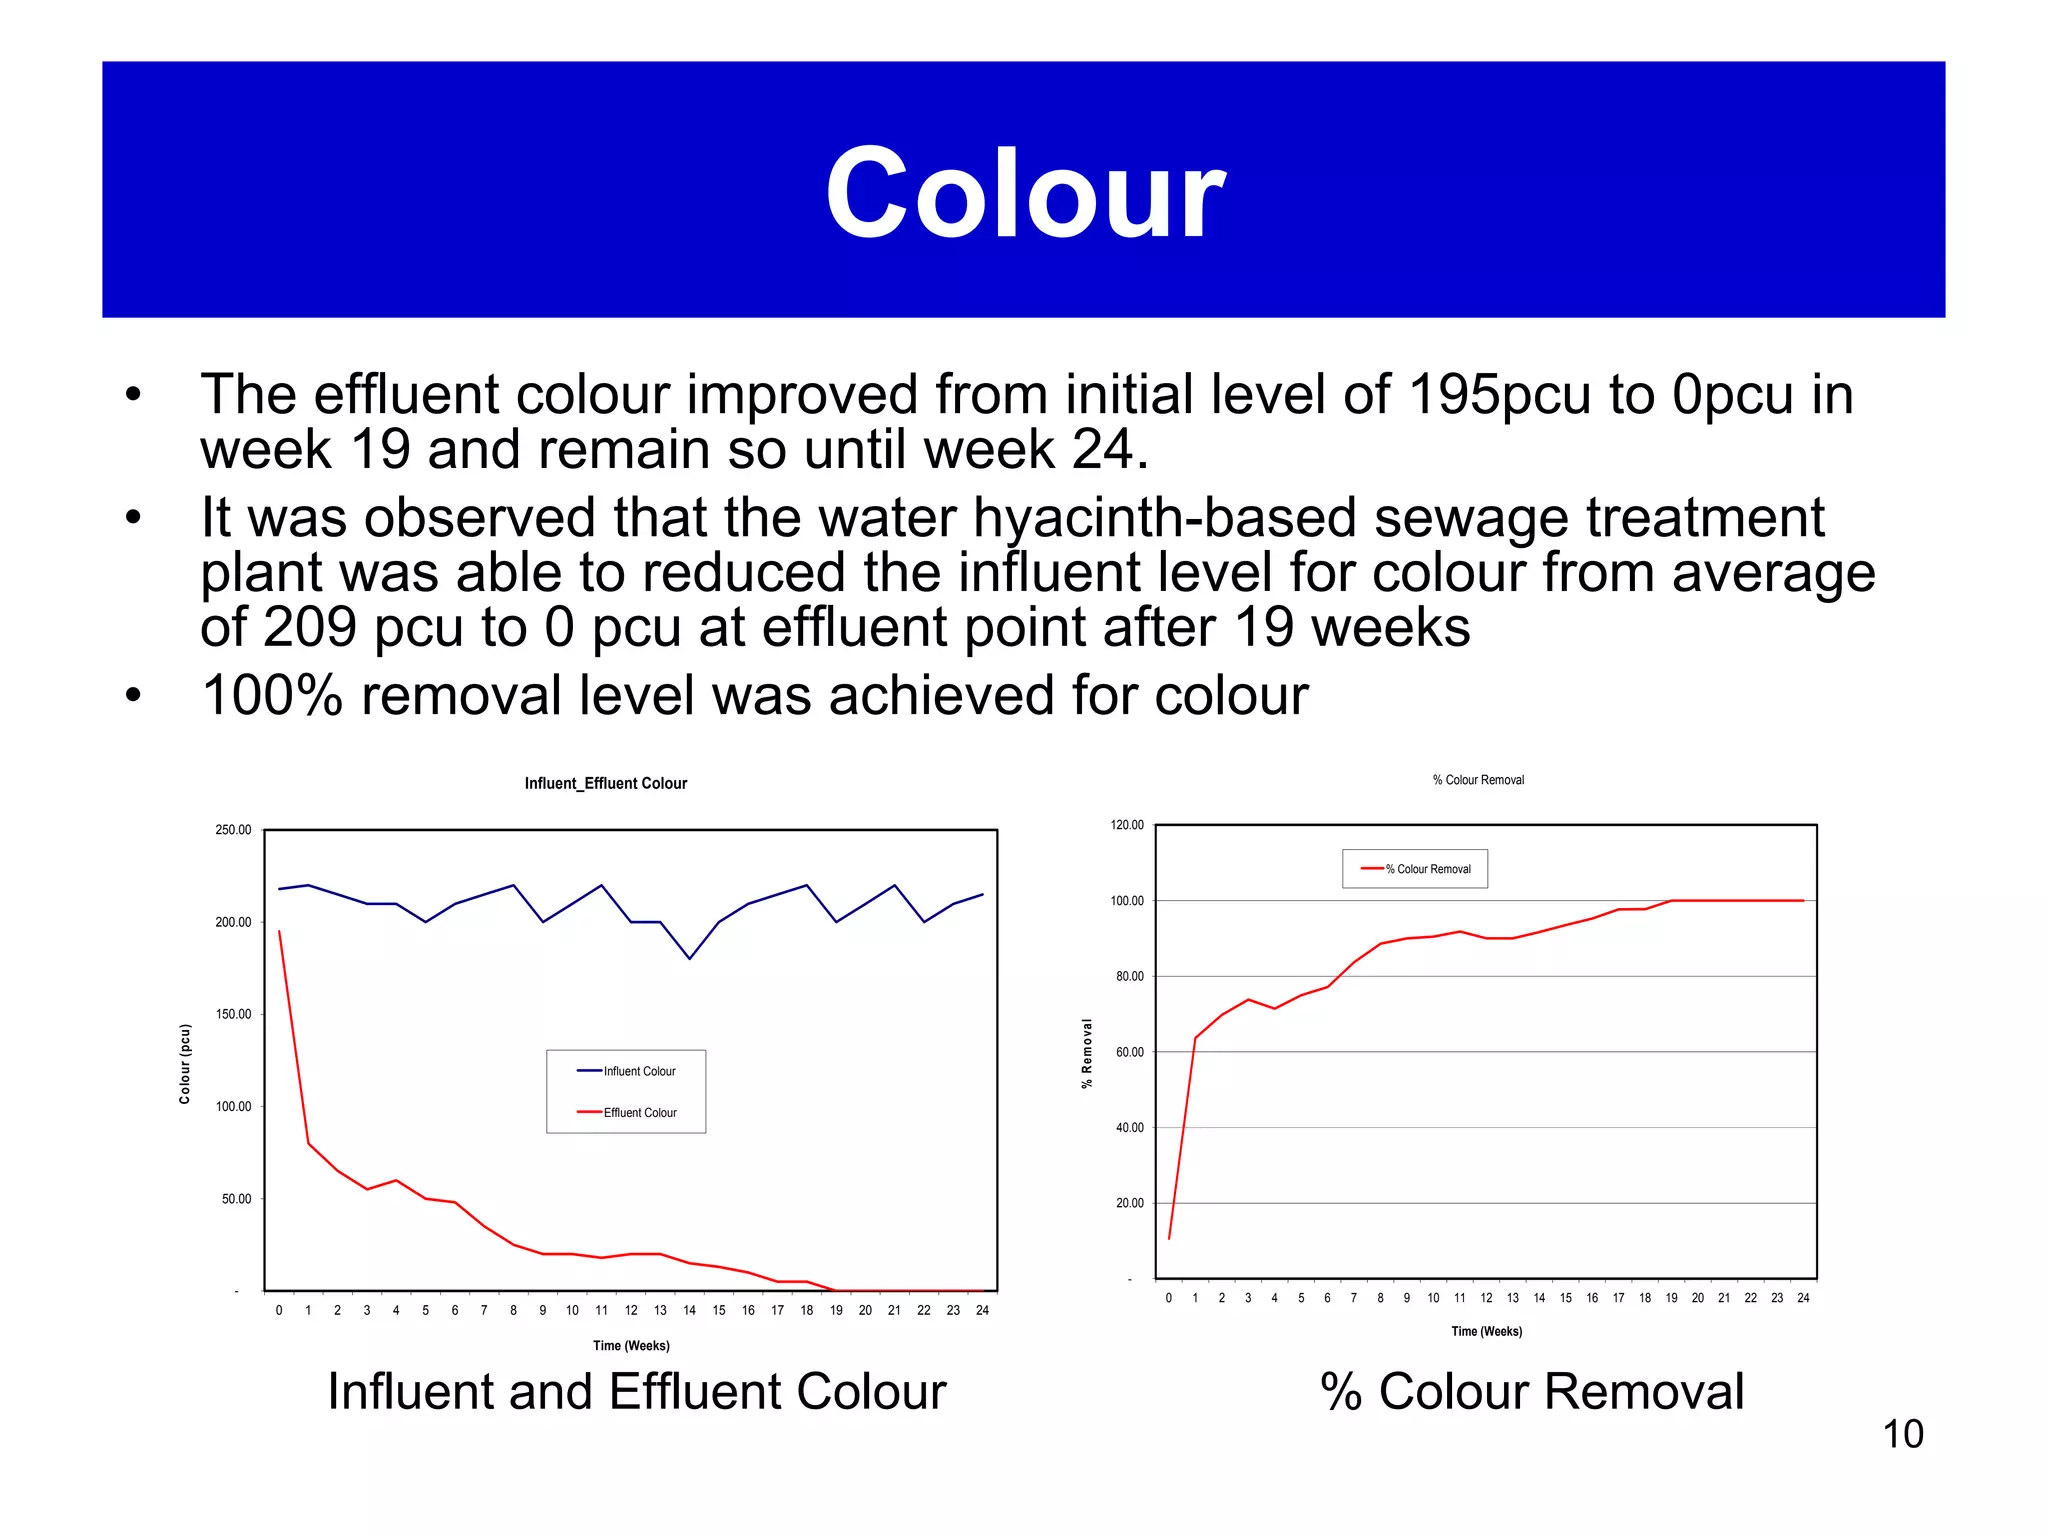
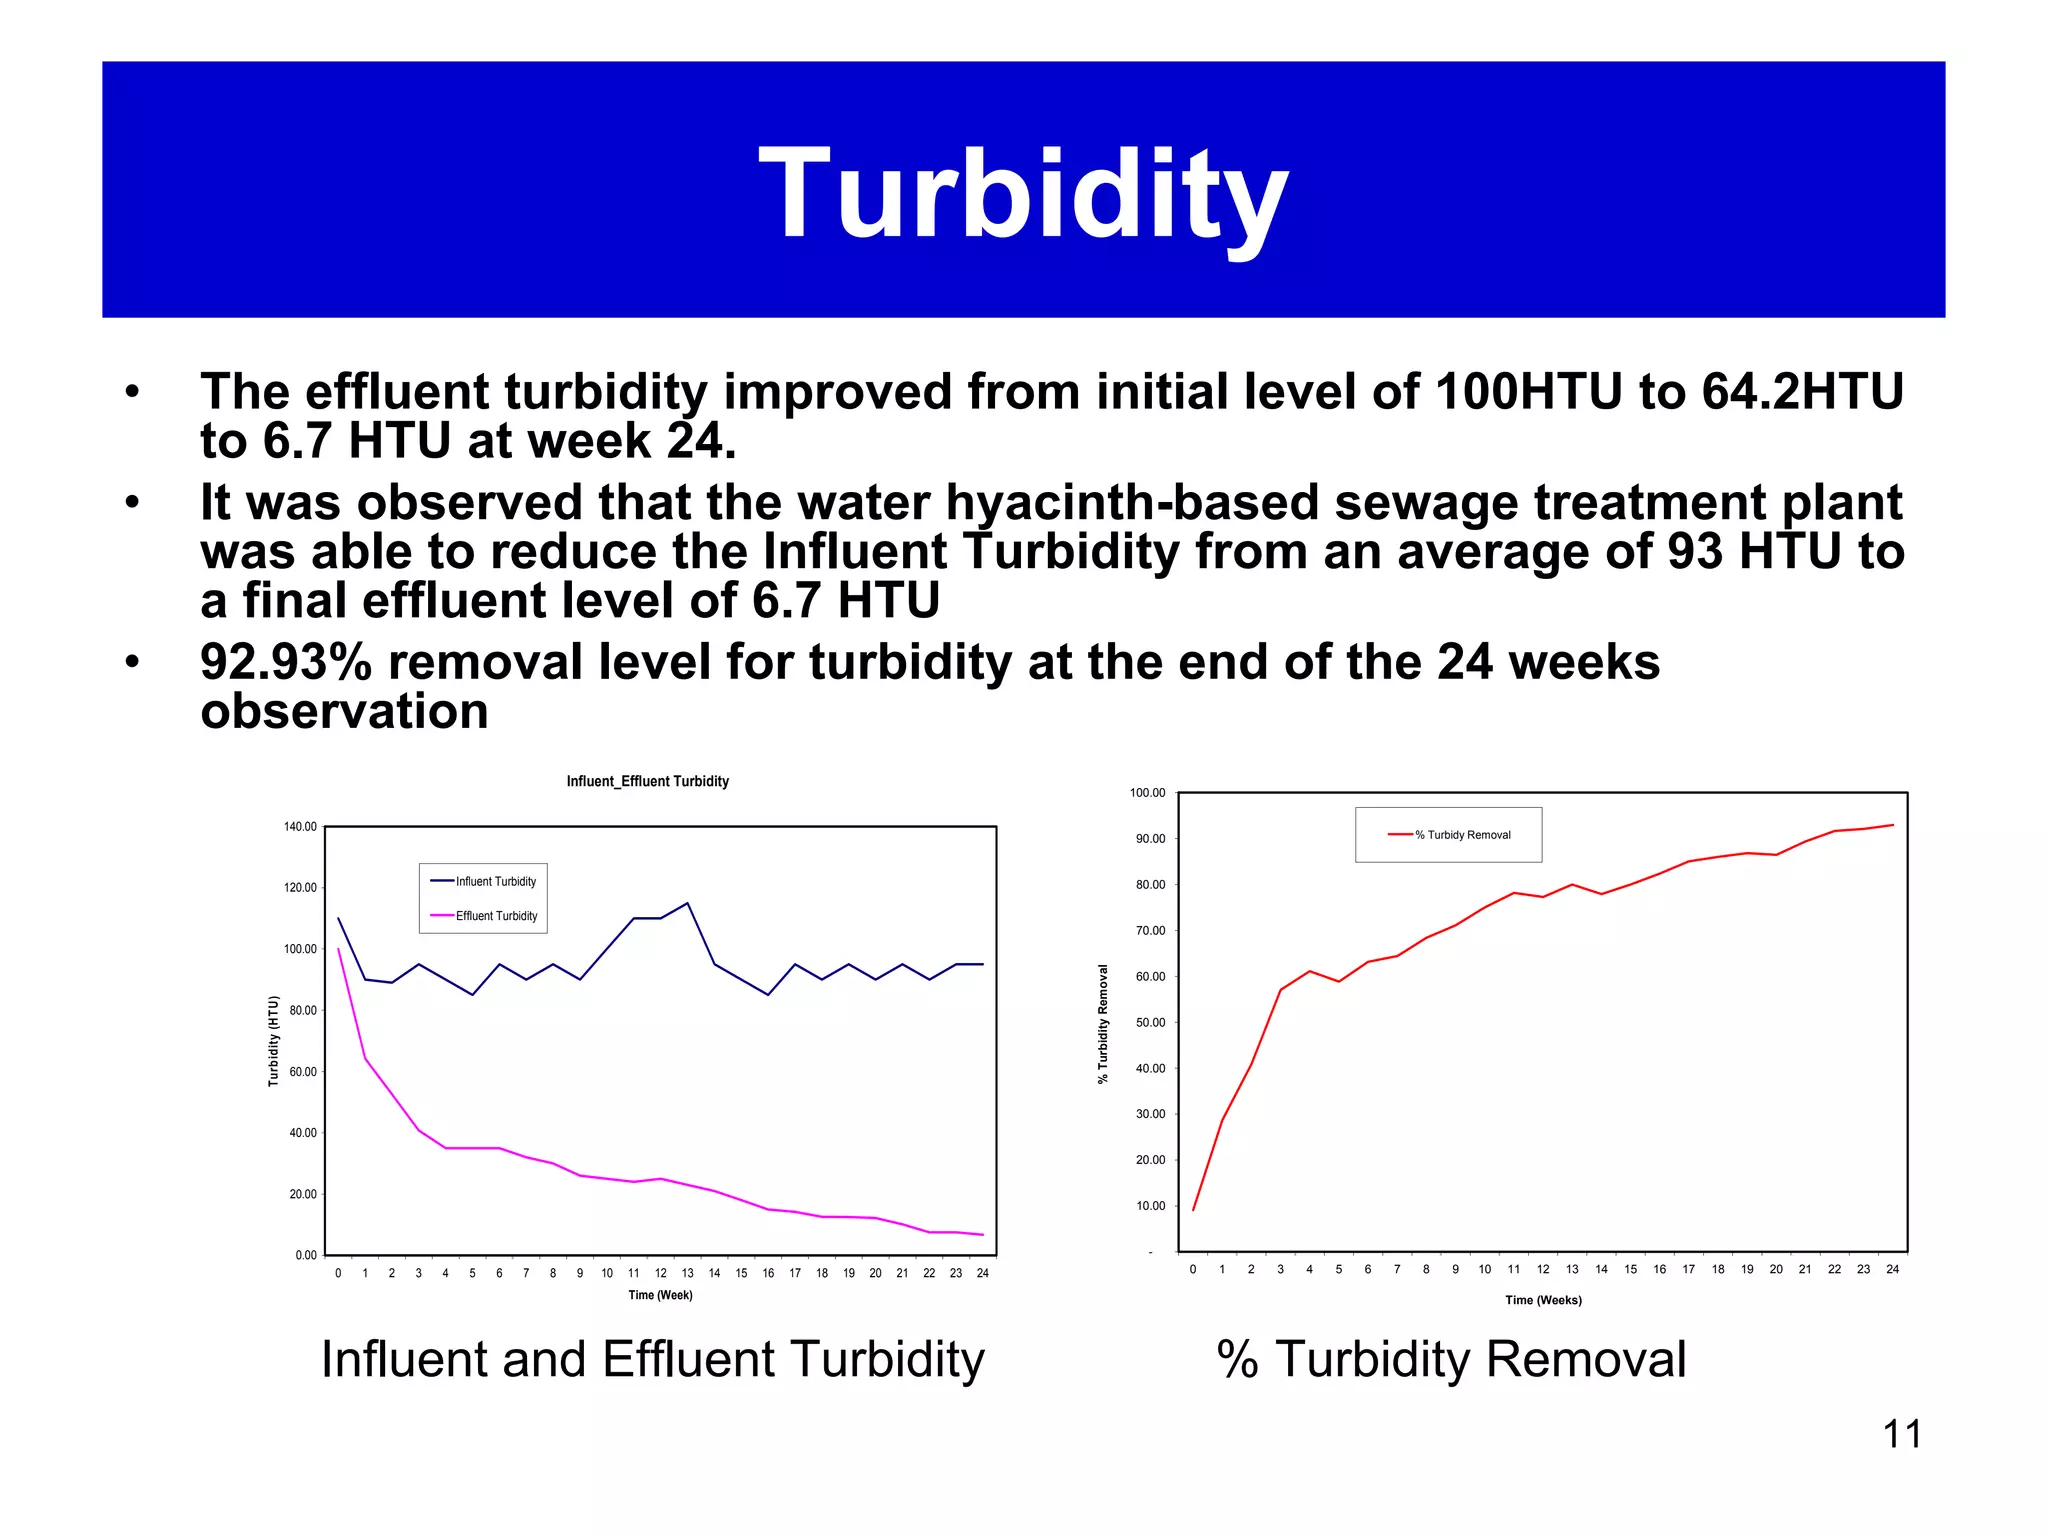


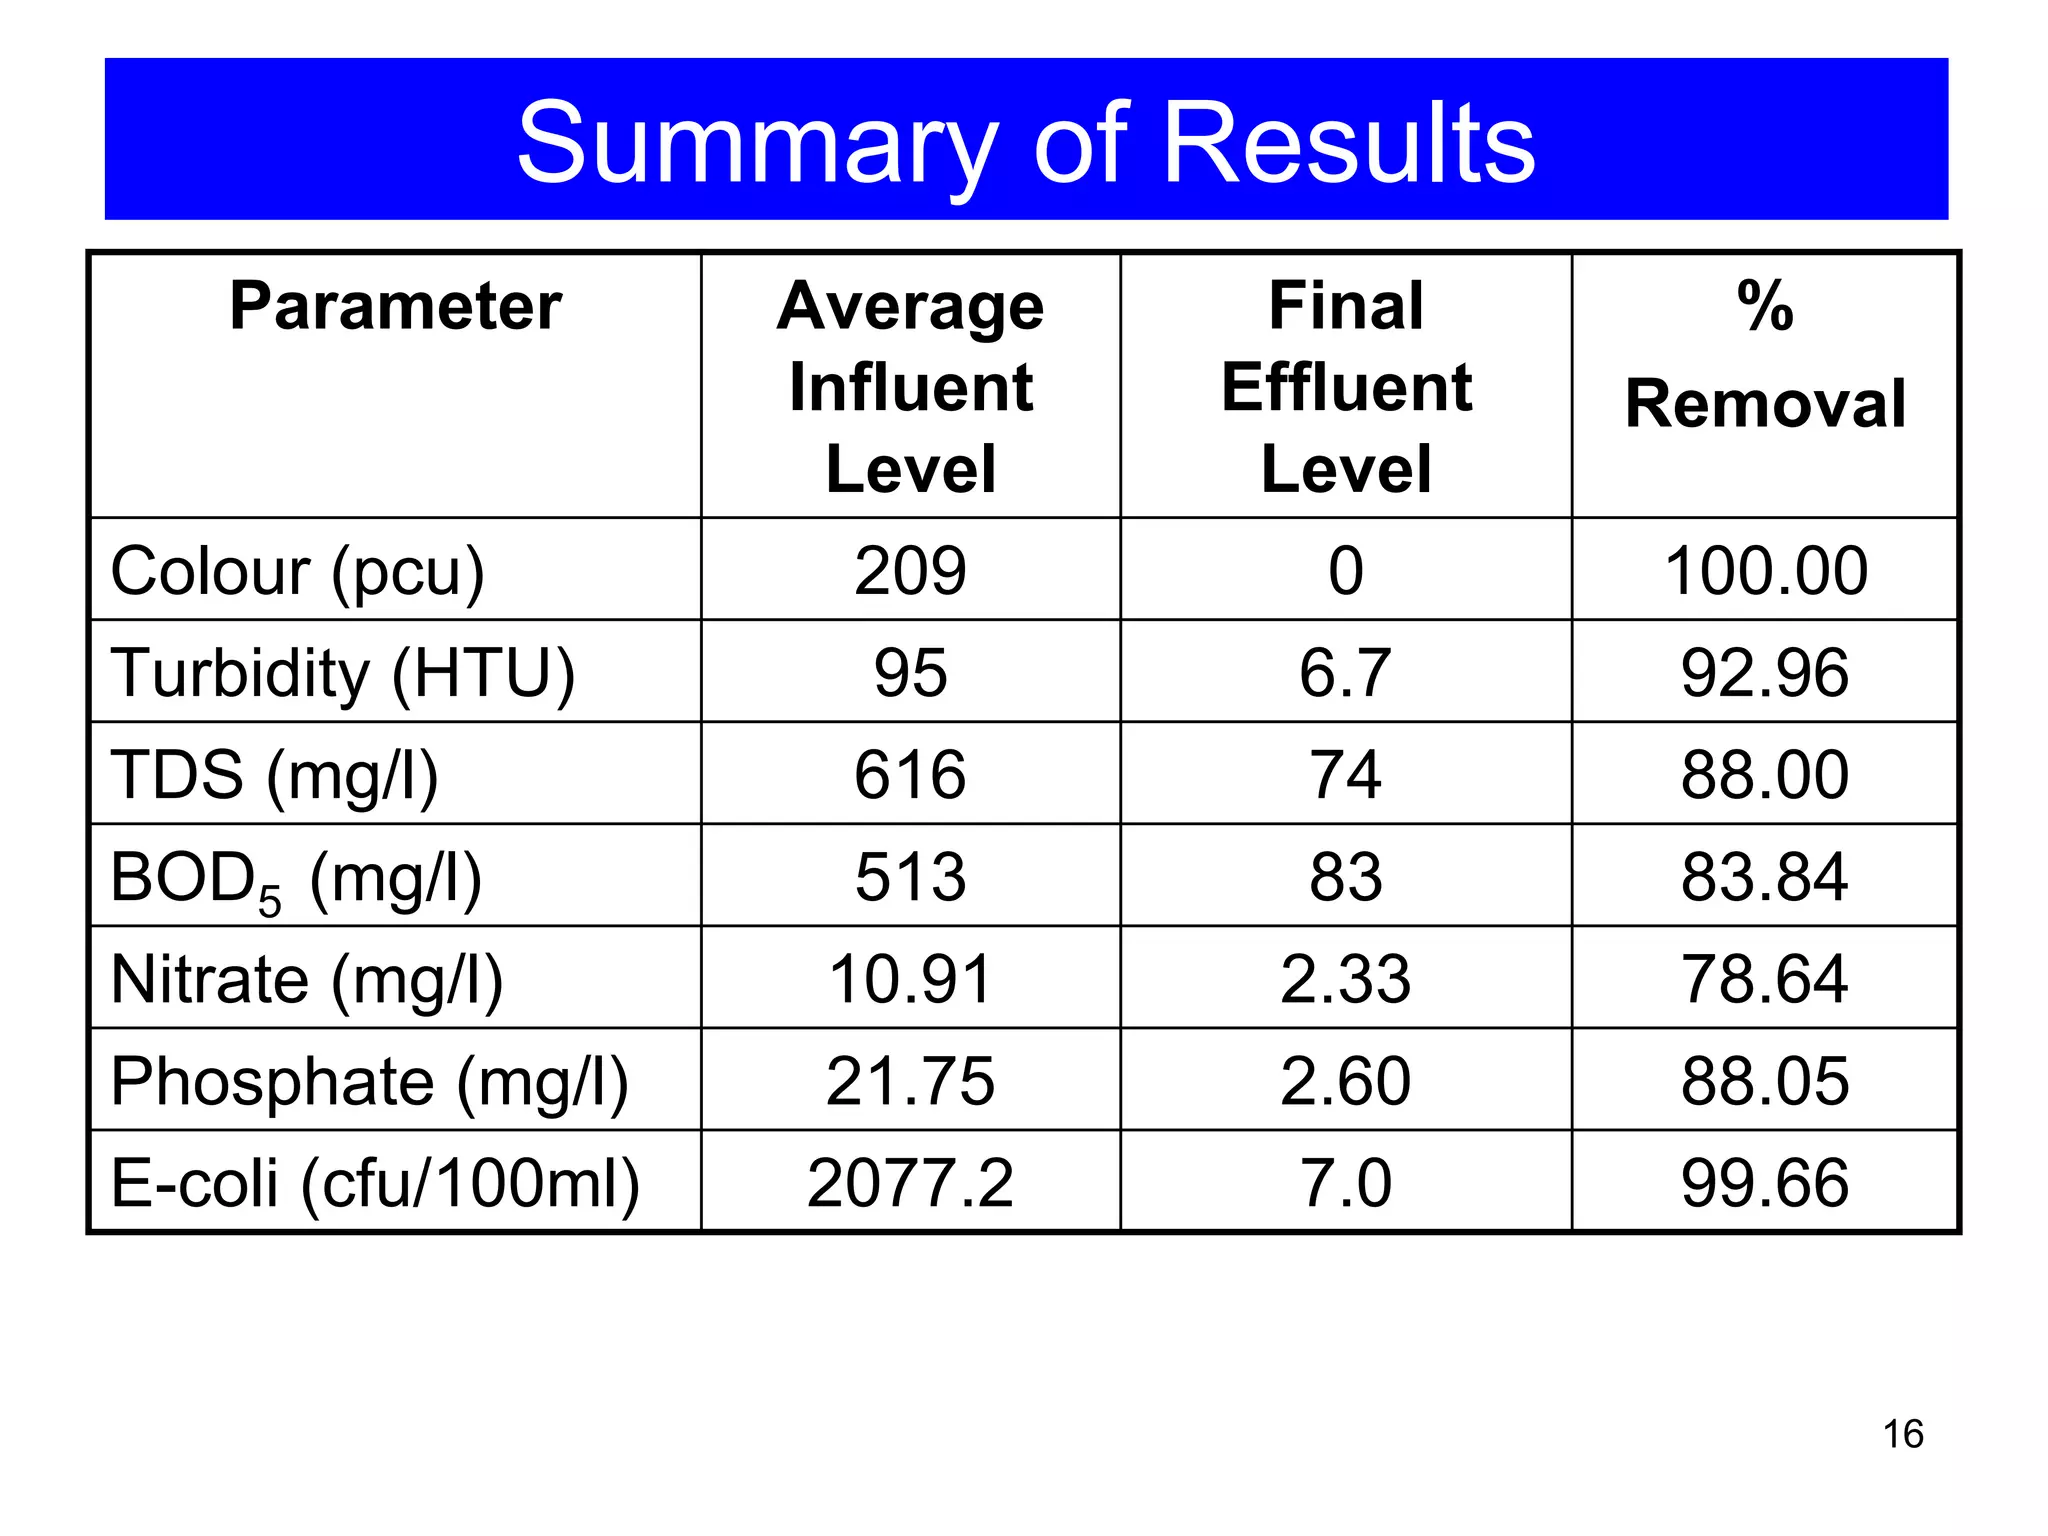

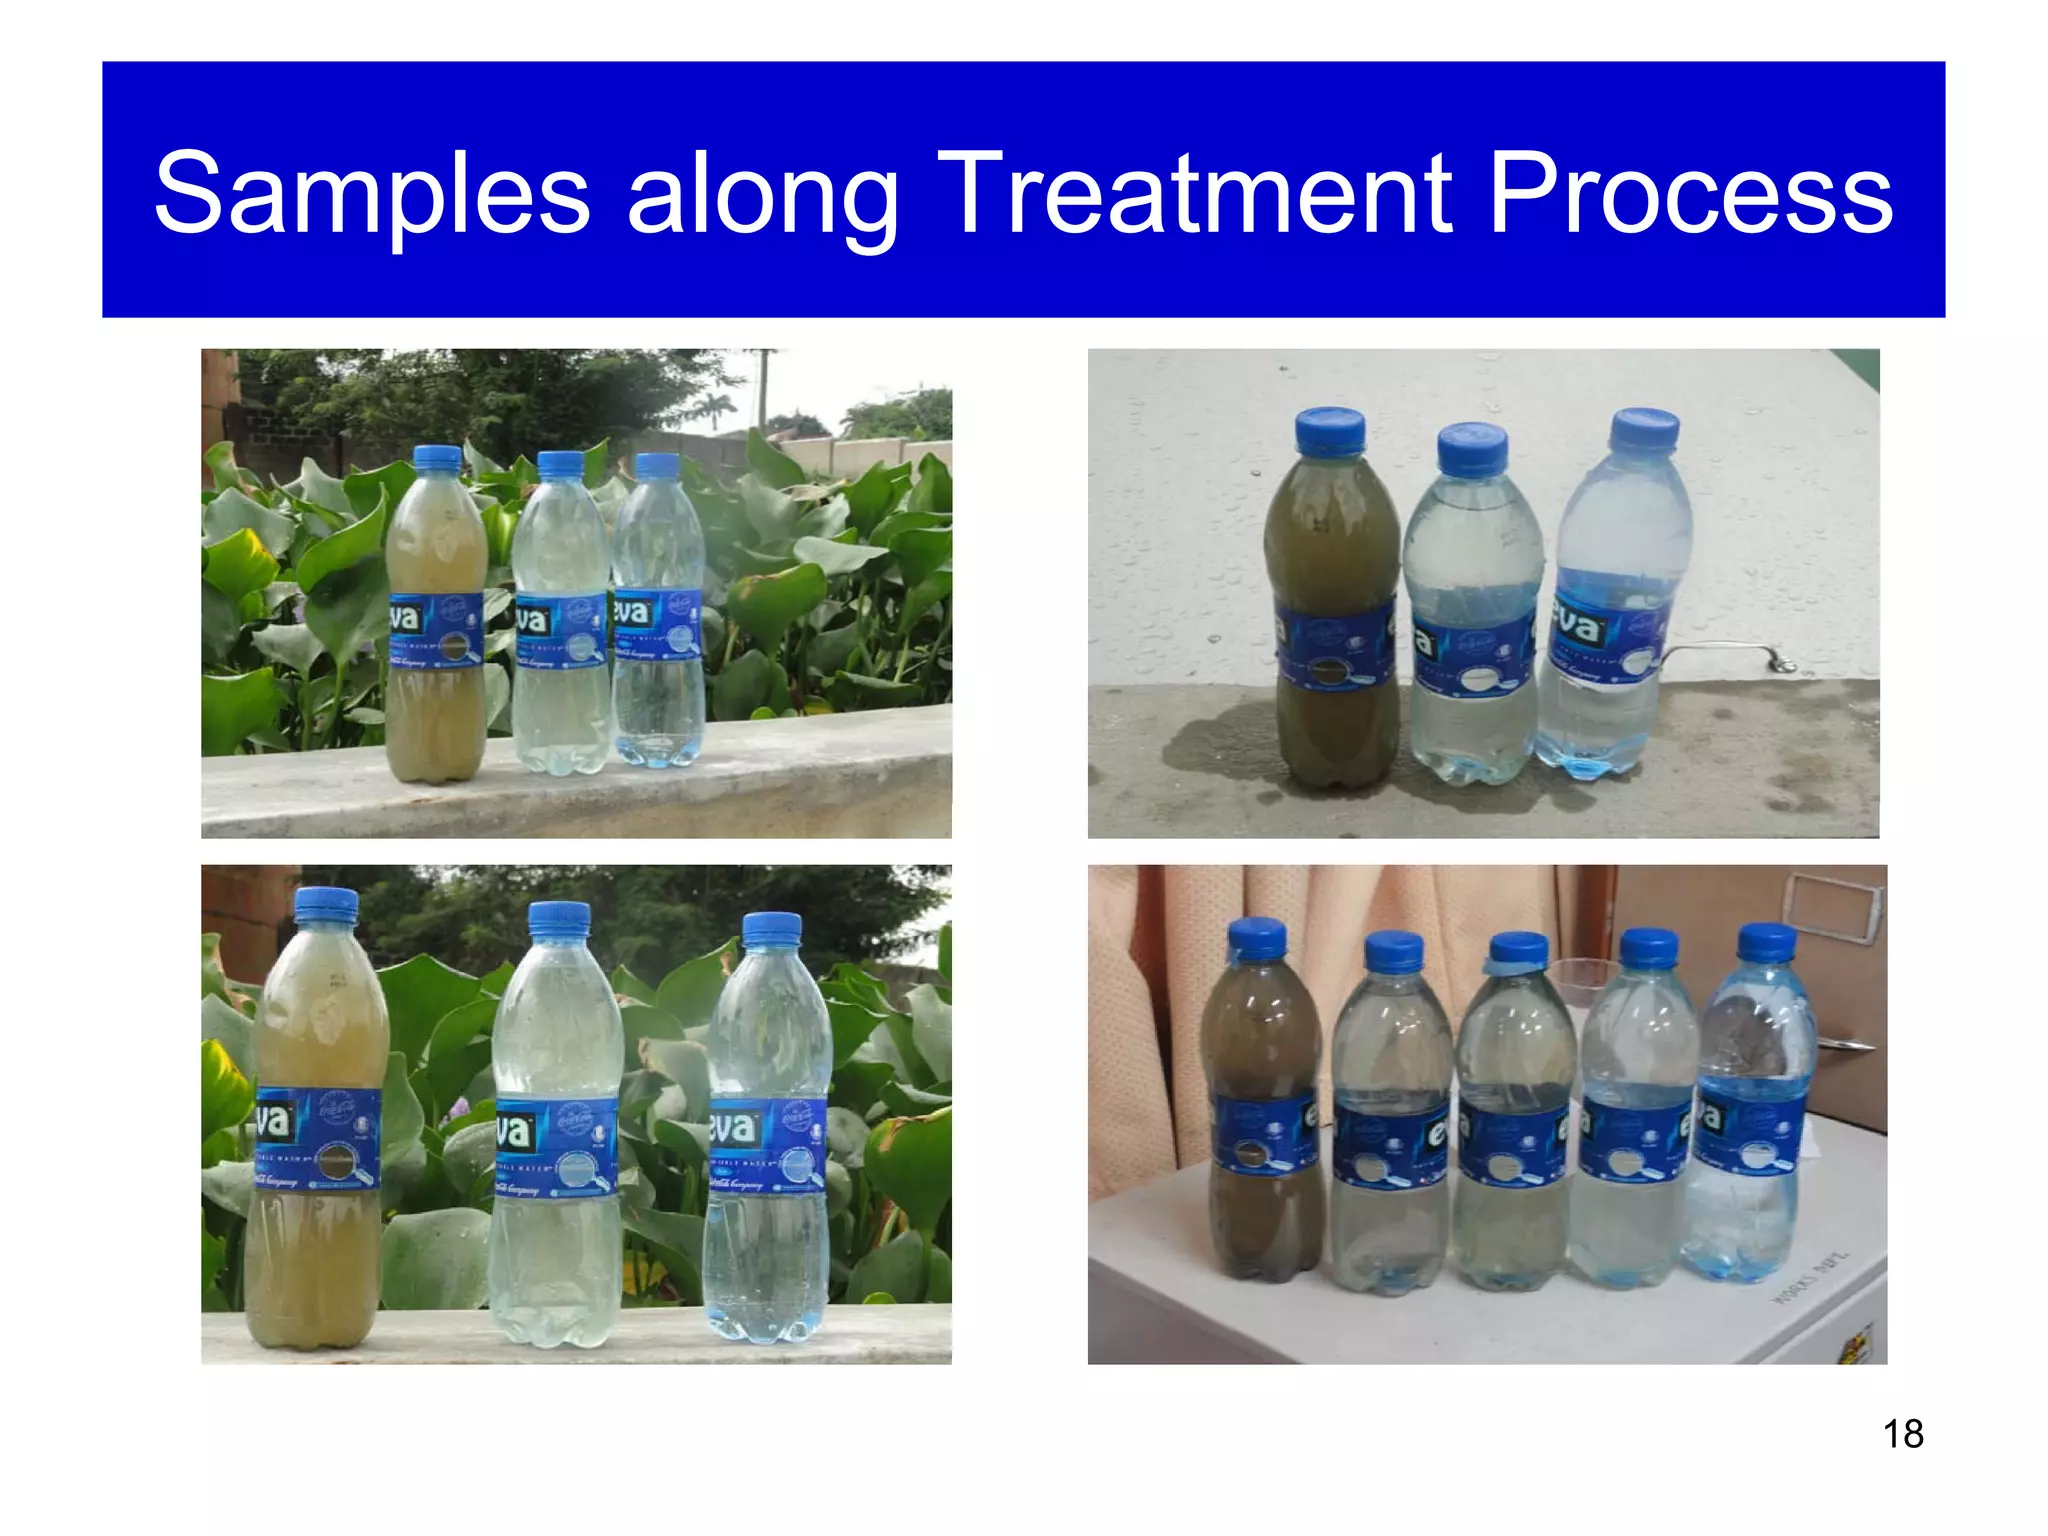
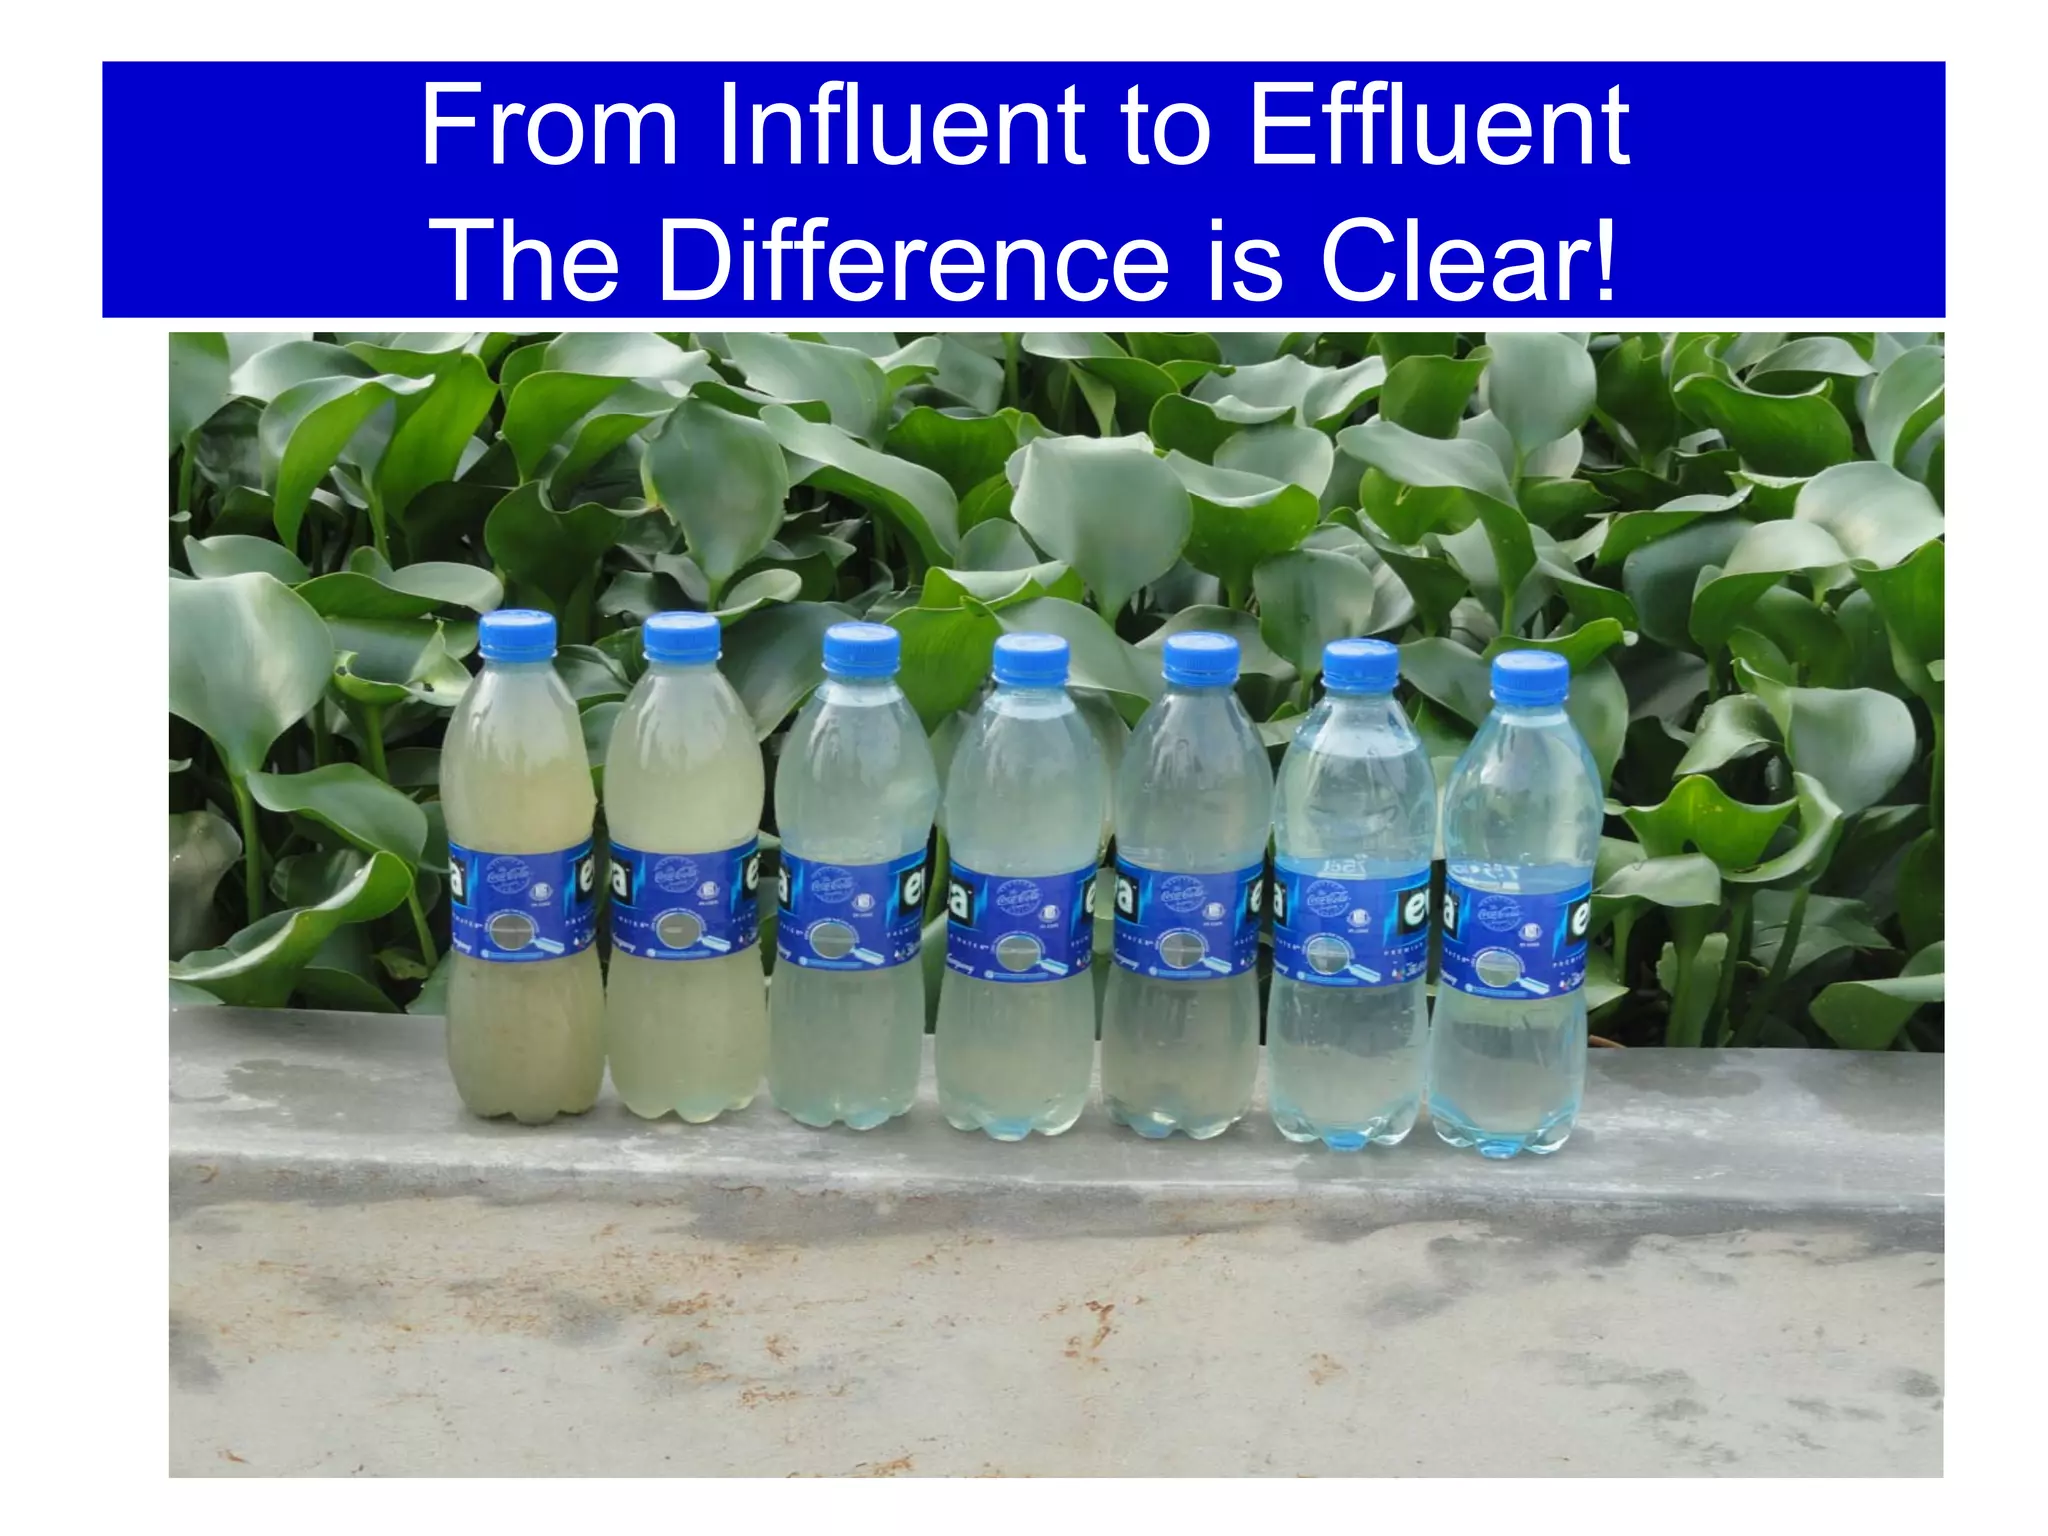


The document describes a study that examined using water hyacinth in constructed wetlands to treat domestic sewage in Nigeria. Water hyacinth was planted in 6 beds that received sewage from a university. Samples were taken weekly for 24 weeks. Results showed large reductions in key pollutants: color (100%), turbidity (92.95%), BOD (84%), TDS (88%), nitrates (76%), phosphates (87%), and E. coli (99.65%). Water hyacinth growth increased exponentially, with the largest growth and best sewage treatment in the last beds. The system provided effective and low-cost sewage treatment using a natural method.


![Vibe Coding vs. Spec-Driven Development [Free Meetup]](https://cdn.slidesharecdn.com/ss_thumbnails/vibecodingvsspecdrivendevelopment-251209105622-43f455e7-thumbnail.jpg?width=640&height=640&fit=bounds)


