Download as PDF, PPTX


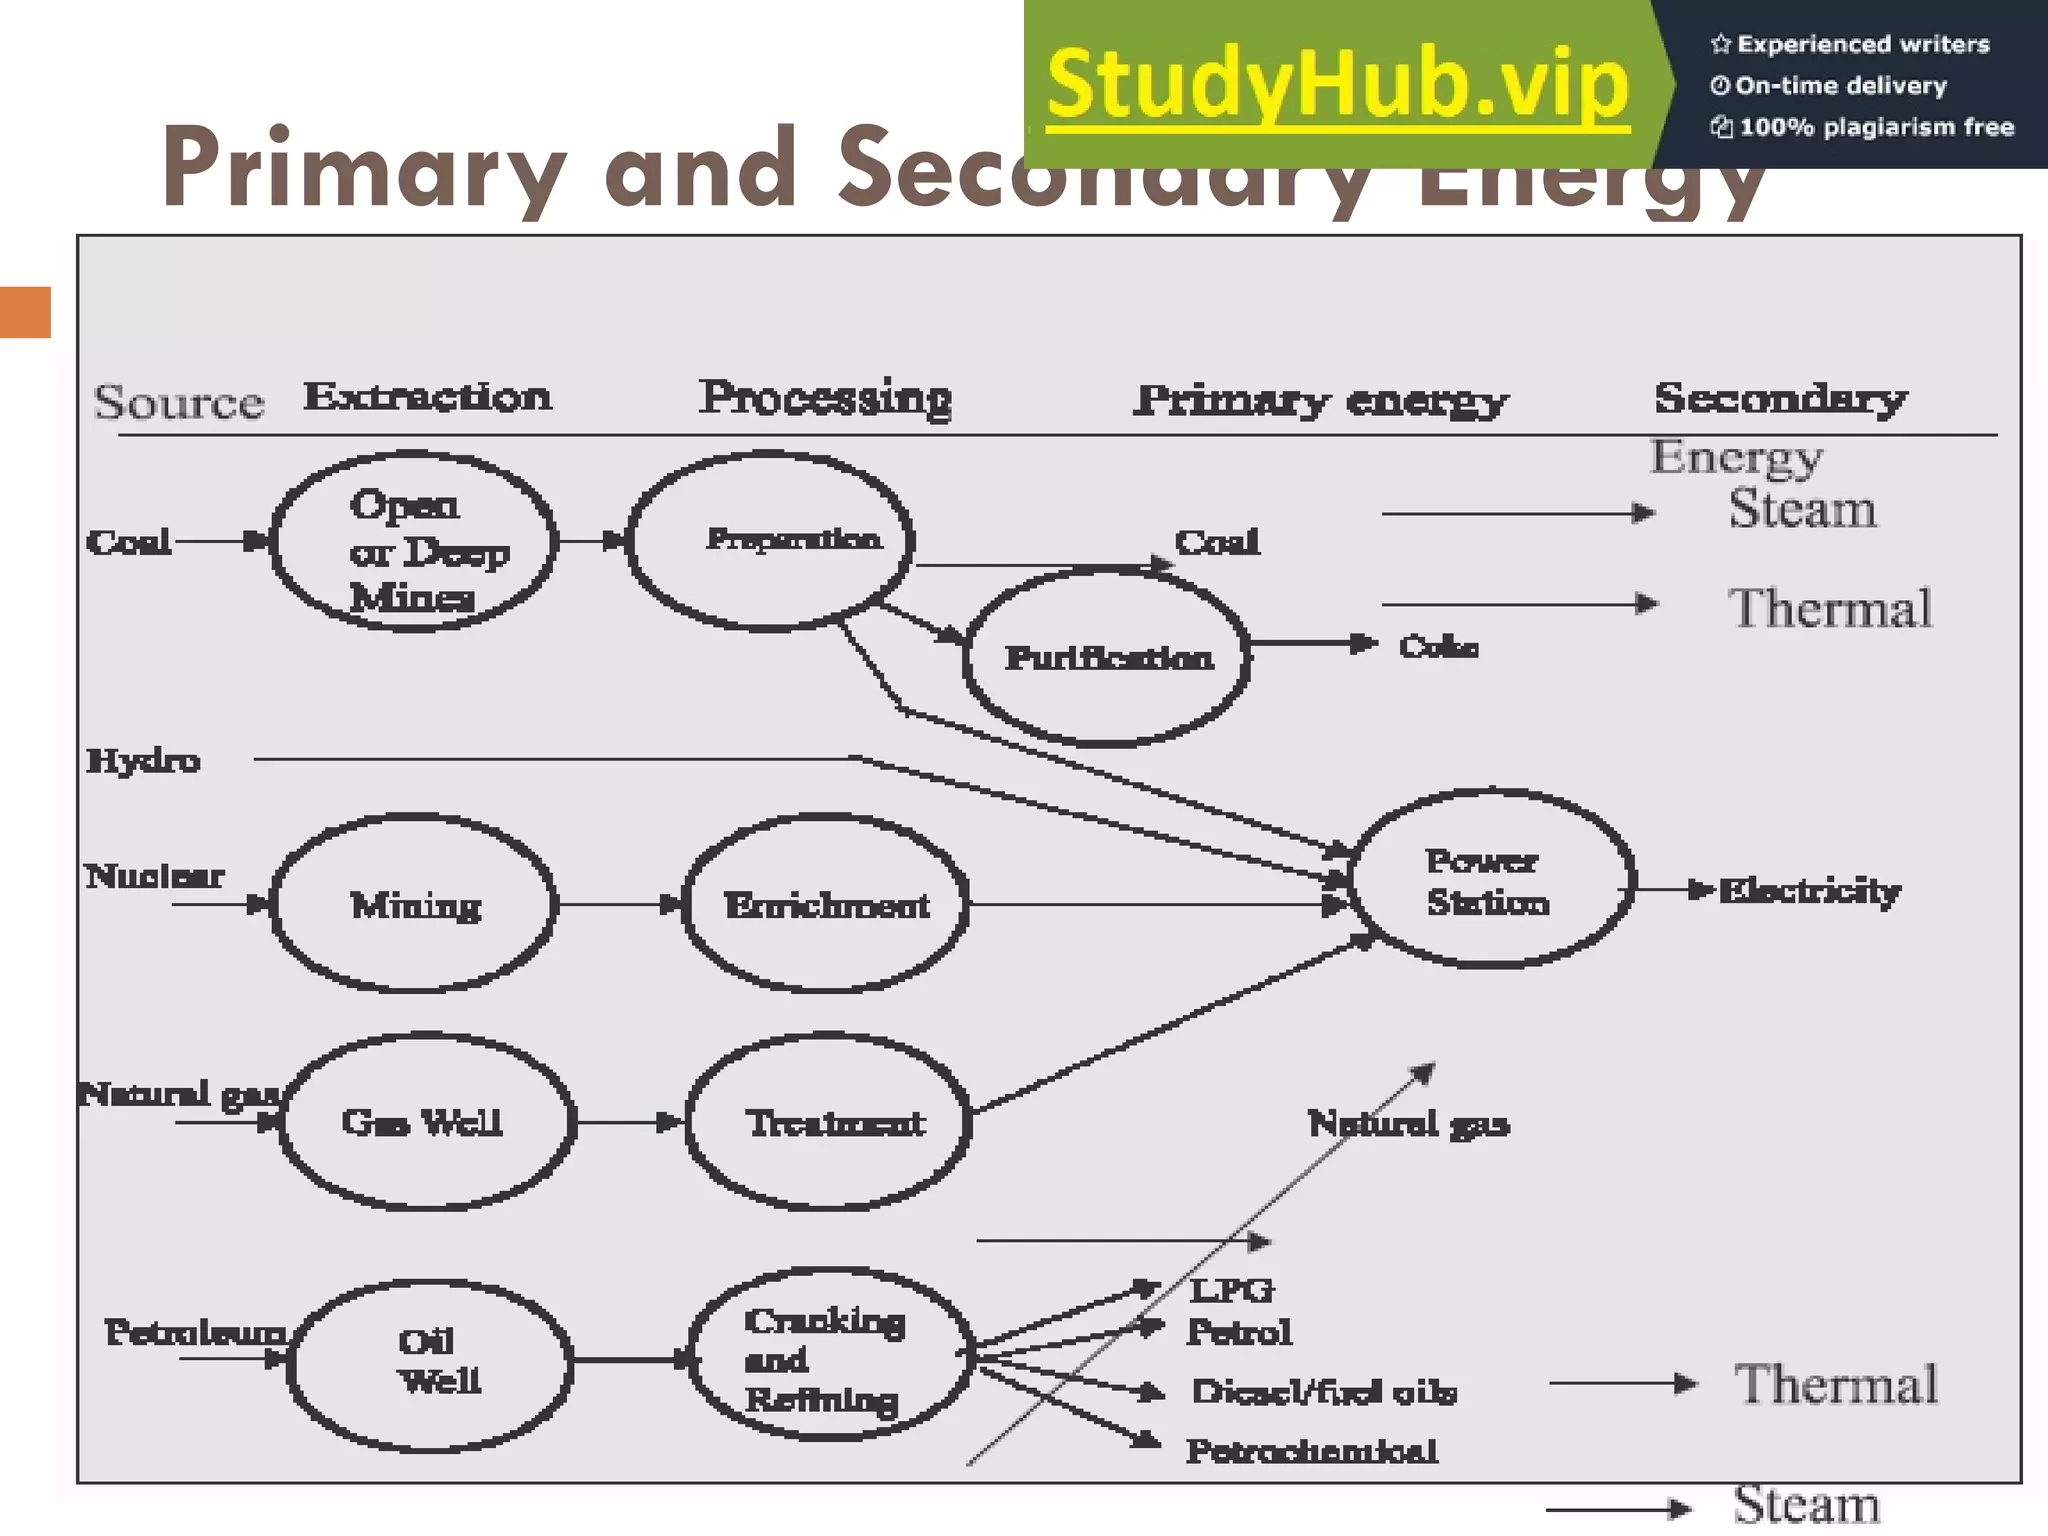


This document discusses various aspects of alternative energy sources including classifications of energy sources, primary and secondary energy, renewable and non-renewable sources, and conventional and non-conventional energy. It notes that primary energy sources include coal, oil, natural gas, biomass, nuclear, geothermal, and others. Secondary energy is derived from primary sources through industrial processes. Conventional sources are traditionally used fossil fuels and hydro/nuclear, while non-conventional sources developed after 1973 include solar, wind, and biomass. The document also discusses global energy reserves and consumption as well as India's energy scenario and the need to explore alternative sources due to depletion of fossil fuels and environmental impacts.


