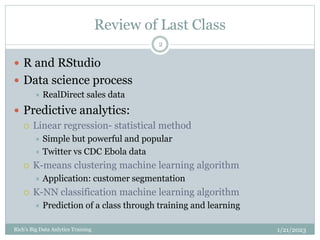
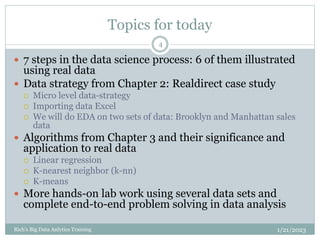
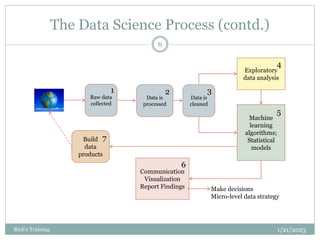
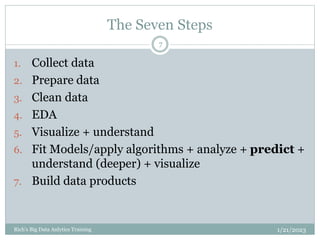
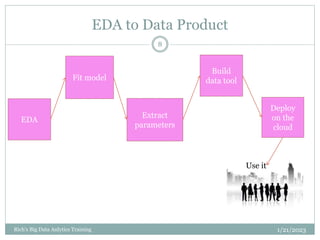
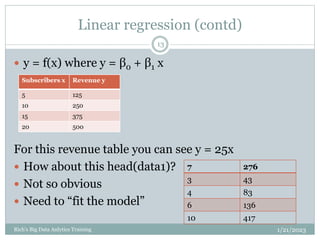
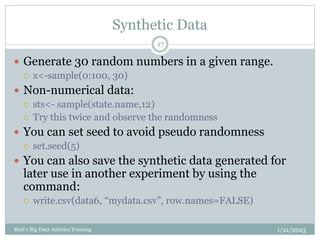
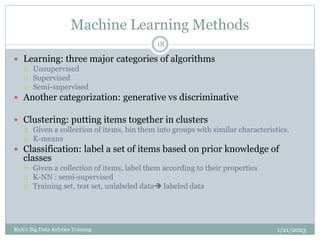
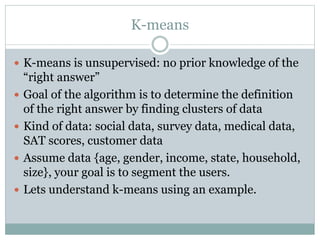
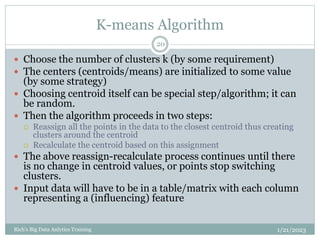
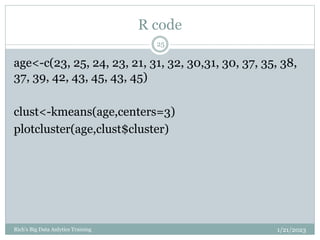
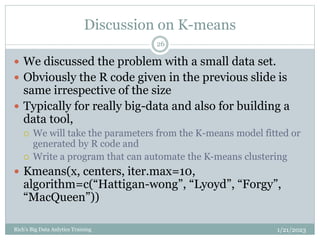
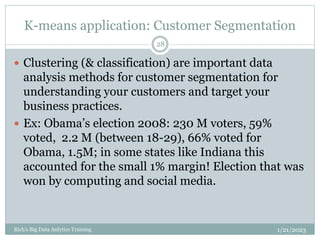
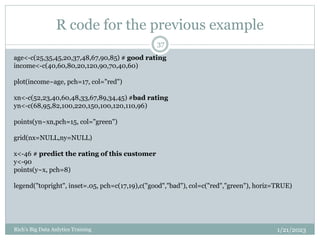
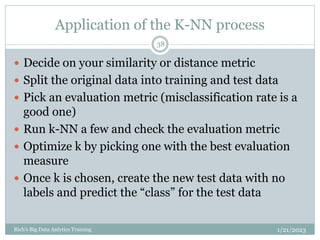
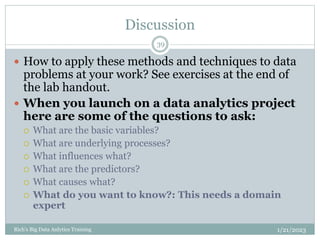
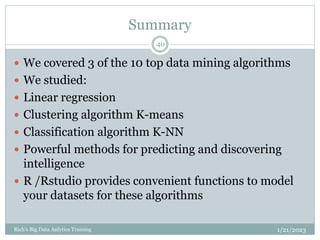
B . R A M A M U R T H Y
Statistical Models and Machine
Learning Algorithms
1/21/2023
Rich's Big Data Anlytics Training
1
Review of Last Class
1/21/2023
Rich's Big Data Anlytics Training
2
 R and RStudio
 Data science process
 RealDirect sales data
 Predictive analytics:
 Linear regression- statistical method
 Simple but powerful and popular
 Twitter vs CDC Ebola data
 K-means clustering machine learning algorithm
 Application: customer segmentation
 K-NN classification machine learning algorithm
 Prediction of a class through training and learning
What is in pch?
1/21/2023
Rich's Big Data Anlytics Training
3
Topics for today
1/21/2023
Rich's Big Data Anlytics Training
4
 7 steps in the data science process: 6 of them illustrated
using real data
 Data strategy from Chapter 2: Realdirect case study
 Micro level data-strategy
 Importing data Excel
 We will do EDA on two sets of data: Brooklyn and Manhattan sales
data
 Algorithms from Chapter 3 and their significance and
application to real data
 Linear regression
 K-nearest neighbor (k-nn)
 K-means
 More hands-on lab work using several data sets and
complete end-to-end problem solving in data analysis
Transforming data into analytics
Strategies/decisions
6/28/2014
CSE651C, B. Ramamurthy
5
Food services
data
Social/
media
data/
web data
Probability-
Statistics-
Stochastic
Randomness,
Uncertainty
Machine
learning
algorithms
Results
Decisions
Diagnosis
Strategies
Vertical domain
Horizontal domain
The Data Science Process (contd.)
1/21/2023
Rich's Training
6
Raw data
collected
Exploratory
data analysis
Machine
learning
algorithms;
Statistical
models
Build
data
products
Communication
Visualization
Report Findings Make decisions
Micro-level data strategy
Data is
processed
Data is
cleaned
1 2 3
4
5
6
7
The Seven Steps
1/21/2023
Rich's Big Data Anlytics Training
7
1. Collect data
2. Prepare data
3. Clean data
4. EDA
5. Visualize + understand
6. Fit Models/apply algorithms + analyze + predict +
understand (deeper) + visualize
7. Build data products
EDA to Data Product
1/21/2023
Rich's Big Data Anlytics Training
8
EDA
Fit model
Extract
parameters
Build
data tool
Deploy
on the
cloud
Use it
Today’s Lab
1/21/2023
Rich's Big Data Anlytics Training
9
 We will illustrate the three algorithms using simple
exercises
 You may need to install several packages within R
Studio, as and when needed
 We will also explore 6 of the 7 steps in the data
science process using two applications
Plots, Graphs and Models
1/21/2023
Rich's Big Data Anlytics Training
10
 Plots, graphs, maps provide the ability to visualize data
and the results of model fitting
 Models provide you parameters that you can use to
 Get a deeper understanding of the data characteristics
 Build data tools based on the parameter so that you automate the
analysis
 Algorithms drive the model (fitting) of your data
 For example,
 if your guess is a linear relationship for the data, then use linear
regression;
 if you want to see clusters in your data you can use K-means;
 if you want to classify the data into classes then you may want to use
K-NN
Algorithms
1/21/2023
Rich's Big Data Anlytics Training
11
 Three types of algorithms:
1. Data munging or data engineering or data
wrangling: mapping raw and dirty data to a format that is
usable in tools for analysis.
a) By some estimates (NYT) this is about 50% of a data scientists
time.
b) Start-ups to do this kind of work: re-package data and sell it.
2. Optimization algorithms for parameter estimation: Least
squares, Newton’s methods, Stochastic gradients descent
a) R has many functions readily available do to this
b) Example: lsfit(x, y, … tolerance = 1e-07,…)
3. Machine Learning algorithms
a) Used to predict, classify and cluster
Linear Regression
1/21/2023
Rich's Big Data Anlytics Training
12
 Vey simple, easy to understand
 Expresses the relationship between two
variables/attributes
 You assume a linear relationship between an
outcome variable (dependent variable, response
variable/ label) and the predictor(s) (independent
variables, features, explanatory variables)
Examples: company sales vs money spent on ads
Number of friends vs time spent on social media
Linear regression (contd)
1/21/2023
Rich's Big Data Anlytics Training
13
 y = f(x) where y = β0 + β1 x
For this revenue table you can see y = 25x
 How about this head(data1)?
 Not so obvious
 Need to “fit the model”
Subscribers x Revenue y
5 125
10 250
15 375
20 500
7 276
3 43
4 83
6 136
10 417
Fitting the model
1/21/2023
Rich's Big Data Anlytics Training
14
 Least squares method to improve the fit
 We will now look at R exercise for linear regression
and extract the parameters
 Fitted model can be evaluated and can be refined or
updated.
 Many variations of linear regression exists and can
be used as the need arises for these.
Multiple Regression
1/21/2023
Rich's Big Data Anlytics Training
15
 Regression with multiple predictors
 y = β0+ β1.x1 + β2.x2+.. + Є
 We are considering data table/frame of one dependent
variable y, and multiple independent variables.
 Model fitting using R.
model<- lm(y ~ x0+x1+x2)
model <-lm(y ~ x0+x1+x2*x3) where predictors x2 and x3
have interaction between them.
Example: y :
price of oil ~
x1= # full oil storage tanks, x2= #half tanks, x3= #empty tanks
Synthetic data
1/21/2023
Rich's Big Data Anlytics Training
16
 You can generate synthetic data to explore, learn
and/or hypothesize and evaluate a certain model
 Usually the generating functions for random number
is “r” followed by distribution function.
 Examples:
 runif(10,0.0,100.0) # generate 10 numbers between 0.0 and
100.0 : uniform distribution
 rpois(100,56)# generate 100 numbers with mean of 56
according to Poisson distribution
 rnorm(100,mean=56,sd=9) # generate 100 numbers with
mean 56, std.dev 9, according to Normal distribution
Synthetic Data
1/21/2023
Rich's Big Data Anlytics Training
17
 Generate 30 random numbers in a given range.
 x<-sample(0:100, 30)
 Non-numerical data:
 sts<- sample(state.name,12)
 Try this twice and observe the randomness
 You can set seed to avoid pseudo randomness
 set.seed(5)
 You can also save the synthetic data generated for
later use in another experiment by using the
command:
 write.csv(data6, “mydata.csv”, row.names=FALSE)
Machine Learning Methods
1/21/2023
Rich's Big Data Anlytics Training
18
 Learning: three major categories of algorithms
 Unsupervised
 Supervised
 Semi-supervised
 Another categorization: generative vs discriminative
 Clustering: putting items together in clusters
 Given a collection of items, bin them into groups with similar characteristics.
 K-means
 Classification: label a set of items based on prior knowledge of
classes
 Given a collection of items, label them according to their properties
 K-NN : semi-supervised
 Training set, test set, unlabeled data labeled data
K-means
 K-means is unsupervised: no prior knowledge of the
“right answer”
 Goal of the algorithm is to determine the definition
of the right answer by finding clusters of data
 Kind of data: social data, survey data, medical data,
SAT scores, customer data
 Assume data {age, gender, income, state, household,
size}, your goal is to segment the users.
 Lets understand k-means using an example.
K-means Algorithm
1/21/2023
Rich's Big Data Anlytics Training
20
 Choose the number of clusters k (by some requirement)
 The centers (centroids/means) are initialized to some value
(by some strategy)
 Choosing centroid itself can be special step/algorithm; it can
be random.
 Then the algorithm proceeds in two steps:
 Reassign all the points in the data to the closest centroid thus creating
clusters around the centroid
 Recalculate the centroid based on this assignment
 The above reassign-recalculate process continues until there
is no change in centroid values, or points stop switching
clusters.
 Input data will have to be in a table/matrix with each column
representing a (influencing) feature
Theory Behind K-means
1/21/2023
Rich's Big Data Anlytics Training
21
 K-means searches for the minimum sum of squares
assignment;
 It minimizes unnormalized variance (=total_SS) by
assigning points to cluster centers.
 In order for k-means to converge, two conditions are
considered:
 Re-assigning points reduces the sum of squares
 Re-computing the mean reduces the sum of squares
 As there is only finite number of combinations, you
cannot infinitely reduce this value and the algorithm
must converge at some point to a local optimum.
 Good measure of convergence: between_SS/total_SS
K-means Theory (contd.)
1/21/2023
Rich's Big Data Anlytics Training
22
 Functional principal component analysis
 K-means algorithm is not distance based; it
minimizes the variances to arrive a cluster.
 That’s why the axes are labeled by the discriminating
component value.
Lets examine an example
 {Age, income range, education, skills, social, paid
work}
 Lets take just the age { 23, 25, 24, 23, 21, 31, 32,
30,31, 30, 37, 35, 38, 37, 39, 42, 43, 45, 43, 45}
 Classify this data using K-means
 Lets assume K = 3 or 3 groups
 Give me a guess of the centroids?
Results for K=3
1/21/2023
Rich's Big Data Anlytics Training
24
R code
1/21/2023
Rich's Big Data Anlytics Training
25
age<-c(23, 25, 24, 23, 21, 31, 32, 30,31, 30, 37, 35, 38,
37, 39, 42, 43, 45, 43, 45)
clust<-kmeans(age,centers=3)
plotcluster(age,clust$cluster)
Discussion on K-means
1/21/2023
Rich's Big Data Anlytics Training
26
 We discussed the problem with a small data set.
 Obviously the R code given in the previous slide is
same irrespective of the size
 Typically for really big-data and also for building a
data tool,
 We will take the parameters from the K-means model fitted or
generated by R code and
 Write a program that can automate the K-means clustering
 Kmeans(x, centers, iter.max=10,
algorithm=c(“Hattigan-wong”, “Lyoyd”, “Forgy”,
“MacQueen”))
R Data sets
1/21/2023
Rich's Big Data Anlytics Training
27
 Anderson’s Iris dataset is a very popular dataset
available with R package
 The iris data set gives the measurements in
centimeters of the variables sepal length and width
and petal length and width, respectively, for 50
flowers from each of 3 species of iris. The species are
Iris setosa , versicolor, and virginica (coded 1, 2 and
3 respectively, some times)
K-means application: Customer Segmentation
1/21/2023
Rich's Big Data Anlytics Training
28
 Clustering (& classification) are important data
analysis methods for customer segmentation for
understanding your customers and target your
business practices.
 Ex: Obama’s election 2008: 230 M voters, 59%
voted, 2.2 M (between 18-29), 66% voted for
Obama, 1.5M; in some states like Indiana this
accounted for the small 1% margin! Election that was
won by computing and social media.
K-NN
 Semi-supervised ML
 You know the “right answers” or at least data that is
“labeled”: training set
 Set of objects have been classified or labeled (training
set)
 Another set of objects are yet to be labeled or classified
(test set)
 Your goal is to automate the processes of labeling the test
set.
 Intuition behind k-NN is to consider most similar items
--- similarity defined by their attributes, look at the
existing label and assign the object a label.
K-NN Classification
1/21/2023
Rich's Big Data Anlytics Training
30
 A set of objects have been classified or labeled in
some way
 Other similar objects with unknown class need to be
labeled / classified
 Goal of a classification algorithm (K-NN) is to
automatically label these objects
 NN stands for nearest neighbor
 How do you determine the closeness? Euclidian
distance; color, shape or similar features.
Example2
1/21/2023
Rich's Big Data Anlytics Training
31
Label1
Label2
What is class of
unknown item
indicated by green
circle?
(i) K = 3
(ii) K =5
Intuition (K = 3)
1/21/2023
Rich's Big Data Anlytics Training
32
Label1
Label2
What is class of
unknown object
indicated by green
circle?
(i) K = 3
The unknown object gets 2 votes and 1 vote
label of unclassified object is
Intuition (K = 5)
1/21/2023
Rich's Big Data Anlytics Training
33
Label1
Label2
What is the class of
unknown object
indicated by green
circle?
(i) K = 5
The unknown object gets 2 votes and 3 votes
 label of unknown object is
Discussion on K-NN
1/21/2023
Rich's Big Data Anlytics Training
34
 How do you select K, the number of voters/objects
with known labels?
 Three phases: training, test and
classification/labeling of actual data
 Lets generate some synthetic data and experiment
with K-NN.
Different Values of K
1/21/2023
Rich's Big Data Anlytics Training
35
K-NN application: Credit Rating
1/21/2023
Rich's Big Data Anlytics Training
36
 Predict credit rating as “good” or “bad” based on a
set of known data
R code for the previous example
1/21/2023
Rich's Big Data Anlytics Training
37
age<-c(25,35,45,20,37,48,67,90,85) # good rating
income<-c(40,60,80,20,120,90,70,40,60)
plot(income~age, pch=17, col="red")
xn<-c(52,23,40,60,48,33,67,89,34,45) #bad rating
yn<-c(68,95,82,100,220,150,100,120,110,96)
points(yn~xn,pch=15, col="green")
grid(nx=NULL,ny=NULL)
x<-46 # predict the rating of this customer
y<-90
points(y~x, pch=8)
legend("topright", inset=.05, pch=c(17,19),c("good","bad"), col=c("red","green"), horiz=TRUE)
Application of the K-NN process
1/21/2023
Rich's Big Data Anlytics Training
38
 Decide on your similarity or distance metric
 Split the original data into training and test data
 Pick an evaluation metric (misclassification rate is a
good one)
 Run k-NN a few and check the evaluation metric
 Optimize k by picking one with the best evaluation
measure
 Once k is chosen, create the new test data with no
labels and predict the “class” for the test data
Discussion
1/21/2023
Rich's Big Data Anlytics Training
39
 How to apply these methods and techniques to data
problems at your work? See exercises at the end of
the lab handout.
 When you launch on a data analytics project
here are some of the questions to ask:
 What are the basic variables?
 What are underlying processes?
 What influences what?
 What are the predictors?
 What causes what?
 What do you want to know?: This needs a domain
expert
Summary
1/21/2023
Rich's Big Data Anlytics Training
40
 We covered 3 of the 10 top data mining algorithms
 We studied:
 Linear regression
 Clustering algorithm K-means
 Classification algorithm K-NN
 Powerful methods for predicting and discovering
intelligence
 R /Rstudio provides convenient functions to model
your datasets for these algorithms
References
1/21/2023
Rich's Big Data Anlytics Training
41
1. N. Harris, Visualizing K-means Clustering,
http://www.naftaliharris.com/blog/visualizing-k-
means-clustering/, 2014.
2. Example figure, http://en.wikipedia.org/wiki/K-
nearest_neighbors_algorithm, 2014
3. R Nutshell online version of the book:
http://web.udl.es/Biomath/Bioestadistica/R/Man
uals/r_in_a_nutshell.pdf

AlgorithmsModelsNov13.pptx

  • 1.
    B . RA M A M U R T H Y Statistical Models and Machine Learning Algorithms 1/21/2023 Rich's Big Data Anlytics Training 1
  • 2.
    Review of LastClass 1/21/2023 Rich's Big Data Anlytics Training 2  R and RStudio  Data science process  RealDirect sales data  Predictive analytics:  Linear regression- statistical method  Simple but powerful and popular  Twitter vs CDC Ebola data  K-means clustering machine learning algorithm  Application: customer segmentation  K-NN classification machine learning algorithm  Prediction of a class through training and learning
  • 3.
    What is inpch? 1/21/2023 Rich's Big Data Anlytics Training 3
  • 4.
    Topics for today 1/21/2023 Rich'sBig Data Anlytics Training 4  7 steps in the data science process: 6 of them illustrated using real data  Data strategy from Chapter 2: Realdirect case study  Micro level data-strategy  Importing data Excel  We will do EDA on two sets of data: Brooklyn and Manhattan sales data  Algorithms from Chapter 3 and their significance and application to real data  Linear regression  K-nearest neighbor (k-nn)  K-means  More hands-on lab work using several data sets and complete end-to-end problem solving in data analysis
  • 5.
    Transforming data intoanalytics Strategies/decisions 6/28/2014 CSE651C, B. Ramamurthy 5 Food services data Social/ media data/ web data Probability- Statistics- Stochastic Randomness, Uncertainty Machine learning algorithms Results Decisions Diagnosis Strategies Vertical domain Horizontal domain
  • 6.
    The Data ScienceProcess (contd.) 1/21/2023 Rich's Training 6 Raw data collected Exploratory data analysis Machine learning algorithms; Statistical models Build data products Communication Visualization Report Findings Make decisions Micro-level data strategy Data is processed Data is cleaned 1 2 3 4 5 6 7
  • 7.
    The Seven Steps 1/21/2023 Rich'sBig Data Anlytics Training 7 1. Collect data 2. Prepare data 3. Clean data 4. EDA 5. Visualize + understand 6. Fit Models/apply algorithms + analyze + predict + understand (deeper) + visualize 7. Build data products
  • 8.
    EDA to DataProduct 1/21/2023 Rich's Big Data Anlytics Training 8 EDA Fit model Extract parameters Build data tool Deploy on the cloud Use it
  • 9.
    Today’s Lab 1/21/2023 Rich's BigData Anlytics Training 9  We will illustrate the three algorithms using simple exercises  You may need to install several packages within R Studio, as and when needed  We will also explore 6 of the 7 steps in the data science process using two applications
  • 10.
    Plots, Graphs andModels 1/21/2023 Rich's Big Data Anlytics Training 10  Plots, graphs, maps provide the ability to visualize data and the results of model fitting  Models provide you parameters that you can use to  Get a deeper understanding of the data characteristics  Build data tools based on the parameter so that you automate the analysis  Algorithms drive the model (fitting) of your data  For example,  if your guess is a linear relationship for the data, then use linear regression;  if you want to see clusters in your data you can use K-means;  if you want to classify the data into classes then you may want to use K-NN
  • 11.
    Algorithms 1/21/2023 Rich's Big DataAnlytics Training 11  Three types of algorithms: 1. Data munging or data engineering or data wrangling: mapping raw and dirty data to a format that is usable in tools for analysis. a) By some estimates (NYT) this is about 50% of a data scientists time. b) Start-ups to do this kind of work: re-package data and sell it. 2. Optimization algorithms for parameter estimation: Least squares, Newton’s methods, Stochastic gradients descent a) R has many functions readily available do to this b) Example: lsfit(x, y, … tolerance = 1e-07,…) 3. Machine Learning algorithms a) Used to predict, classify and cluster
  • 12.
    Linear Regression 1/21/2023 Rich's BigData Anlytics Training 12  Vey simple, easy to understand  Expresses the relationship between two variables/attributes  You assume a linear relationship between an outcome variable (dependent variable, response variable/ label) and the predictor(s) (independent variables, features, explanatory variables) Examples: company sales vs money spent on ads Number of friends vs time spent on social media
  • 13.
    Linear regression (contd) 1/21/2023 Rich'sBig Data Anlytics Training 13  y = f(x) where y = β0 + β1 x For this revenue table you can see y = 25x  How about this head(data1)?  Not so obvious  Need to “fit the model” Subscribers x Revenue y 5 125 10 250 15 375 20 500 7 276 3 43 4 83 6 136 10 417
  • 14.
    Fitting the model 1/21/2023 Rich'sBig Data Anlytics Training 14  Least squares method to improve the fit  We will now look at R exercise for linear regression and extract the parameters  Fitted model can be evaluated and can be refined or updated.  Many variations of linear regression exists and can be used as the need arises for these.
  • 15.
    Multiple Regression 1/21/2023 Rich's BigData Anlytics Training 15  Regression with multiple predictors  y = β0+ β1.x1 + β2.x2+.. + Є  We are considering data table/frame of one dependent variable y, and multiple independent variables.  Model fitting using R. model<- lm(y ~ x0+x1+x2) model <-lm(y ~ x0+x1+x2*x3) where predictors x2 and x3 have interaction between them. Example: y : price of oil ~ x1= # full oil storage tanks, x2= #half tanks, x3= #empty tanks
  • 16.
    Synthetic data 1/21/2023 Rich's BigData Anlytics Training 16  You can generate synthetic data to explore, learn and/or hypothesize and evaluate a certain model  Usually the generating functions for random number is “r” followed by distribution function.  Examples:  runif(10,0.0,100.0) # generate 10 numbers between 0.0 and 100.0 : uniform distribution  rpois(100,56)# generate 100 numbers with mean of 56 according to Poisson distribution  rnorm(100,mean=56,sd=9) # generate 100 numbers with mean 56, std.dev 9, according to Normal distribution
  • 17.
    Synthetic Data 1/21/2023 Rich's BigData Anlytics Training 17  Generate 30 random numbers in a given range.  x<-sample(0:100, 30)  Non-numerical data:  sts<- sample(state.name,12)  Try this twice and observe the randomness  You can set seed to avoid pseudo randomness  set.seed(5)  You can also save the synthetic data generated for later use in another experiment by using the command:  write.csv(data6, “mydata.csv”, row.names=FALSE)
  • 18.
    Machine Learning Methods 1/21/2023 Rich'sBig Data Anlytics Training 18  Learning: three major categories of algorithms  Unsupervised  Supervised  Semi-supervised  Another categorization: generative vs discriminative  Clustering: putting items together in clusters  Given a collection of items, bin them into groups with similar characteristics.  K-means  Classification: label a set of items based on prior knowledge of classes  Given a collection of items, label them according to their properties  K-NN : semi-supervised  Training set, test set, unlabeled data labeled data
  • 19.
    K-means  K-means isunsupervised: no prior knowledge of the “right answer”  Goal of the algorithm is to determine the definition of the right answer by finding clusters of data  Kind of data: social data, survey data, medical data, SAT scores, customer data  Assume data {age, gender, income, state, household, size}, your goal is to segment the users.  Lets understand k-means using an example.
  • 20.
    K-means Algorithm 1/21/2023 Rich's BigData Anlytics Training 20  Choose the number of clusters k (by some requirement)  The centers (centroids/means) are initialized to some value (by some strategy)  Choosing centroid itself can be special step/algorithm; it can be random.  Then the algorithm proceeds in two steps:  Reassign all the points in the data to the closest centroid thus creating clusters around the centroid  Recalculate the centroid based on this assignment  The above reassign-recalculate process continues until there is no change in centroid values, or points stop switching clusters.  Input data will have to be in a table/matrix with each column representing a (influencing) feature
  • 21.
    Theory Behind K-means 1/21/2023 Rich'sBig Data Anlytics Training 21  K-means searches for the minimum sum of squares assignment;  It minimizes unnormalized variance (=total_SS) by assigning points to cluster centers.  In order for k-means to converge, two conditions are considered:  Re-assigning points reduces the sum of squares  Re-computing the mean reduces the sum of squares  As there is only finite number of combinations, you cannot infinitely reduce this value and the algorithm must converge at some point to a local optimum.  Good measure of convergence: between_SS/total_SS
  • 22.
    K-means Theory (contd.) 1/21/2023 Rich'sBig Data Anlytics Training 22  Functional principal component analysis  K-means algorithm is not distance based; it minimizes the variances to arrive a cluster.  That’s why the axes are labeled by the discriminating component value.
  • 23.
    Lets examine anexample  {Age, income range, education, skills, social, paid work}  Lets take just the age { 23, 25, 24, 23, 21, 31, 32, 30,31, 30, 37, 35, 38, 37, 39, 42, 43, 45, 43, 45}  Classify this data using K-means  Lets assume K = 3 or 3 groups  Give me a guess of the centroids?
  • 24.
    Results for K=3 1/21/2023 Rich'sBig Data Anlytics Training 24
  • 25.
    R code 1/21/2023 Rich's BigData Anlytics Training 25 age<-c(23, 25, 24, 23, 21, 31, 32, 30,31, 30, 37, 35, 38, 37, 39, 42, 43, 45, 43, 45) clust<-kmeans(age,centers=3) plotcluster(age,clust$cluster)
  • 26.
    Discussion on K-means 1/21/2023 Rich'sBig Data Anlytics Training 26  We discussed the problem with a small data set.  Obviously the R code given in the previous slide is same irrespective of the size  Typically for really big-data and also for building a data tool,  We will take the parameters from the K-means model fitted or generated by R code and  Write a program that can automate the K-means clustering  Kmeans(x, centers, iter.max=10, algorithm=c(“Hattigan-wong”, “Lyoyd”, “Forgy”, “MacQueen”))
  • 27.
    R Data sets 1/21/2023 Rich'sBig Data Anlytics Training 27  Anderson’s Iris dataset is a very popular dataset available with R package  The iris data set gives the measurements in centimeters of the variables sepal length and width and petal length and width, respectively, for 50 flowers from each of 3 species of iris. The species are Iris setosa , versicolor, and virginica (coded 1, 2 and 3 respectively, some times)
  • 28.
    K-means application: CustomerSegmentation 1/21/2023 Rich's Big Data Anlytics Training 28  Clustering (& classification) are important data analysis methods for customer segmentation for understanding your customers and target your business practices.  Ex: Obama’s election 2008: 230 M voters, 59% voted, 2.2 M (between 18-29), 66% voted for Obama, 1.5M; in some states like Indiana this accounted for the small 1% margin! Election that was won by computing and social media.
  • 29.
    K-NN  Semi-supervised ML You know the “right answers” or at least data that is “labeled”: training set  Set of objects have been classified or labeled (training set)  Another set of objects are yet to be labeled or classified (test set)  Your goal is to automate the processes of labeling the test set.  Intuition behind k-NN is to consider most similar items --- similarity defined by their attributes, look at the existing label and assign the object a label.
  • 30.
    K-NN Classification 1/21/2023 Rich's BigData Anlytics Training 30  A set of objects have been classified or labeled in some way  Other similar objects with unknown class need to be labeled / classified  Goal of a classification algorithm (K-NN) is to automatically label these objects  NN stands for nearest neighbor  How do you determine the closeness? Euclidian distance; color, shape or similar features.
  • 31.
    Example2 1/21/2023 Rich's Big DataAnlytics Training 31 Label1 Label2 What is class of unknown item indicated by green circle? (i) K = 3 (ii) K =5
  • 32.
    Intuition (K =3) 1/21/2023 Rich's Big Data Anlytics Training 32 Label1 Label2 What is class of unknown object indicated by green circle? (i) K = 3 The unknown object gets 2 votes and 1 vote label of unclassified object is
  • 33.
    Intuition (K =5) 1/21/2023 Rich's Big Data Anlytics Training 33 Label1 Label2 What is the class of unknown object indicated by green circle? (i) K = 5 The unknown object gets 2 votes and 3 votes  label of unknown object is
  • 34.
    Discussion on K-NN 1/21/2023 Rich'sBig Data Anlytics Training 34  How do you select K, the number of voters/objects with known labels?  Three phases: training, test and classification/labeling of actual data  Lets generate some synthetic data and experiment with K-NN.
  • 35.
    Different Values ofK 1/21/2023 Rich's Big Data Anlytics Training 35
  • 36.
    K-NN application: CreditRating 1/21/2023 Rich's Big Data Anlytics Training 36  Predict credit rating as “good” or “bad” based on a set of known data
  • 37.
    R code forthe previous example 1/21/2023 Rich's Big Data Anlytics Training 37 age<-c(25,35,45,20,37,48,67,90,85) # good rating income<-c(40,60,80,20,120,90,70,40,60) plot(income~age, pch=17, col="red") xn<-c(52,23,40,60,48,33,67,89,34,45) #bad rating yn<-c(68,95,82,100,220,150,100,120,110,96) points(yn~xn,pch=15, col="green") grid(nx=NULL,ny=NULL) x<-46 # predict the rating of this customer y<-90 points(y~x, pch=8) legend("topright", inset=.05, pch=c(17,19),c("good","bad"), col=c("red","green"), horiz=TRUE)
  • 38.
    Application of theK-NN process 1/21/2023 Rich's Big Data Anlytics Training 38  Decide on your similarity or distance metric  Split the original data into training and test data  Pick an evaluation metric (misclassification rate is a good one)  Run k-NN a few and check the evaluation metric  Optimize k by picking one with the best evaluation measure  Once k is chosen, create the new test data with no labels and predict the “class” for the test data
  • 39.
    Discussion 1/21/2023 Rich's Big DataAnlytics Training 39  How to apply these methods and techniques to data problems at your work? See exercises at the end of the lab handout.  When you launch on a data analytics project here are some of the questions to ask:  What are the basic variables?  What are underlying processes?  What influences what?  What are the predictors?  What causes what?  What do you want to know?: This needs a domain expert
  • 40.
    Summary 1/21/2023 Rich's Big DataAnlytics Training 40  We covered 3 of the 10 top data mining algorithms  We studied:  Linear regression  Clustering algorithm K-means  Classification algorithm K-NN  Powerful methods for predicting and discovering intelligence  R /Rstudio provides convenient functions to model your datasets for these algorithms
  • 41.
    References 1/21/2023 Rich's Big DataAnlytics Training 41 1. N. Harris, Visualizing K-means Clustering, http://www.naftaliharris.com/blog/visualizing-k- means-clustering/, 2014. 2. Example figure, http://en.wikipedia.org/wiki/K- nearest_neighbors_algorithm, 2014 3. R Nutshell online version of the book: http://web.udl.es/Biomath/Bioestadistica/R/Man uals/r_in_a_nutshell.pdf