This document summarizes statistical analysis and model validation of the Gompertz model on different real data sets for reliability modeling. It presents the maximum likelihood estimation of parameters for the Gompertz model using the Newton-Raphson method. Goodness of fit tests including the Kolmogorov-Smirnov test and quantile-quantile plot are used to validate the Gompertz model on six different real data sets and determine which data sets provide the best fit for parameter estimation of the Gompertz model.
The Odd Generalized Exponential Log Logistic Distributioninventionjournals
We propose a new lifetime model, called the odd generalized exponential log logistic distribution (OGELLD).We obtain some of its mathematical properties. Some structural properties of the new distribution are studied. The maximum likelihood method is used for estimating the model parameters and the Fisher’s information matrix is derived. We illustrate the usefulness of the proposed model by applications to real lifetime data.
LOGNORMAL ORDINARY KRIGING METAMODEL IN SIMULATION OPTIMIZATIONorajjournal
This paper presents a lognormal ordinary kriging (LOK) metamodel algorithm and its application to
optimize a stochastic simulation problem. Kriging models have been developed as an interpolation method
in geology. They have been successfully used for the deterministic simulation optimization (SO) problem. In
recent years, kriging metamodeling has attracted a growing interest with stochastic problems. SO
researchers have begun using ordinary kriging through global optimization in stochastic systems. The
goals of this study are to present LOK metamodel algorithm and to analyze the result of the application
step-by-step. The results show that LOK is a powerful alternative metamodel in simulation optimization
when the data are too skewed.
International Refereed Journal of Engineering and Science (IRJES)irjes
The core of the vision IRJES is to disseminate new knowledge and technology for the benefit of all, ranging from academic research and professional communities to industry professionals in a range of topics in computer science and engineering. It also provides a place for high-caliber researchers, practitioners and PhD students to present ongoing research and development in these areas.
Sparse data formats and efficient numerical methods for uncertainties in nume...Alexander Litvinenko
Description of methodologies and overview of numerical methods, which we used for modeling and quantification of uncertainties in numerical aerodynamics
Differential evolution (DE) algorithm has been applied as a powerful tool to find optimum switching angles for selective harmonic elimination pulse width modulation (SHEPWM) inverters. However, the DE’s performace is very dependent on its control parameters. Conventional DE generally uses either trial and error mechanism or tuning technique to determine appropriate values of the control paramaters. The disadvantage of this process is that it is very time comsuming. In this paper, an adaptive control parameter is proposed in order to speed up the DE algorithm in optimizing SHEPWM switching angles precisely. The proposed adaptive control parameter is proven to enhance the convergence process of the DE algorithm without requiring initial guesses. The results for both negative and positive modulation index (M) also indicate that the proposed adaptive DE is superior to the conventional DE in generating SHEPWM switching patterns.
When spatial data are distributed across multiple servers, there is an obvious difficulty with computing the likelihood function without combining all the data onto one server. Therefore, it would be of interest to compute estimates of the spatial parameters based on decompositions of the spatial held into blocks, each block corresponding to one server. Two methods suggest themselves, a \between blocks" approach in which each block is reduced to a single observation (or a low dimensional summary) to facilitate calculation of a likelihood across blocks, or a within blocks" approach in which the likelihood is calculated for each block and then combined into an overall likelihood for the full process. In fact, I argue that a hybrid approach that combines both ideas is best. Theoretical calculations are provided for the statistical efficiency of each approach. In conclusion, I will present some thoughts for optimal sampling designs with distributed data.
Using several mathematical examples from three different authors in texts from different courses this paper illustrates the easier way to avoid confusions and always get the correct results with the least effort was to use the proposed Excel Gamma function explained in detail for the proper use of the Q(z) and ercf(x) functions in most communication courses. The paper serves as a tutorial and introduction for such functions
Multi objective predictive control a solution using metaheuristicsijcsit
The application of multi objective model predictive control approaches is significantly limited with
computation time associated with optimization algorithms. Metaheuristics are general purpose heuristics
that have been successfully used in solving difficult optimization problems in a reasonable computation
time. In this work , we use and compare two multi objective metaheuristics, Multi-Objective Particle
swarm Optimization, MOPSO, and Multi-Objective Gravitational Search Algorithm, MOGSA, to generate
a set of approximately Pareto-optimal solutions in a single run. Two examples are studied, a nonlinear
system consisting of two mobile robots tracking trajectories and avoiding obstacles and a linear multi
variable system. The computation times and the quality of the solution in terms of the smoothness of the
control signals and precision of tracking show that MOPSO can be an alternative for real time
applications.
APPROACHES IN USING EXPECTATIONMAXIMIZATION ALGORITHM FOR MAXIMUM LIKELIHOOD ...cscpconf
EM algorithm is popular in maximum likelihood estimation of parameters for state-space models. However, extant approaches for the realization of EM algorithm are still not able to fulfill the task of identification systems, which have external inputs and constrained parameters. In this paper, we propose new approaches for both initial guessing and MLE of the parameters of a constrained state-space model with an external input. Using weighted least square for the initial guess and the partial differentiation of the joint log-likelihood function for the EM algorithm, we estimate the parameters and compare the estimated values with the “actual” values, which are set to generate simulation data. Moreover, asymptotic variances of the estimated parameters are calculated when the sample size is large, while statistics of the estimated parameters are obtained through bootstrapping when the sample size issmall. The results demonstrate that the estimated values are close to the “actual” values.Consequently, our approaches are promising and can applied in future research.
I am Bianca H. I am a Statistics Assignment Expert at statisticsassignmenthelp.com. I hold a Master in Statistics from, the University of Nottingham, UK. I have been helping students with their assignments for the past 7 years. I solve assignments related to Statistics. Visit statisticsassignmenthelp.com or email info@statisticsassignmenthelp.com.
You can also call on +1 678 648 4277 for any assistance with Statistics Assignments.
INDUCTIVE LEARNING OF COMPLEX FUZZY RELATIONijcseit
The objective of this paper to investigate the notion of complex fuzzy set in general view. In constraint to a
traditional fuzzy set, the membership function of the complex fuzzy set, the range from [0.1] extended to a
unit circle in the complex plane. In this article the comprehensive mathematical operations on the complex
fuzzy set are presented. The basic operation of complex fuzzy set such as union, intersection, complement
of complex fuzzy set and complex fuzzy relation are studied. Also vector aggregation and fuzzy relation
over the complex fuzzy set are discussed. Two novel operations of complement and projection for complex
fuzzy relation are introduced.
Abstract:
A combination of exponential and Lindley failure rate model is considered and named it as exponential-Lindley
additive failure rate model. In this paper, we studied the distributional properties, central and non-central moments,
estimation of parameters, testing of hypothesis and the power of likelihood ratio criterion about the proposed model.
Key words: Exponential distribution, Lindley distribution, ML estimation, Likelihood ratio type criterion.
COMPARING THE CUCKOO ALGORITHM WITH OTHER ALGORITHMS FOR ESTIMATING TWO GLSD ...csandit
This study introduces and compares different methods for estimating the two parameters of
generalized logarithmic series distribution. These methods are the cuckoo search optimization,
maximum likelihood estimation, and method of moments algorithms. All the required
derivations and basic steps of each algorithm are explained. The applications for these
algorithms are implemented through simulations using different sample sizes (n = 15, 25, 50,
100). Results are compared using the statistical measure mean square error.
Comparison of Bayesian and non-Bayesian estimations for Type-II censored Gen...IqraHussain31
Conference Research Article
Presented By
Iqra Sardar
16th International Conference on Statistical Sciences:
At Department of Statistics
Islamia College, Peshawar Khyber Pakhtunkhwa, Pakistan
Geoid height determination is one of the major problems of geodesy because usage of satellite
techniques in geodesy isgetting increasing. Geoid heights can be determined using different methods according
to the available data. Soft computing methods such as Fuzzy logic and neural networks became so popular that
they are used to solve many engineering problems. Fuzzy logic theory and later developments in uncertainty
assessment have enabled us to develop more precise models for our requirements. In this study, How to
construct the best fuzzy model is examined. For this purpose, three different data sets were taken and two
different kinds (two inpust one output and three inputs one output) fuzzy model were formed for the calculation
of geoid heights in Istanbul (Turkey). The Fuzzy models results of these were compared with geoid heights
obtained by GPS/levelling methods. The fuzzy approximation models were tested on the test points.
STATISTICAL ANALYSIS OF FUZZY LINEAR REGRESSION MODEL BASED ON DIFFERENT DIST...Wireilla
Using fuzzy linear regression model, the least squares estimation for linear regression (LR) fuzzy number is studied by Euclidean distance, Y-K distance and Dk distance respectively. It is concluded that the three different distances have the same coefficient of the least squares estimation. The data simulation shows the correctness of this conclusion.
Formulas for Surface Weighted Numbers on Graphijtsrd
The boundary value problem differential operator on the graph of a specific structure is discussed in this article. The graph has degree 1 vertices and edges that are linked at one common vertex. The differential operator expression with real valued potentials, the Dirichlet boundary conditions, and the conventional matching requirements define the boundary value issue. There are a finite number of eig nv lu s in this problem.The residues of the diagonal elements of the Weyl matrix in the eigenvalues are referred to as weight numbers. The ig nv lu s are monomorphic functions with simple poles.The weight numbers under consideration generalize the weight numbers of differential operators on a finite interval, which are equal to the reciprocals of the squared norms of eigenfunctions. These numbers, along with the eig nv lu s, serve as spectral data for unique operator reconstruction. The contour integration is used to obtain formulas for surfacethe weight numbers, as well as formulas for the sums in the case of superficial near ig nv lu s. On the graphs, the formulas can be utilized to analyze inverse spectral problems. Ghulam Hazrat Aimal Rasa "Formulas for Surface Weighted Numbers on Graph" Published in International Journal of Trend in Scientific Research and Development (ijtsrd), ISSN: 2456-6470, Volume-6 | Issue-3 , April 2022, URL: https://www.ijtsrd.com/papers/ijtsrd49573.pdf Paper URL: https://www.ijtsrd.com/mathemetics/calculus/49573/formulas-for-surface-weighted-numbers-on-graph/ghulam-hazrat-aimal-rasa
Typically quantifying uncertainty requires many evaluations of a computational model or simulator. If a simulator is computationally expensive and/or high-dimensional, working directly with a simulator often proves intractable. Surrogates of expensive simulators are popular and powerful tools for overcoming these challenges. I will give an overview of surrogate approaches from an applied math perspective and from a statistics perspective with the goal of setting the stage for the "other" community.
STATISTICAL ANALYSIS OF FUZZY LINEAR REGRESSION MODEL BASED ON DIFFERENT DIST...ijfls
Using fuzzy linear regression model, the least squares estimation for linear regression (LR) fuzzy number is
studied by Euclidean distance, Y-K distance and Dk
distance respectively. It is concluded that the three
different distances have the same coefficient of the least squares estimation. The data simulation shows the
correctness of this conclusion.
Computation of Electromagnetic Fields Scattered from Dielectric Objects of Un...Alexander Litvinenko
We research how input uncertainties in the geometry shape propagate through the electromagnetic model to electro-magnetic fields. We use multi-level Monte Carlo methods.
Financial Time Series Analysis Based On Normalized Mutual Information FunctionsIJCI JOURNAL
A method of predictability analysis of future values of financial time series is described. The method is based on normalized mutual information functions. In the analysis, the use of these functions allowed to refuse any restrictions on the distributions of the parameters and on the correlations between parameters. A comparative analysis of the predictability of financial time series of Tel Aviv 25 stock exchange has been carried out.
Performance of Wideband Mobile Channel with Perfect Synchronism BPSK vs QPSK ...Editor Jacotech
Direct-sequence code-division multiple access (DS-CDMA) is
currently the subject of much research as it is a promising
multiple access capability for third and fourth generations
mobile communication systems. The synchronous DS-CDMA
system is well known for eliminating the effects of multiple
access interference (MAI) which limits the capacity and
degrades the BER performance of the system. In this paper,
we investigate the bit error rate (BER) performance of a
synchronous DS-CDMA system over a wideband mobile
radio channel. The BER performance is affected by the
difference in path length ΔL and the number of arriving
signals N. Furthermore, the effect of these parameters is
examined on the synchronous DS-CDMA system for different
users’ number as well as different processing gain Gp. In this
environment and under the above conditions the performances
of the BPSK (Binary Phase Shift Keying) and the QPSK
(Quadrature Phase Shift Keying) modulations are compared.
The promising simulation results showed the possibility of
applying this system to the wideband mobile radio channel.
MOVIE RATING PREDICTION BASED ON TWITTER SENTIMENT ANALYSISEditor Jacotech
With microblogging platforms such as Twitter generating
huge amounts of textual data every day, the possibilities of
knowledge discovery through Twitter data becomes
increasingly relevant. Similar to the public voting mechanism
on websites such as the Internet Movie Database (IMDb) that
aggregates movies ratings, Twitter content contains
reflections of public opinion about movies. This study aims to
explore the use of Twitter content as textual data for
predicting the movie rating. In this study, we extract number
of tweets and compiled to predict the rating scores of newly
released movies. Predictions were done with the algorithms,
exploring the tweet polarity. In addition, this study explores
the use of several different kinds of tweet classification
Algorithm and movie rating algorithm. Results show that
movie rating developed by our application is compared to
IMDB and Rotten Tomatoes.
Non integer order controller based robust performance analysis of a conical t...Editor Jacotech
The design of robust controller for any non linear process is a
challenging task because of the presence of various types of
uncertainties. In this paper, various design methods of robust
PID controller for the level control of conical tank are
discussed. Uncertainties are of different types, among that
structured uncertainty of 30% is introduced to the nominal
plant for analysing the robustness. As a first step, the control
of level is done by using conventional integer order controller
for both nominal and uncertain system. Then, the control is
done by means of Fractional Order Proportional Integral
Derivative (FOPID) controller for achieving robustness. With
the help of time series parameters, a comparison is made
between conventional PID and FOPID with respect to the
simulated output using MATLAB and also analyzed the
robustness.
FACTORS CAUSING STRESS AMONG FEMALE DOCTORS (A COMPARATIVE STUDY BETWEEN SELE...Editor Jacotech
It is an important task of working women to handle two
important tasks. Balancing these two roles at home and
work is very challenging task and causes stress at different
levels. Different dimension of working women’s life
involves in evolving the stress in working women’s life.
These stresses cause the imbalance at the front of and
handling family responsibility. In the current scenario,
doctors face many stressors that are peculiar to the medical
profession and doctors are required to have more
competencies than before in diagnosis ongoing
management of medical conditions. This means increased
responsibilities which may contribute to stress. Stress
experienced at work can have adverse outcomes for the
well-being of individual employees and organization as
whole. My study is focusing on identifying the factors
causing stress among female doctors working for public
and private hospitals and their stress levels associations
with respect to sector. A sample of 300 female doctors
from urban area participated in this study. Out of this, 150
each are from public and private hospitals respectively. A
self-made standardized tool was administered based on five
point scale. Results indicates that the values were found to
be 0.000 in all the cases except, psychosomatic problems
(0.004) which is lesser than (0.05) p-value resulting into
rejection of null hypotheses , consequently revealing an
association between sector of female doctors and stress due
to workload, working condition, physical exertion,
emotional exhaustion, job security, organizational support,
work family conflict, family adjustment, task demands,
psychosomatic problems, patient’s expectation and working
hours.
ANALYSIS AND DESIGN OF MULTIPLE WATERMARKING IN A VIDEO FOR AUTHENTICATION AN...Editor Jacotech
Watermarking technique be employ instance & for a second time for
validation and protection of digital data (images, video and audio
files, digital repositories and libraries, web publishing). It is helpful
to copyright protection and illegal copying of digital data like video
frames and making digital data more robust and imperceptible. With
the advent of internet, creation and delivery of digital data has grown
many fold. In that Scenario has to need a technique for transferring
digital data securely without changing their originality and
robustness. In this paper proposed a plan of latest watermarking
method which involves inserting and adding two or more digital data
or pictures in a single video frame for the principle of protection and
replicate the similar procedure for N no video frames for
authentication of entire digital video. After that digital video is
encrypted and decrypted by using motion vector bit-xor encryption
and decryption technique.
The Impact of Line Resistance on the Performance of Controllable Series Compe...Editor Jacotech
In recent years controllable FACTS devices are increasingly
integrated into the transmission system. FACTS devices that
provide series control such as Controllable Series Compensator
(CSC) has significant effect on the voltage stability of Electric
Power system. In this work impact of line resistance on the
performance of CSC in a single-load infinitive-bus (SLIB)
model is investigated. The proposed framework is applied to
SLIB model and obtained results demonstrates that line
resistance has considerable effect on voltage stability limits and
performance of CSC.
Security Strength Evaluation of Some Chaos Based Substitution-BoxesEditor Jacotech
Recently, handful amount of S-boxes, using the various
methods such as affine transformations, gray coding,
optimization, chaotic systems, etc, have been suggested. It is
prudent to use cryptographically strong S-boxes for the design
of powerful ciphers. In this paper, we sampled some widely
used 8×8 S-boxes which are recently synthesized and security
analysis and evaluation is executed to uncover the best
candidate(s). The performance analysis is exercised against
the crucial measures like nonlinearity, linear approximation
probability, algebraic immunity, algebraic complexity,
differential uniformity. These parameters are custom selected
because their scores decide the security strength against
cryptographic assaults like linear cryptanalysis, algebraic
attacks, and differential cryptanalysis. The anticipated
analysis in this work facilitates the cryptographers, designers,
researchers to choose suitable candidate decided over many
parameters and can be engaged in modern block encryption
systems that solely rely on 8×8 S-box. Moreover, the analysis
assists in articulating efficient S-boxes and to evaluate the
attacks resistivity of their S-boxes.
Traffic Detection System is an Android application that aims at determining the behavior of traffic in a particular location. It calculates the speed of the vehicle and the level of congestion or the amount of traffic is determined on the basis of the values of sensors. If any such obstruct found, then the driver is provided an option to send messages regarding high traffic to his/her friends. After a distinct number of repeated low speed and breaks, the location of the vehicle (latitude and longitude) send to a pre-specified contact (selected in case of traffic congestion) through an SMS. This application uses the features of the Global positioning system. The Latitude, as well as the longitude of the location where traffic jams are formed, is sent to the friends of the user. The Goggle map of the location also sends to the friends. It uses the SMS Manager a functionality of Android. The friends receiving the messages will thereby avoid taking the congested route and hence the level of traffic on the congested road will decrease, and the friends will reach the destination in comparatively less time.
Performance analysis of aodv with the constraints of varying terrain area and...Editor Jacotech
Mobile Ad Hoc Networks (MANETs) are wireless networks,
where there is no requirement for any infrastructure support to
transfer data packets between mobile nodes. These nodes
communicate in a multi-hop mode; each mobile node acts
both as a host and router. The main job of Quality of Service
(QoS)[1][2] routing in MANETs is to search and establish
routes among different mobile nodes for satisfying QoS
requirements of wireless sensor networks as PDR, Average
end-to-end delay, Average Throughput. The QoS routing
protocols efficient for commercial, real-time and multimedia
applications are in demand for day to day activities[2].
Modeling of solar array and analyze the current transient response of shunt s...Editor Jacotech
Spacecraft bus voltage is regulated by power
conditioning unit using switching shunt voltage regulator having
solar array cells as the primary source of power. This source
switches between the bus loads and the shunt switch for fine
control of spacecraft bus voltage. The effect of solar array cell
capacitance [5][6] along with inductance and resistance of the
interface wires between solar cells and power conditioning
unit[1], generates damped sinusoidal currents superimposed on
the short circuit current of solar cell when shunted through
switch. The peak current stress on the shunt switch is to be
considered in the selection of shunt switch in power conditioning
unit. The analysis of current transients of shunt switch in PCU
considering actual spacecraft interface wire length by
illumination of solar panel (combination of series and parallel
solar cells) is difficult with hardware simulation. Software
simulation by modeling solar cell is carried out for a single string
(one parallel) in Pspice [6]. Since in spacecrafts number of
parallels and interface cable length are variable parameters the
analysis of current transients of shunt switch is carried out by
modeling solar array with the help of solar cell model[6] for the
actual spacecraft condition.
License plate recognition an insight to the proposed approach for plate local...Editor Jacotech
License Plate Recognition (LPR) system for vehicles is an innovative and a very challenging area for research due to the innumerous plate formats and the nonuniform outdoor illumination conditions during which images are acquired. Thus, most approaches developed, work under certain restrictions such as fixed illumination, stationary background and limited speed. Algorithms developed for LPR systems are generally composed of three significant stages: 1] localization of the license plate from an entire scene image; 2] segmentation of the characters on the plate; 3] recognition of each of the segmented characters. A simple approach for preprocessing of the images, localization and extraction phase has been described in this paper. Numerous procedures have been developed for LPR systems and are assessed in this paper taking into consideration issues like processing time, computational power and recognition rate wherever available.
Design of airfoil using backpropagation training with mixed approachEditor Jacotech
Levenberg-Marquardt back-propagation training method has some limitations associated with over fitting and local optimum problems. Here, we proposed a new algorithm to increase the convergence speed of Backpropagation learning to design the airfoil. The aerodynamic force coefficients corresponding to series of airfoil are stored in a database along with the airfoil coordinates. A feedforward neural network is created with aerodynamic coefficient as input to produce the airfoil coordinates as output. In the proposed algorithm, for output layer, we used the cost function having linear & nonlinear error terms then for the hidden layer, we used steepest descent cost function. Results indicate that this mixed approach greatly enhances the training of artificial neural network and may accurately predict airfoil profile.
Ant colony optimization based routing algorithm in various wireless sensor ne...Editor Jacotech
Wireless Sensor Network has several issues and challenges due to limited battery backup, limited computation capability, and limited computation capability. These issues and challenges must be taken care while designing the algorithms to increase the Network lifetime of WSN. Routing, the act of moving information across an internet world from a source to a destination is one of the vital issue associated with Wireless Sensor Network. The Ant Colony Optimization (ACO) algorithm is a probabilistic technique for solving computational problems that can be used to find optimal paths through graphs. The short route will be increasingly enhanced therefore become more attractive. The foraging behavior and optimal route finding capability of ants can be the inspiration for ACO based algorithm in WSN. The nature of ants is to wander randomly in search of food from their nest. While moving, ants lay down a pheromone trail on the ground. This chemical pheromone has the ability to evaporate with the time. Ants have the ability to smell pheromone. When selecting their path, they tend to select, probably the paths that has strong pheromone concentrations. As soon as an ant finds a food source, carries some of it back to the nest. While returning, the quantity of chemical pheromone that an ant lay down on the ground may depend on the quantity and quality of the food. The pheromone trails will lead other ants towards the food source. The path which has the strongest pheromone concentration is followed by the ant which is the shortest paths between their nest and food source. This paper surveys the ACO based routing in various Networking domains like Wireless Sensor Networks and Mobile Ad Hoc Networks.
An efficient ant optimized multipath routing in wireless sensor networkEditor Jacotech
Today, the Wireless Sensor Network is increasingly gaining popularity and importance. It is the more interesting and stimulating area of research. Now, the WSN is applied in object tracking and environmental monitoring applications. This paper presents the self-optimized model of multipath routing algorithm for WSN which considers definite parameters like delay, throughput level and loss and generates the outcomes that maximizes data throughput rate and minimizes delay and loss. This algorithm is based on ANT optimization technique that will bring out an optimal and organized route for WSN and is also to avoid congestion in WSN, the algorithm incorporate multipath capability..
A mobile monitoring and alert sms system with remote configuration – a case s...Editor Jacotech
One of the parent´s main concerns nowadays it to know their children´s whereabouts. Some applications exist to address this issue and most of them rely on internet connection which makes the solution expensive. In this paper we present a low cost solution, based on SMS, and with the ability to remotely configure the child monitoring process. We also present the architecture and the full flowchart of the child application whenever a SMS is received. This case study uses Android and the more recent location API – the Fused Location Provider. For obvious reasons, the security issue has been a concern, which resulted in a configuration module in the child application to specify authorized senders
Leader Election Approach: A Comparison and SurveyEditor Jacotech
In distributed system, the coordinator is needed to manage the use of the resources in the shared environment. Many algorithms have been proposed for the same. They have various positive and negative parts. Here we will discuss those issues which ensure the efficiency of the algorithm for election leader. Here a comparison will be provided to show the advantages and disadvantages of different election algorithms. The comparison would be based on the number of messages passing and the order of time complexity.
Leader election approach a comparison and surveyEditor Jacotech
In distributed system, the coordinator is needed to manage the use of the resources in the shared environment. Many algorithms have been proposed for the same. They have various positive and negative parts. Here we will discuss those issues which ensure the efficiency of the algorithm for election leader. Here a comparison will be provided to show the advantages and disadvantages of different election algorithms. The comparison would be based on the number of messages passing and the order of time complexity
Modeling of solar array and analyze the current transientEditor Jacotech
Spacecraft bus voltage is regulated by power
conditioning unit using switching shunt voltage regulator having
solar array cells as the primary source of power. This source
switches between the bus loads and the shunt switch for fine
control of spacecraft bus voltage. The effect of solar array cell
capacitance [5][6] along with inductance and resistance of the
interface wires between solar cells and power conditioning
unit[1], generates damped sinusoidal currents superimposed on
the short circuit current of solar cell when shunted through
switch. The peak current stress on the shunt switch is to be
considered in the selection of shunt switch in power conditioning
unit. The analysis of current transients of shunt switch in PCU
considering actual spacecraft interface wire length by
illumination of solar panel (combination of series and parallel
solar cells) is difficult with hardware simulation. Software
simulation by modeling solar cell is carried out for a single string
(one parallel) in Pspice [6]. Since in spacecrafts number of
parallels and interface cable length are variable parameters the
analysis of current transients of shunt switch is carried out by
modeling solar array with the help of solar cell model[6] for the
actual spacecraft condition.
Traffic Detection System is an Android application that aims at determining the behavior of traffic in a particular location. It calculates the speed of the vehicle and the level of congestion or the amount of traffic is determined on the basis of the values of sensors. If any such obstruct found, then the driver is provided an option to send messages regarding high traffic to his/her friends. After a distinct number of repeated low speed and breaks, the location of the vehicle (latitude and longitude) send to a pre-specified contact (selected in case of traffic congestion) through an SMS. This application uses the features of the Global positioning system. The Latitude, as well as the longitude of the location where traffic jams are formed, is sent to the friends of the user. The Goggle map of the location also sends to the friends. It uses the SMS Manager a functionality of Android. The friends receiving the messages will thereby avoid taking the congested route and hence the level of traffic on the congested road will decrease, and the friends will reach the destination in comparatively less time.
How to Make a Field invisible in Odoo 17Celine George
It is possible to hide or invisible some fields in odoo. Commonly using “invisible” attribute in the field definition to invisible the fields. This slide will show how to make a field invisible in odoo 17.
Embracing GenAI - A Strategic ImperativePeter Windle
Artificial Intelligence (AI) technologies such as Generative AI, Image Generators and Large Language Models have had a dramatic impact on teaching, learning and assessment over the past 18 months. The most immediate threat AI posed was to Academic Integrity with Higher Education Institutes (HEIs) focusing their efforts on combating the use of GenAI in assessment. Guidelines were developed for staff and students, policies put in place too. Innovative educators have forged paths in the use of Generative AI for teaching, learning and assessments leading to pockets of transformation springing up across HEIs, often with little or no top-down guidance, support or direction.
This Gasta posits a strategic approach to integrating AI into HEIs to prepare staff, students and the curriculum for an evolving world and workplace. We will highlight the advantages of working with these technologies beyond the realm of teaching, learning and assessment by considering prompt engineering skills, industry impact, curriculum changes, and the need for staff upskilling. In contrast, not engaging strategically with Generative AI poses risks, including falling behind peers, missed opportunities and failing to ensure our graduates remain employable. The rapid evolution of AI technologies necessitates a proactive and strategic approach if we are to remain relevant.
June 3, 2024 Anti-Semitism Letter Sent to MIT President Kornbluth and MIT Cor...Levi Shapiro
Letter from the Congress of the United States regarding Anti-Semitism sent June 3rd to MIT President Sally Kornbluth, MIT Corp Chair, Mark Gorenberg
Dear Dr. Kornbluth and Mr. Gorenberg,
The US House of Representatives is deeply concerned by ongoing and pervasive acts of antisemitic
harassment and intimidation at the Massachusetts Institute of Technology (MIT). Failing to act decisively to ensure a safe learning environment for all students would be a grave dereliction of your responsibilities as President of MIT and Chair of the MIT Corporation.
This Congress will not stand idly by and allow an environment hostile to Jewish students to persist. The House believes that your institution is in violation of Title VI of the Civil Rights Act, and the inability or
unwillingness to rectify this violation through action requires accountability.
Postsecondary education is a unique opportunity for students to learn and have their ideas and beliefs challenged. However, universities receiving hundreds of millions of federal funds annually have denied
students that opportunity and have been hijacked to become venues for the promotion of terrorism, antisemitic harassment and intimidation, unlawful encampments, and in some cases, assaults and riots.
The House of Representatives will not countenance the use of federal funds to indoctrinate students into hateful, antisemitic, anti-American supporters of terrorism. Investigations into campus antisemitism by the Committee on Education and the Workforce and the Committee on Ways and Means have been expanded into a Congress-wide probe across all relevant jurisdictions to address this national crisis. The undersigned Committees will conduct oversight into the use of federal funds at MIT and its learning environment under authorities granted to each Committee.
• The Committee on Education and the Workforce has been investigating your institution since December 7, 2023. The Committee has broad jurisdiction over postsecondary education, including its compliance with Title VI of the Civil Rights Act, campus safety concerns over disruptions to the learning environment, and the awarding of federal student aid under the Higher Education Act.
• The Committee on Oversight and Accountability is investigating the sources of funding and other support flowing to groups espousing pro-Hamas propaganda and engaged in antisemitic harassment and intimidation of students. The Committee on Oversight and Accountability is the principal oversight committee of the US House of Representatives and has broad authority to investigate “any matter” at “any time” under House Rule X.
• The Committee on Ways and Means has been investigating several universities since November 15, 2023, when the Committee held a hearing entitled From Ivory Towers to Dark Corners: Investigating the Nexus Between Antisemitism, Tax-Exempt Universities, and Terror Financing. The Committee followed the hearing with letters to those institutions on January 10, 202
Synthetic Fiber Construction in lab .pptxPavel ( NSTU)
Synthetic fiber production is a fascinating and complex field that blends chemistry, engineering, and environmental science. By understanding these aspects, students can gain a comprehensive view of synthetic fiber production, its impact on society and the environment, and the potential for future innovations. Synthetic fibers play a crucial role in modern society, impacting various aspects of daily life, industry, and the environment. ynthetic fibers are integral to modern life, offering a range of benefits from cost-effectiveness and versatility to innovative applications and performance characteristics. While they pose environmental challenges, ongoing research and development aim to create more sustainable and eco-friendly alternatives. Understanding the importance of synthetic fibers helps in appreciating their role in the economy, industry, and daily life, while also emphasizing the need for sustainable practices and innovation.
Macroeconomics- Movie Location
This will be used as part of your Personal Professional Portfolio once graded.
Objective:
Prepare a presentation or a paper using research, basic comparative analysis, data organization and application of economic information. You will make an informed assessment of an economic climate outside of the United States to accomplish an entertainment industry objective.
Welcome to TechSoup New Member Orientation and Q&A (May 2024).pdfTechSoup
In this webinar you will learn how your organization can access TechSoup's wide variety of product discount and donation programs. From hardware to software, we'll give you a tour of the tools available to help your nonprofit with productivity, collaboration, financial management, donor tracking, security, and more.
Instructions for Submissions thorugh G- Classroom.pptxJheel Barad
This presentation provides a briefing on how to upload submissions and documents in Google Classroom. It was prepared as part of an orientation for new Sainik School in-service teacher trainees. As a training officer, my goal is to ensure that you are comfortable and proficient with this essential tool for managing assignments and fostering student engagement.
The French Revolution, which began in 1789, was a period of radical social and political upheaval in France. It marked the decline of absolute monarchies, the rise of secular and democratic republics, and the eventual rise of Napoleon Bonaparte. This revolutionary period is crucial in understanding the transition from feudalism to modernity in Europe.
For more information, visit-www.vavaclasses.com
Introduction to AI for Nonprofits with Tapp NetworkTechSoup
Dive into the world of AI! Experts Jon Hill and Tareq Monaur will guide you through AI's role in enhancing nonprofit websites and basic marketing strategies, making it easy to understand and apply.
Statistical Analysis and Model Validation of Gompertz Model on different Real Data Sets for Reliability Modelling
1. Journal of Advanced Computing and Communication Technologies (ISSN: 2347 - 2804)
Volume No.1 Issue No.2., December 2013
Statistical Analysis and Model Validation of Gompertz Model
on different Real Data Sets for Reliability Modelling
By
Ashwini Kumar Srivastava
Department. of Computer Application,
Shivharsh.Kisan P.G. College, Basti, U.P., India
ashwini.skpg@gmail.com
ABSTRACT
A very basic problem in reliability modeling is to obtain
information about the form of the population from which
the sample is drawn. Goodness of fit test is employed on
different real data sets to determine how well the observed
sample data "fits" on proposed model for reliability
analysis. In this paper, we obtain the tables and graphs of
critical values of Kolmogorov-Smirnov (KS) test, and Q-Q
test for Gompertz model with two unknown parameters.
These plots are used to investigate whether an assumed
model adequately fits a set of data and we present power
comparison between Computation of MLE using
Newton‐Raphson method and p-value with its
corresponding D-value obtaining by KS-Test Q-Q test for
model validation to obtain feasible real data sets which are
most suitable for parameter estimation of Gompertz
model. For this analysis, we used different tools which are
developed in R language and environment for model
analysis, model validation and estimation of parameters
using method of maximum likelihood.
Keywords
Gompertz model, probability density function (pdf'),
cumulative distribution function ( cdf) , model validation,
quantile-quantile(Q-Q) test, goodness of fit test
1. INTRODUCTION
The Gompertz model plays an important role in
modeling human mortality and fitting actuarial tables.
Historically, the Gompertz model was first introduced by
Gompertz [7]. Recently, many authors have contributed to the
studies of statistical methodology and characterization of this
model; for example, Read [18], Makany [15], Rao and
Damaraju [17], Franses [5], Chen [3] and Wu and Lee [22].
Garg et al. [6] studied the properties of the Gompertz model
and obtained the maximum likelihood (ML) estimates for the
parameters. Gordon [8] provided the ML estimation for the
mixture of two Gompertz models.
In this paper, we investigate the statistical properties
of two parameter Gompertz model and then we check the
validity of this model on different real data sets by using
modus operandi which are easy to understand and implement,
and are based on intuitive and graphical techniques such as QQ plot test, Kolmogorov–Smirnov (K-S) test and plots the
graph of empirical distribution function and fitted distribution
function. These plots are used to investigate whether an
assumed model adequately fits a set of proposed data. We
present power comparison between these data sets obtaining
by K-S test and Q-Q test for model validation to obtain
feasible real data sets which are most suitable for parameter
estimation of Gompertz model.
2. MODEL ANALYSIS
The Cumulative distribution function of Gompertz model with
two parameters is given by
F(x; ,) = 1-exp (1-exp(x)) ;
Where (,) 0, 0 x
(2.1)
where > 0 is the shape and > 0
The two-parameter Gompertz model will be denoted by
Gompertz (,).
The probability density function is given by
f(x; ,) = exp x exp (1-exp(x)) ;
where (,) 0, 0 x
(2.2)
1
2. Journal of Advanced Computing and Communication Technologies (ISSN: 2347 - 2804)
Volume No.1 Issue No.2., December 2013
The hazard rate is an increasing function. It has been
graphed in Figure 2 for scale parameter =1 and different
values of shape parameter . The associated R function
hgompertz( ) is used.
The cumulative hazard function H(x) defined as
H(x) log 1 F(x)
(2.5)
can be obtained with the help of pgompertz( ) function by
choosing arguments lower.tail=FALSE and log.p=TRUE. i.e.
- pgompertz(x, alpha, theta, lower.tail=FALSE,log.p=TRUE)
Two other relevant functions useful in reliability analysis
are failure rate average (fra) and conditional survival
function(crf) The failure rate average of X is given by
Fig 1
Plots of the probability density function of the
Gompertz Model for =1 and different values of .
x
FRA(x) =
The R functions dgompertz( ) and pgompertz( ) can be
used for the computation of pdf and cdf, respectively. Some of
the typical Gompertz density functions for different values of
and for = 1 are depicted in Figure 1. It is clear from the
figure that the density function of the Gompertz model can
take different shapes.
, x > 0,
(2.6)
The survival function (s.f.) and the conditional survival of
X are defined by
(2.3)
and R (x | t) =
The hazard rate function is
(,) 0
x
R(x)= 1 − F(x)
The R function sgompertz( ) computes the reliability/
survival function.
h(x) = exp x ;
h(x) dx
0
where H(x) is the cumulative hazard function. An analysis for
FRA(x) on x permits to obtain the IFRA and DFRA classes.
The reliability or survival function is
R(x; ,) = exp 1-exp(x)
H(x)
x
(2.4)
R (x + t)
, t > 0, x > 0, R (·) > 0,
R(x)
(2.7)
respectively, where F(·) is the cdf of X. Similarly to h(x) and
FRA(x), the distribution of X belongs to the new better than
used (NBU), exponential, or new worse than used (NWU)
classes, when R (x | t) < R(x), R(t | x) = R(x), or R(x | t) >
R(x), respectively.
The R functions hra. gompertz() and crf. gompertz() can
be used for the computation of failure rate average (fra) and
conditional survival function(crf), respectively.
The quantile function is given by
1/
xq
q
1 q
; 0 q 1.
(2.8)
The computation of quantiles the R function qgompertz() can
be used.
Let U be the uniform (0,1) random variable and F(.) a cdf
-1
-1
for which F (.) exists. Then F (u) is a draw from
distribution F(.) . Therefore, the random deviate can be
generated from Gompertz(,) by
Fig. 2 Plots of the hazard function of the Gompertz Model
for =1 and different values of .
1/
u
x
1 u
; 0 u 1.
(2.9)
2
3. Journal of Advanced Computing and Communication Technologies (ISSN: 2347 - 2804)
Volume No.1 Issue No.2., December 2013
where, u has the U(0, 1) distribution. The R function
rgompertz(), generates the random deviate from
Gompertz(,).
2.1 Computation of MLE
In this section, we briefly discuss the MLE’s of
the two-parameter Gompertz model and discuss their
asymptotic properties to obtain approximate confidence
intervals based on MLE’s[4].
Let x=(x1, . . . , xn) be a random sample of size n
from Gompertz(,), then the log-likelihood function L(,)
can be written as;
L(, ) = n e xi exp ne exi (2.1.1)
Therefore, to obtain the MLE’s of and , we can maximize
(2.1.1) directly with respect to and or we can solve the
following two non-linear equations using Newton-Raphson
method
n
n
n
lnL
= xi ne x iexi 2 ne exi
n
i 1
i 1
i 1
and
n
lnL
n 1
= ne exi
i 1
Let us denote the parameter vector by ,
ˆ
ˆ ˆ
and the corresponding MLE of Ө as , then the
asymptotic normality results in
ˆ
N2 0, I()1
(2.1.2)
where I(Ө) is the Fisher’s information matrix given by
2 ln L
2 ln L
E
E
2
(2.1.3)
I( )
2
2
ln L
L
E
E
2
In practice, it is useless that the MLE has asymptotic variance
I( ) 1 because we do not know Ө.
Hence, we approximate
the asymptotic variance by “plugging in” the estimated value
of the parameters. The common procedure is to use observed
ˆ
Fisher information matrix O( ) (as an estimate of the
information matrix I(Ө)) given by
2 ln L
2
ˆ
O( )
2
ln L
2 ln L
H()
2 ln L
2 (, )
ˆ ˆ
ˆ
(2.1.4)
ˆ
ˆ ˆ
where H is the Hessian matrix, Ө =(α, θ) and = (, ) . The
Newton-Raphson algorithm to maximize the likelihood
produces the observed information matrix. Therefore, the
variance-covariance matrix is given by
H()
ˆ
1
Var() cov(, )
ˆ
ˆ ˆ
cov(, ) Var()
ˆ
ˆ ˆ
(2.1.5)
Hence, from the asymptotic normality of MLEs,
approximate 100(1-)% confidence intervals for and θ
can be constructed as
ˆ
ˆ
and z / 2 Var()
ˆ
ˆ
z / 2 Var()
where z/2 is the upper percentile of standard normal
variate.
2.2 Data Analysis
In this section we present six real data sets for illustration of
the proposed methodology. These are
Data Set 1: SYS2.DAT - 86 time-between-failures [14] is
converted to time to failures and scaled.
4.79, 7.45, 10.22, 15.76, 26.10, 28.59, 35.52, 41.49, 42.66,
44.36, 45.53, 58.27, 62.96, 74.70, 81.63, 100.71, 102.06,
104.83, 110.79, 118.36, 122.73, 145.03, 149.40, 152.80,
156.85, 162.20, 164.97, 168.60, 173.82, 179.95, 182.72,
195.72, 203.93, 206.06, 222.26, 238.27, 241.25, 249.99,
256.17, 282.57, 282.62, 284.11, 294.45, 318.86, 323.46,
329.11, 340.30, 344.67, 353.94, 398.56, 405.70, 407.51,
422.36, 429.93, 461.47, 482.62, 491.46, 511.83, 526.64,
532.23, 537.13, 543.06, 560.75, 561.60, 589.96, 592.09,
610.75, 615.65, 630.52, 673.74, 687.92, 698.15, 753.05,
768.25, 801.06, 828.22, 849.97, 885.02, 892.27, 911.90,
951.69, 962.59, 965.04, 976.98, 986.92, 1025.94
Data Set 2: The following data set includes the survival times
(in days) of 72 guinea pigs infected with virulent tubercle
bacilli, observed and reported by Bjerkedal [2].
10, 33, 44, 56, 59, 72, 74, 77, 92, 93, 96, 100, 100, 102,
107, 107, 108, 108, 108, 109, 112, 113, 115, 116, 120,
122, 122, 124, 130, 134, 136, 139, 144, 146, 153, 159,
163, 163, 168, 171, 172, 176, 183, 195, 196, 197, 202,
215, 216, 222, 230, 231, 240, 245, 251, 253, 254, 254,
293, 327, 342, 347, 361, 402, 432, 458, 555
105,
121,
160,
213,
278,
Data Set 3: The data is obtained from Lawless [13] and it
represents the number of revolution before failure of each of
23 ball bearings in the life tests and they are as follows:
17.88, 28.92, 33.00, 41.52, 42.12, 45.60, 48.80, 51.84, 51.96,
54.12, 55.56, 67.80, 68.44, 68.64, 68.88, 84.12, 93.12, 98.64,
105.12, 105.84, 127.92, 128.04, 173.40
Data Set 4: The data gives 100 observations on breaking
stress of carbon fibres (in Gba) [16].
3.70,
2.41,
2.95,
3.33,
2.38,
2.76,
2.74,
3.19,
2.97,
2.55,
2.81,
4.91,
2.73,
3.22,
3.39,
3.31,
2.77,
3.68,
2.50,
1.69,
2.96,
3.31,
2.17,
1.84,
3.60, 3.11, 3.27, 2.87, 1.47, 3.11, 4.42,
3.28, 3.09, 1.87, 3.15, 4.90, 3.75, 2.43,
2.53, 2.67, 2.93, 3.22, 3.39, 2.81, 4.20,
2.85, 2.56, 3.56, 3.15, 2.35, 2.55, 2.59,
2.83, 1.92, 1.41, 3.68, 2.97, 1.36, 0.98,
1.59, 3.19, 1.57, 0.81, 5.56, 1.73, 1.59,
3
4. Journal of Advanced Computing and Communication Technologies (ISSN: 2347 - 2804)
Volume No.1 Issue No.2., December 2013
2.00, 1.22, 1.12, 1.71, 2.17, 1.17, 5.08, 2.48, 1.18, 3.51, 2.17,
1.69, 1.25, 4.38, 1.84, 0.39, 3.68, 2.48, 0.85, 1.61, 2.79, 4.70,
2.03, 1.80, 1.57, 1.08, 2.03, 1.61, 2.12, 1.89, 2.88, 2.82, 2.05,
3.65
Data Set 5: Aarset MV. How to identify bathtub hazard rate.
IEEE Trans Reliability 1987;R-36(1):106 -108. (Failure time
of 50 items [1].
0.1, 0.2, 1.0, 1.0, 1.0, 1.0, 1.0, 2.0, 3.0, 6.0, 7.0, 11.0, 12.0,
18.0, 18.0, 18.0, 18.0, 18.0, 21.0, 32.0, 36.0, 40.0, 45.0, 45.0,
47.0, 50.0, 55.0, 60.0, 63.0, 63.0, 67.0, 67.0, 67.0, 67.0, 72.0,
75.0, 79.0, 82.0, 82.0, 83.0, 84.0, 84.0, 84.0, 85.0, 85.0, 85.0,
85.0, 85.0, 86.0, 86.0
Data Set 6: The data is obtained from Lai et al. [12];
Complete Data : Failure times of 20 components.
0.481, 1.196, 1.438, 1.797, 1.811, 1.831, 1.885, 2.104, 2.133,
2.144, 2.282, 2.322, 2.334, 2.341, 2.428, 2.447, 2.511, 2.593,
2.715, 3.218
2.3 Obtaining MLE on Proposed Data Sets
For obtaining the MLE(maximum likelihood estimation), we
have started the iterative procedure by maximizing the loglikelihood function given in (2.1.1) directly with an initial
guess for = 0.01 and = 0.05 for away from the
solution[11]. We have used maxLik( ) function in R with
option Newton-Raphson method[19] and [21]. The iterative
process stopped only after various no. of iterations depend on
used data set[10]. The Table 1 shows the ML estimates and
Log-Likelihood value of the parameters alpha and theta.
TABLE I.
Data
Set
ML ESTIMATES WITH CORRESPONDING
LOG-LIKELIHOOD
MLE
sure that the proper model has been selected. Hence model
validation is still necessary to check whether we have
achieved the goal of choosing the right model[17]. In this
paper we outline some of the methods used to check model
appropriateness.
3.1 Kolmogorov–Smirnov Test
The Kolmogorov–Smirnov test (K–S test) is a nonparametric
test for the equality of continuous and that can be used to
compare a sample with a reference probability model. The
Kolmogorov–Smirnov statistic quantifies a distance between
the empirical distribution function of the sample and the
cumulative distribution function of the reference model [9].
The Empirical Distribution Function(EDF)
An estimate of F(x) = P[ X ≤ x] is the proportion of sample
points that fall in the interval [-, x]. This estimate is called the
empirical distribution function(EDF). The EDF of an
observed sample xl, x2,. . . , xn is defined by
0
i
Fn (x)
n
1
theta
1
0.001213069
0.001733294
-593.0077
2
0.004427568
0.002979251
0.01632877
0.00539636
-115.98
4
0.79109035
0.07691809
-149.125
5
0.020264029
0.009736145
-235.3266
6
1.96831467
0.01911059
-16.45955
for Xi:n x Xi 1:n ; i 1, . . ., n 1
for
x X n:n
The Kolmogorov–Smirnov (K-S) test is a nonparametric
goodness-of-fit test and is used to determine whether an
underlying probability distribution (Fn(x)) differs from a
hypothesized distribution (F0(x)).
Kolmogorov-Smirnov (K-S) distance
The K-S distance between two distribution functions is
defined as
D max Fn (x) F0 (x i ) ,
n
1 in
-434.3901
3
x X1:n
where xl:n, x2:n, . . . , xn:n is the ordered sample.
LogLikelihood
alpha
for
and
D max F0 (x i ) Fn (x) ,
n
1 in
3. MODEL VALIDATION
Most statistical methods assume an underlying model in the
derivation of their results. However, when we presume that
the data follow a specific model, we are making an
assumption. If such a model does not hold, then the
conclusions from such analysis may be invalid. Although
hazard plotting and the other graphical methods can guide the
choice of the parametric distribution, one cannot of course be
where F0(xi) is the cumulative distribution function evaluated
at xi and Fn(x) is the EDF. To perform the two-sided goodness
of fit test H0 : F(x) = F0(x) for all x, where F is a completely
specified continuous distribution function against the
alternative H1 : F (x) = F0(x), for some x, the K-S statistic is
Dn max Dn , Dn
1 in
The distribution of the K-S statistic does not depend on F0 as
long as F0 is continuous.
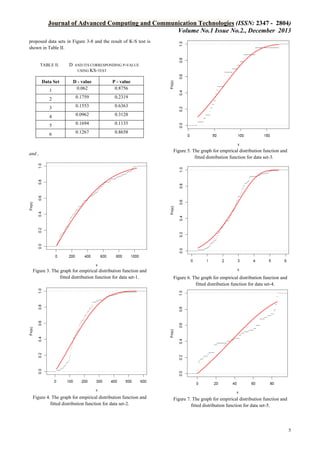
To study the goodness-of-fit of the Gompertz model, we
compute the Kolmogorov-Smirnov statistic between the
empirical distribution function and the fitted distribution
function when the parameters are obtained by method of
maximum likelihood. We shall use the ks.Gompertz( )
function in R to perform the test. Now, we plot the empirical
distribution function and the fitted distribution function using
4
5. Journal of Advanced Computing and Communication Technologies (ISSN: 2347 - 2804)
Volume No.1 Issue No.2., December 2013
proposed data sets in Figure 3-8 and the result of K-S test is
shown in Table II.
TABLE II.
Data Set
D
AND ITS CORRESPONDING P-VALUE
USING KS-TEST
1
D - value
0.062
P - value
0.8756
2
0.1759
0.2319
3
0.1553
0.6363
4
0.0962
0.3128
5
0.1694
0.1135
6
0.1267
0.8658
and ,
Figure 3. The graph for empirical distribution function and
fitted distribution function for data set-1.
Figure 4. The graph for empirical distribution function and
fitted distribution function for data set-2.
Figure 5. The graph for empirical distribution function and
fitted distribution function for data set-3.
Figure 6. The graph for empirical distribution function and
fitted distribution function for data set-4.
Figure 7. The graph for empirical distribution function and
fitted distribution function for data set-5.
5
6. Journal of Advanced Computing and Communication Technologies (ISSN: 2347 - 2804)
Volume No.1 Issue No.2., December 2013
Thus, the Q-Q plots show the estimated versus the
observed quantiles. If the model fits the data well, the pattern
of points on the Q-Q plot will exhibit a 45-degree straight
line. Note that all the points of a Q-Q plot are inside the
square
ˆ
ˆ
F1(p1:n ) , F1(pn:n ) x1:n , x n:n .
We shall use the qq.Gompertz( ) function to perform the test.
We draw Quantile-Quantile (Q-Q) plot using MLEs as
estimate for using different data set in given Figure 9-14
Figure 8. The graph for empirical distribution function and
fitted distribution function for data set-6.
Since, the high p-value clearly indicates that those data set can
be used to analyze Gompertz model and in this analysis from
Table II data set-1, data set-6 and data set-3 having high
p-value. Therefore from above result and Figure 3-8, it may
clear that the estimated Gompertz model provides excellent
good fit to the given data set-1, data set-6 and data set-3.
3.2 The Q-Q PlotsTest
The Q-Q plot test is used to investigate whether an
assumed model adequately fits a set of data. It helps the
analyst to assess how well a given theoretical distribution fits
the data.
ˆ
Let F(x) be an estimate of F(x) based on xl, x2,. . . , xn.
The scatter plot of the points
Figure 10. Quantile-Quantile(Q-Q) plot using MLEs as
estimate for data set-2.
ˆ
F1(p1:n ) versus xi : n , i = 1 , 2, . . . ,n ,
is called a Q-Q plot.
Figure 9. Quantile-Quantile(Q-Q) plot using MLEs as
estimate for data set-1.
Figure 11. Quantile-Quantile(Q-Q) plot using MLEs as
estimate for data set-3.
6
7. Journal of Advanced Computing and Communication Technologies (ISSN: 2347 - 2804)
Volume No.1 Issue No.2., December 2013
Thus, as can be seen from the straight line pattern in Figures
9-14, the Gompertz model much fits the data very well for
data set-1.
4. CONCLUSION
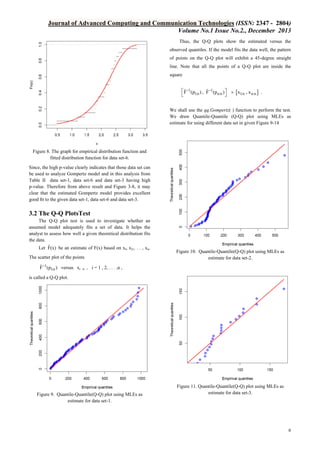
Figure 12. Quantile-Quantile(Q-Q) plot using MLEs as
estimate for data set-4.
An attempt has been made to incorporate Gompertz model for
software reliability data. We have presented the statistical
tools for empirical modeling of the data in general. These
tools are developed in R language and environment for model
analysis, model validation and estimation of parameters using
method of maximum likelihood. To check the validity of the
model, we have plotted a graph of empirical distribution
function and fitted distribution function using KS-test for
different data set and also we have to present power
comparison between p-values of these data sets obtaining by
K-S test for receiving feasible real data sets which are
excellent good fit for analysis of Gompertz model. We have
also discussed the Q-Q plots for model validation. Thus, from
both used techniques of model validation for Gompertz model
on different data set, the Gompertz model may fit the data
very well only for data set-1, data set-6 and data set-3.
ACKNOWLEDGMENT
The author is thankful to Dr. Vijay Kumar, Associate
Professor in Department of Mathematics and Statistics in
DDU Gorakhpur University, Gorakhpur, the editor and the
referees for their valuable suggestions, which improved the
paper to a great extent.
REFERENCES
[1].
[2].
Figure 13. Quantile-Quantile(Q-Q) plot using MLEs as
estimate for data set-5.
[3].
[4].
[5].
[6].
[7].
Figure 14. Quantile-Quantile(Q-Q) plot using MLEs as
estimate for data set-6.
Aarset, M. V. (1987). How to identify bathtub
hazard rate. IEEE Transactions Reliability,
36,106-108.
Bjerkedal T (1960). Acquisition of resistance in
guinea pigs infected with different doses of
virulent tubercle bacilli. Am. J. Epidemiol.
72(1):130-148.
Chen, Z. (1997) Parameter estimation of the
Gompertz population, Biometrical Journal 39
117–124.
Eastman, J. and Bain, L.J., (1973).A property of
maximum likelihood estimators in the presence of
location-scale
nuisance
parameters,
Communications in Statistics, 2, 23-28.
Franses, P.H. (1994) Fitting a Gompertz curve,
Journal of the Operational Research Society 45
109–113
Garg , M.L., Rao, B.R. and Redmond, C.K.
(1970) Maximum likelihood estimation of the
parameters of the Gompertz survival function,
Journal of the Royal Statistical Society C 19 152–
159.
Gompertz, B. On the nature of the function
expressive of the law of human mortality and on
the new mode of determining the value of life
contingencies, Philosophical Transactions of
Royal Society A 115 (1825) 513–580.
7
8. Journal of Advanced Computing and Communication Technologies (ISSN: 2347 - 2804)
Volume No.1 Issue No.2., December 2013
[8].
[9].
[10].
[11].
Gordon, N.H. (1990) Maximum likelihood
estimation for mixtures of two Gompertz
distributions
when
censoring
occurs,
Communications in Statistics B: Simulation and
Computation 19733–747.
Hazewinkel, Michiel, ed. (2001), "KolmogorovSmirnov test", Encyclopedia of Mathematics,
Springer, ISBN 978-1-55608-010-4
Ihaka, R. and Gentleman, R.R. (1996). R: A
language for data analysis and graphics, Journal
of Computational and Graphical Statistics, 5,
299–314.
Kumar, R., Srivastava, A.K. and Kumar, V.
(2013) “Exponentiated Gumbel Model for
Software Reliability Data Analysis using MCMC
simulation method”, International Journal of
Computer Applications, Vol.62(20), 24-32, ISSN:
0975–8887.
[12].
Lai, C.D., Xie, M., Murthy, D. (2003). A
modified Weibull distribution. IEEE Transactions
on Reliability 52 (1), 33-37.
[13].
Lawless, J. F., (2003). Statistical Models and
Methods for Lifetime Data, 2nd ed., John Wiley
and Sons, New York.
Lyu M.R., (1996).
Handbook of Software
Reliability Engineering, IEEE Computer Society
Press, McGraw Hill, 1996.
Makany, R. (1991) A theoretical basis of
Gompertz_s curve, Biometrical Journal 33 121–
128.
Nichols, M.D., W.J. Padgett, W.J. (2006), A
bootstrap control chart for Weibull percentiles,
“Quality
and
Reliability
Engineering
International”, 22, pp. 141-151.
Rao, B.R., Damaraju, C.V. (1992) New better
than used and other concepts for a class of life
distribution, Biometrical Journal 34 919–935.
Read, C.B. (1983) Gompertz Distribution,
Encyclopedia of Statistical Sciences, Wiley, New
York.
Srivastava, A.K. and Kumar, V.(2011). “Analysis
of Pham(Loglog) Reliability Model using
Bayesian Approach”, International Journal
‘Computer Science Journal’, Vol. 1(2),79-100,
ISSN: 2221–5905.
Srivastava, A.K. and Kumar, V.(2011). “Markov
Chain Monte Carlo Methods for Bayesian
Inference of the Chen Model”, International
Journal of Computer Information Systems, Vol.
2(2), 07-14, ISSN: 2229-5208.
Venables, W. N., Smith, D. M. and R
Development Core Team (2010). An Introduction
to R, R Foundation for Statistical Computing,
Vienna,
Austria.
ISBN
3-900051-12-7,
http://www.r-project.org.
Wu, J.W., Lee, W.C. (1999) Characterization of
the mixtures of Gompertz distributions by
[14].
[15].
[16].
[17].
[18].
[19].
[20].
[21].
[22].
conditional expectation of order
Biometrical Journal 41 371–381.
statistics,
AUTHOR’S PROFILE
ASHWINI
KUMAR
SRIVASTAVA received
his M.Sc in Mathematics
from
D.D.U.Gorakhpur
University, MCA(Hons.)
from
U.P.Technical
University, M. Phil in
Computer Science from
Allagappa University and
Ph.D. in Computer Science
from
D.D.U.Gorakhpur
University,
Gorakhpur.
Currently working as Assistant Professor in Department of
Computer Application in Shivharsh Kisan P.G. College, Basti,
U.P. He has got 9 years of teaching experience as well as 5
years research experience. His main research interests are
Software Reliability, Artificial Neural Networks, Bayesian
methodology and Data Warehousing.
8