Download to read offline
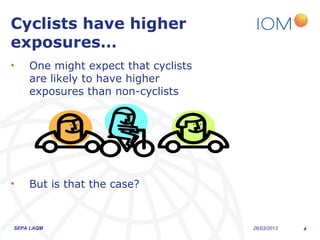
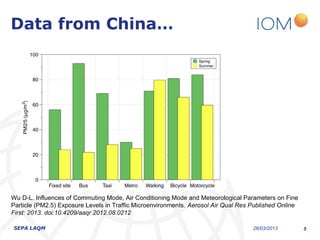
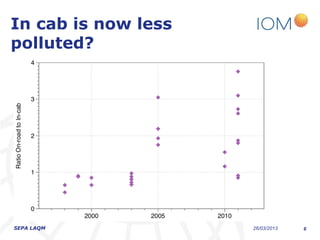
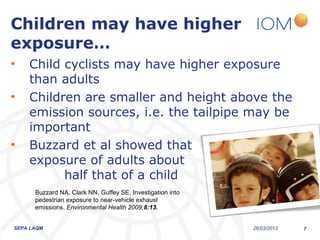
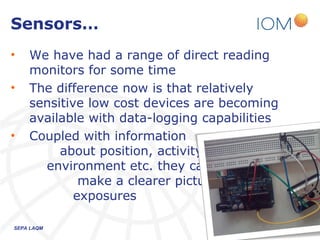
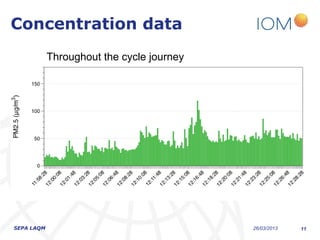

The document discusses the varying exposure levels to air pollutants experienced by cyclists compared to non-cyclists, with a focus on children who may face even higher risks due to their height. It highlights the potential of low-cost sensors to better assess air quality and pollution exposure during cycling journeys. The findings indicate significant variations in pollutant concentrations influenced by traffic conditions and specific environments.


