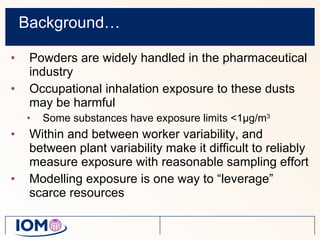
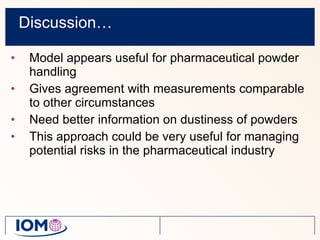
Modelling exposure to pharmaceutical agents  J W Cherrie  1 , A T Gillies  2 , A Sleeuwenhoek  1 ,  M van Tongeren  1 , P McDonnell  3 , M Coggins  3 , S R Bailey  4   1. Institute of Occupational Medicine, UK. 2. Gillies Associates Ltd, UK. 3. National University of Ireland, Galway, Ireland. 4. GlaxoSmithKline, UK.
Summary… Background The model used for this study Adaptions for the pharmaceutical industry Results from a  “validation” exercise Discussion of future uses
Background… Powders are widely handled in the pharmaceutical industry Occupational inhalation exposure to these dusts may be harmful Some substances have exposure limits < 1µg/m 3   Within and between worker variability, and between plant variability make it difficult to reliably measure exposure with reasonable sampling effort Modelling exposure is one way to “leverage” scarce resources
The model… Originally developed for use in epidemiological research Use being extended into regulatory risk assessment Advanced REACH Tool (ART) Simple source-receptor model that relies on the assessor to select appropriate model parameters Validated in a number of previous situations, including mineral fibres, respirable dusts, PAH, benzene, solvents
Typical validation data…
The model… intrinsic properties  of the contaminant (ε i ),  the dustiness of a solid and the proportion of API in the mixture the way the material is  handled (h) ,  e.g. careful scooping of a powder the efficiency of  local controls  (1-η lv ).  These parameters are multiplied together
The model… passive or fugitive emission (ε p ) the fractional time the source was active ( t a )  the efficiency of respiratory protection (1- η ppe ) C  = (ε i   .  h .  (1 -η  lv  ) .  t a  + ε p  ) . (1 - η ppe  )
The model… Near and far-field Dispersion term dependant on the room ventilation and size C NF   = ( (ε i   .  h .  (1 - η lv  )) NF  .  t a,NF  + ε p,NF ) .  (1 - η ppe ) . d gv,NF   C FF   = ( (ε i   .  h .  (1 - η lv   )) FF  .  t a,FF  + ε p,FF ) . (1 - η ppe ) .  d gv,FF
Adaptions for the pharma industry Specific guidance for the industry
Validation… Three assessors (JWC, AS and PMcD) 27 scenarios with widely differing circumstances Assessors get written description of the scenario and then estimate the inhalation exposure level Blinded to the measurements
Results…
Discussion… Model appears useful for pharmaceutical powder handling  Gives agreement with measurements comparable to other circumstances Need better information on dustiness of powders This approach could be very useful for managing potential risks in the pharmaceutical industry

Inhaled Particles presentation on exposure modelling

  • 1.
    Modelling exposure topharmaceutical agents J W Cherrie 1 , A T Gillies 2 , A Sleeuwenhoek 1 , M van Tongeren 1 , P McDonnell 3 , M Coggins 3 , S R Bailey 4 1. Institute of Occupational Medicine, UK. 2. Gillies Associates Ltd, UK. 3. National University of Ireland, Galway, Ireland. 4. GlaxoSmithKline, UK.
  • 2.
    Summary… Background Themodel used for this study Adaptions for the pharmaceutical industry Results from a “validation” exercise Discussion of future uses
  • 3.
    Background… Powders arewidely handled in the pharmaceutical industry Occupational inhalation exposure to these dusts may be harmful Some substances have exposure limits < 1µg/m 3 Within and between worker variability, and between plant variability make it difficult to reliably measure exposure with reasonable sampling effort Modelling exposure is one way to “leverage” scarce resources
  • 4.
    The model… Originallydeveloped for use in epidemiological research Use being extended into regulatory risk assessment Advanced REACH Tool (ART) Simple source-receptor model that relies on the assessor to select appropriate model parameters Validated in a number of previous situations, including mineral fibres, respirable dusts, PAH, benzene, solvents
  • 5.
  • 6.
    The model… intrinsicproperties of the contaminant (ε i ), the dustiness of a solid and the proportion of API in the mixture the way the material is handled (h) , e.g. careful scooping of a powder the efficiency of local controls (1-η lv ). These parameters are multiplied together
  • 7.
    The model… passiveor fugitive emission (ε p ) the fractional time the source was active ( t a ) the efficiency of respiratory protection (1- η ppe ) C = (ε i . h . (1 -η lv ) . t a + ε p ) . (1 - η ppe )
  • 8.
    The model… Nearand far-field Dispersion term dependant on the room ventilation and size C NF = ( (ε i . h . (1 - η lv )) NF . t a,NF + ε p,NF ) . (1 - η ppe ) . d gv,NF   C FF = ( (ε i . h . (1 - η lv )) FF . t a,FF + ε p,FF ) . (1 - η ppe ) . d gv,FF
  • 9.
    Adaptions for thepharma industry Specific guidance for the industry
  • 10.
    Validation… Three assessors(JWC, AS and PMcD) 27 scenarios with widely differing circumstances Assessors get written description of the scenario and then estimate the inhalation exposure level Blinded to the measurements
  • 11.
  • 12.
    Discussion… Model appearsuseful for pharmaceutical powder handling Gives agreement with measurements comparable to other circumstances Need better information on dustiness of powders This approach could be very useful for managing potential risks in the pharmaceutical industry

Editor's Notes

  • #2 Thank you. This paper describes work that is being carried out collaboratively with the National University of Galway, Gillies Associates and GSK. I’d like to acknowledge the contributions of my coauthors.
  • #3 I’ll set out the background to the project, describe the model that we have been using for a number of years to reconstruct inhalation exposures to a wide range of substances and the adaption&apos;s we have made to apply it in the pharma industry to assess exposure to poowders, and the results of a validation exercise. We believe the methodology could be very useful for the industry in helping focus efforts on control and in maximizing the impact of any monitoring carried out. I’ll discuss these and other uses that the model has.
  • #6 Correlation on the log scale is 0.91 Bias Outliers
  • #10 Allow some variation to account for systems that are either better or worse than the indicated level Handling covered 4-orders of magnitude form careful weighing to sweeping with a broom Intrinsic emission not different
  • #12 Correlation between 0.88 and 0.97 (excluding the data &lt;100 micro-g/m3 reduced the correlation slightly) Note the scatter is partly due to error in the assessment and partly the error in the measurements, which are mostly based on small numbers. Two assessors with a slight positive bias and one with a negative bias. &lt;7% of the assessments are &lt;10% of the mean measurement
  • #13 ART Bayesian updating helps eliminate the bias