Story point estimating using the Fibonacci sequence is the most common agile estimating technique. It provides better and more accurate estimates than hourly estimates with less variation. Story points also cut estimation time by 80% allowing teams to estimate and track work more. Regularly measuring a team's velocity enables accurate forecasting of schedules and costs for a release. Agile estimating with story points is more efficient than traditional techniques.
Trends in AgileEstimating
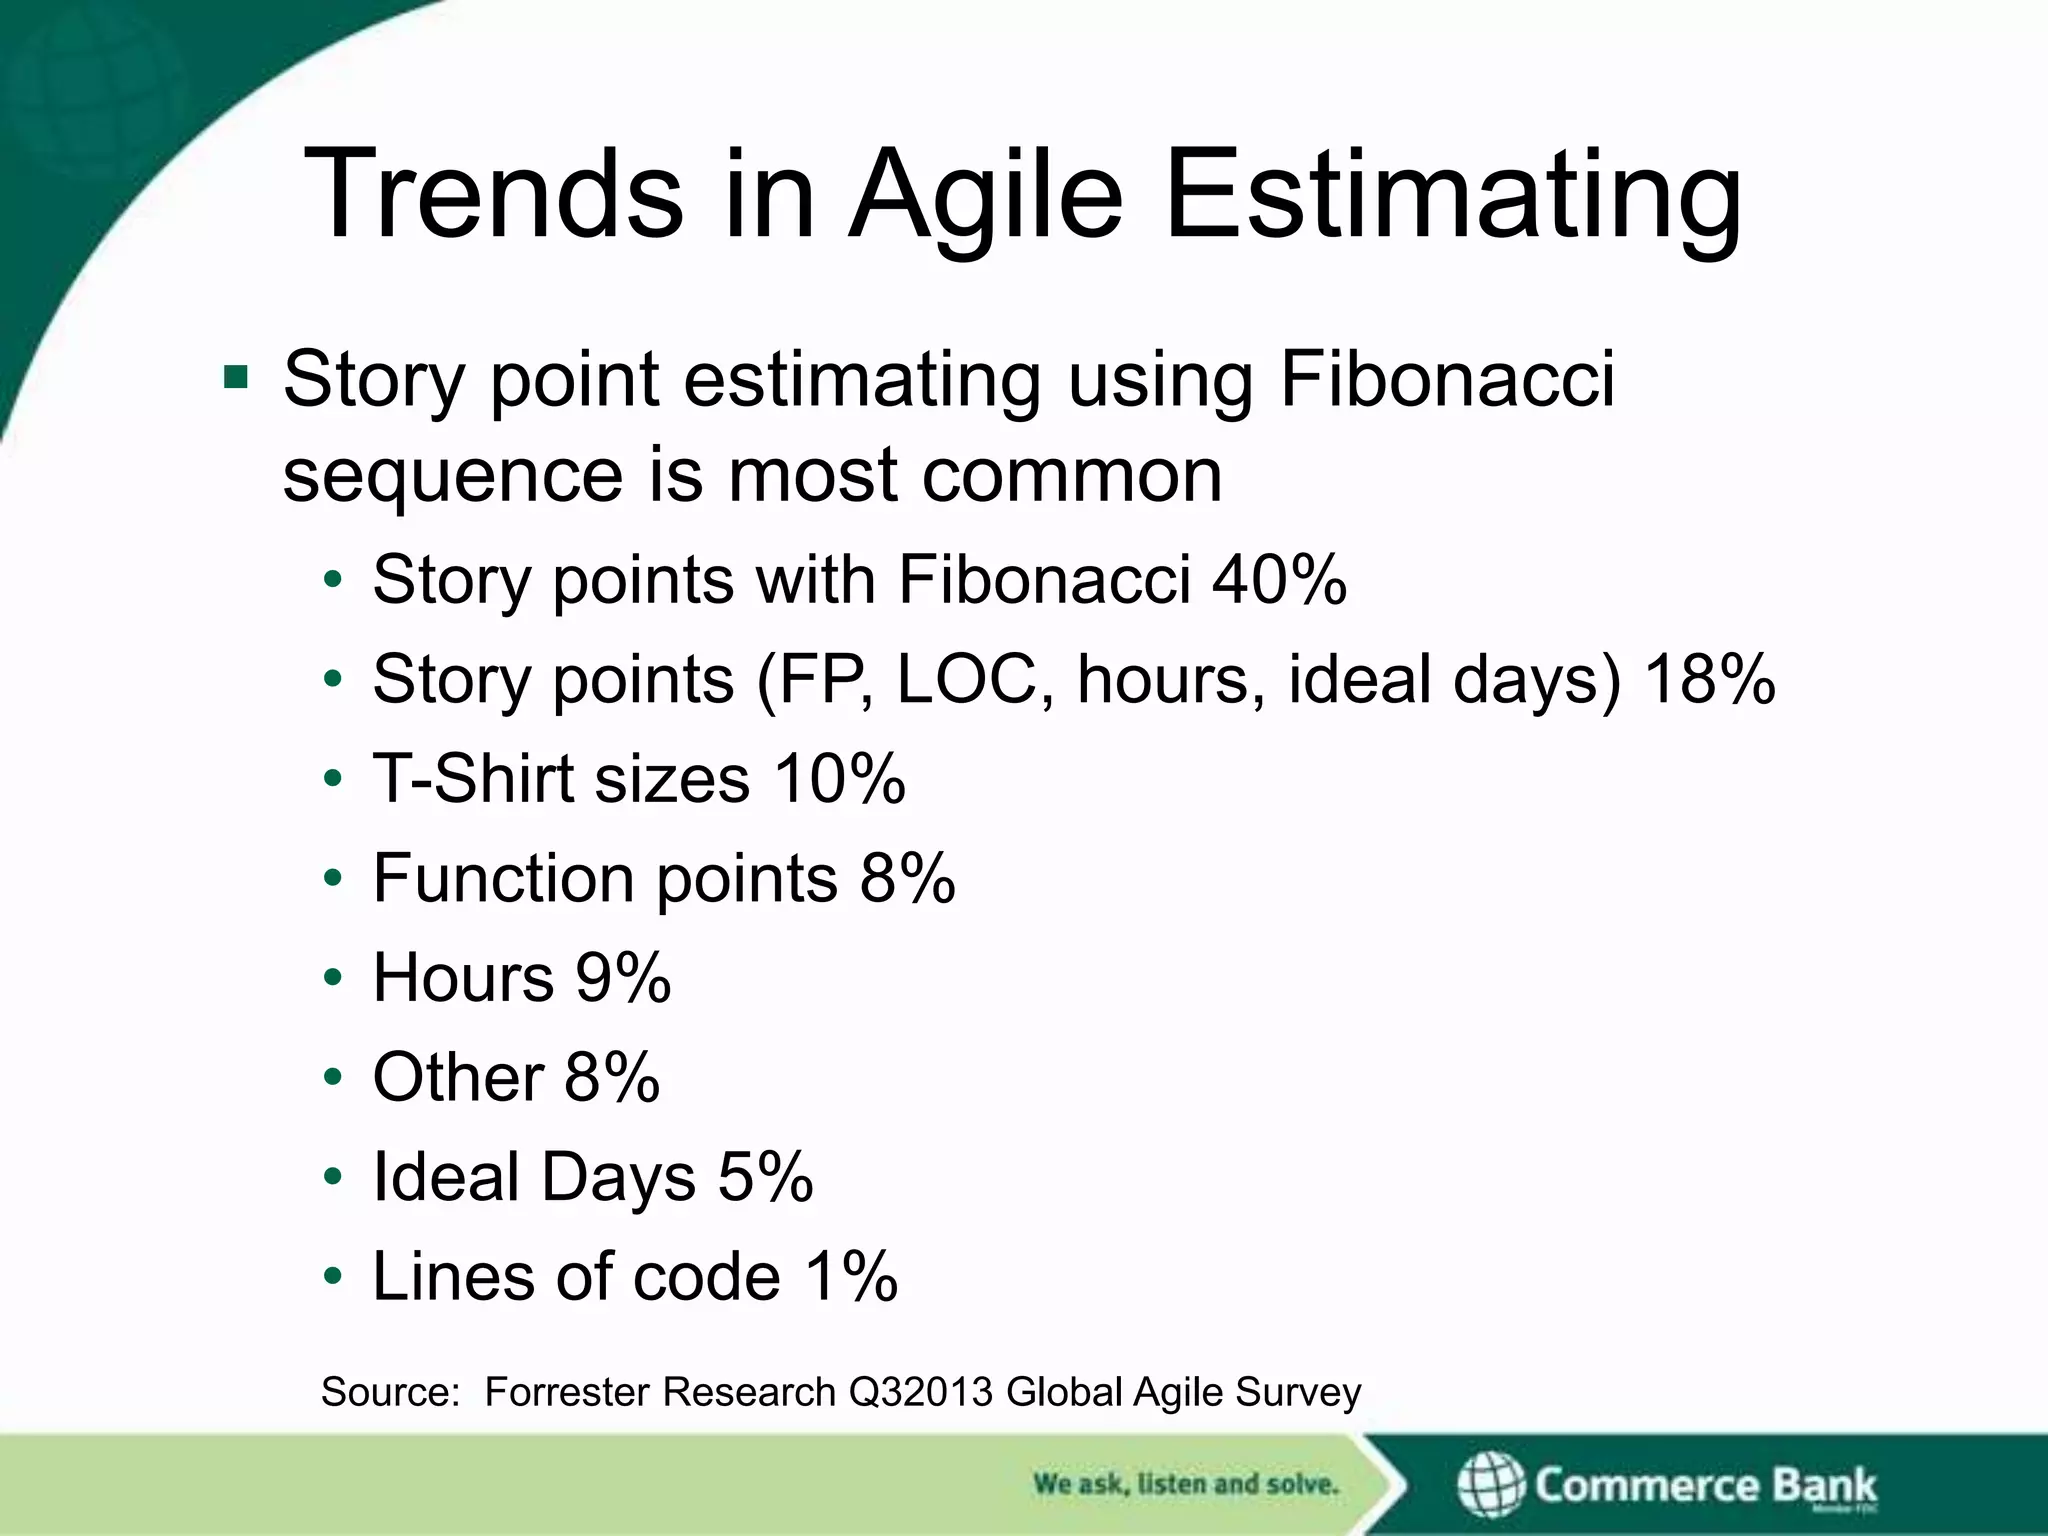
Story point estimating using Fibonacci
sequence is most common
•
•
•
•
•
•
•
•
Story points with Fibonacci 40%
Story points (FP, LOC, hours, ideal days) 18%
T-Shirt sizes 10%
Function points 8%
Hours 9%
Other 8%
Ideal Days 5%
Lines of code 1%
Source: Forrester Research Q32013 Global Agile Survey
3.
Research Findings
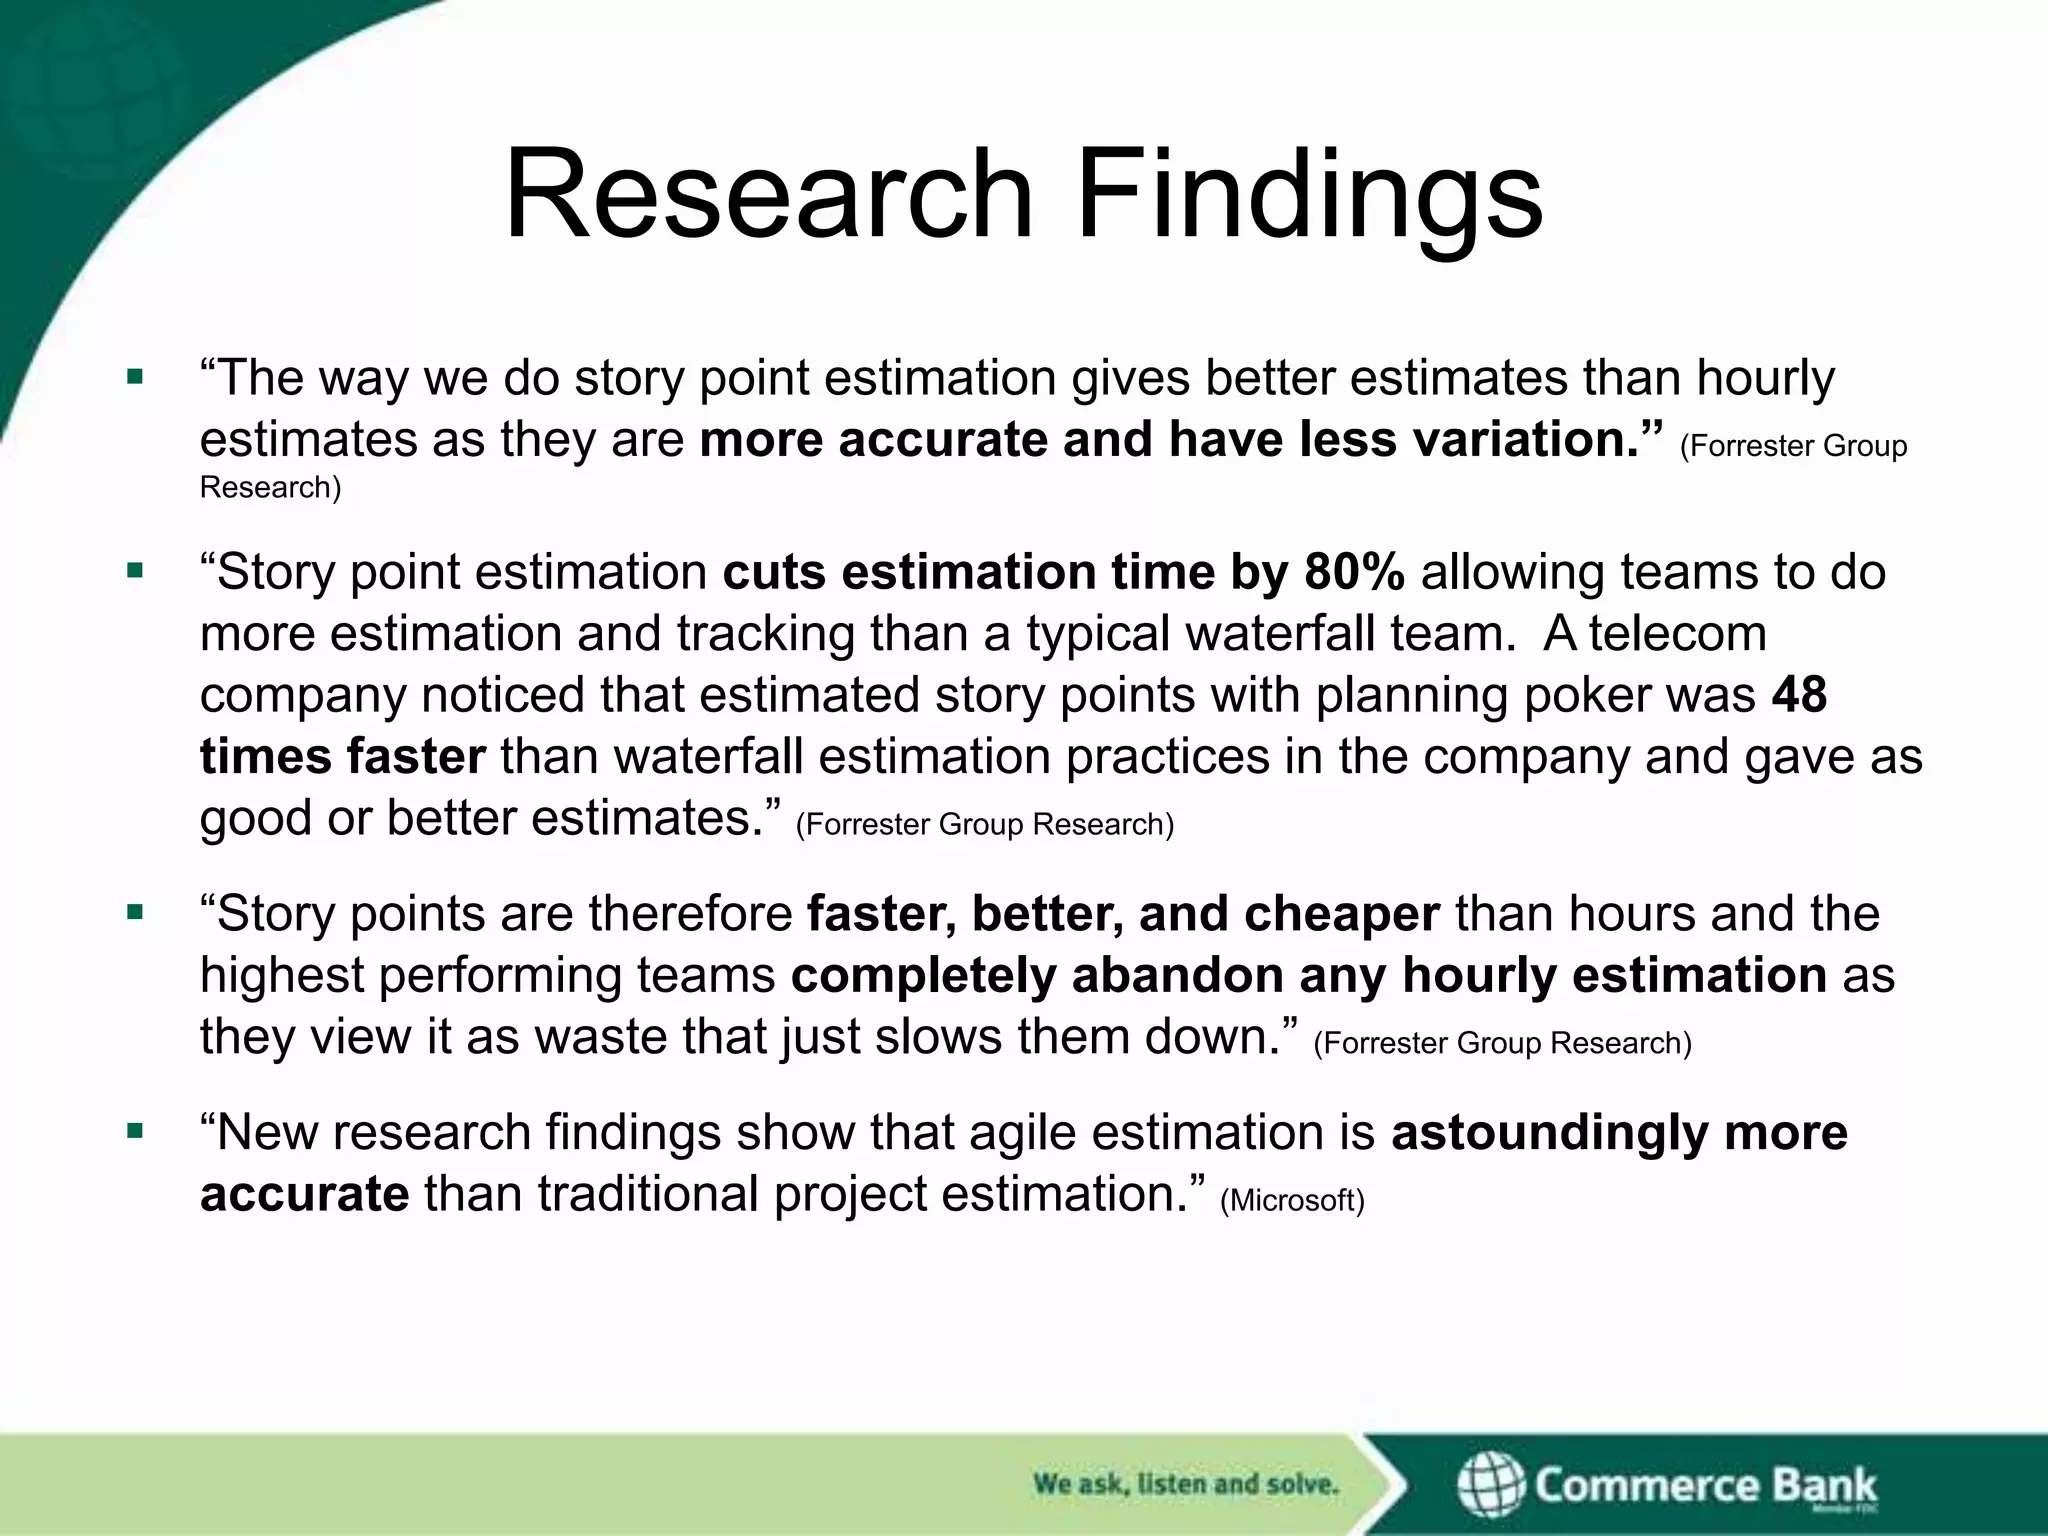
“The waywe do story point estimation gives better estimates than hourly
estimates as they are more accurate and have less variation.” (Forrester Group
Research)
“Story point estimation cuts estimation time by 80% allowing teams to do
more estimation and tracking than a typical waterfall team. A telecom
company noticed that estimated story points with planning poker was 48
times faster than waterfall estimation practices in the company and gave as
good or better estimates.” (Forrester Group Research)
“Story points are therefore faster, better, and cheaper than hours and the
highest performing teams completely abandon any hourly estimation as
they view it as waste that just slows them down.” (Forrester Group Research)
“New research findings show that agile estimation is astoundingly more
accurate than traditional project estimation.” (Microsoft)
4.
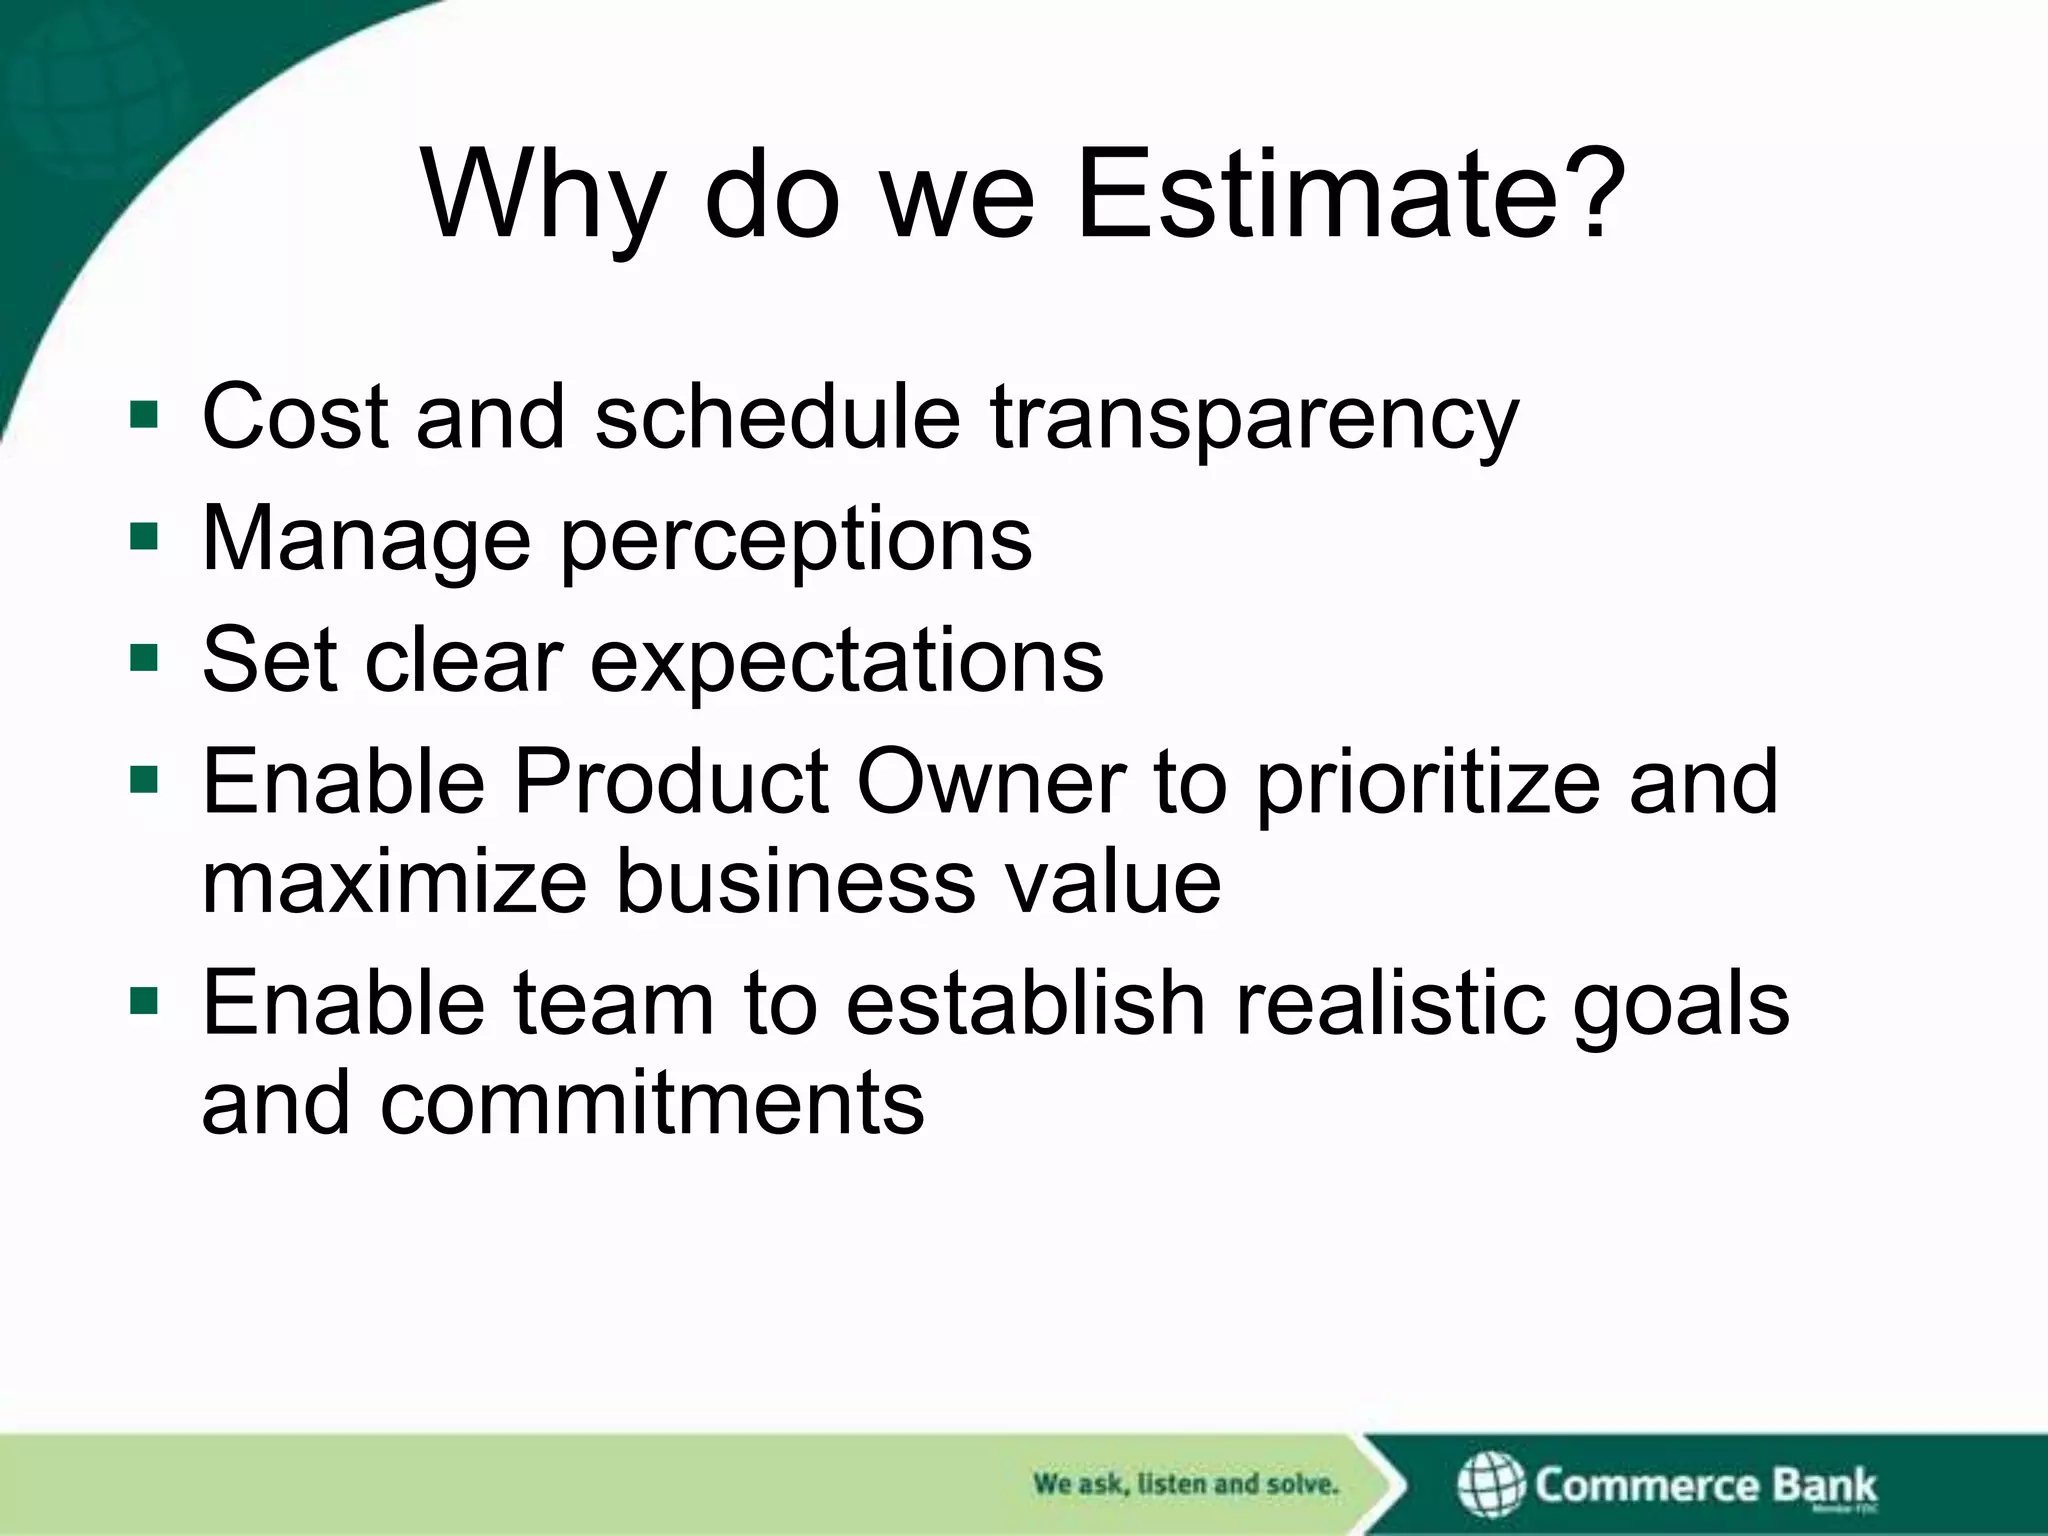
Why do weEstimate?
Cost and schedule transparency
Manage perceptions
Set clear expectations
Enable Product Owner to prioritize and
maximize business value
Enable team to establish realistic goals
and commitments
5.
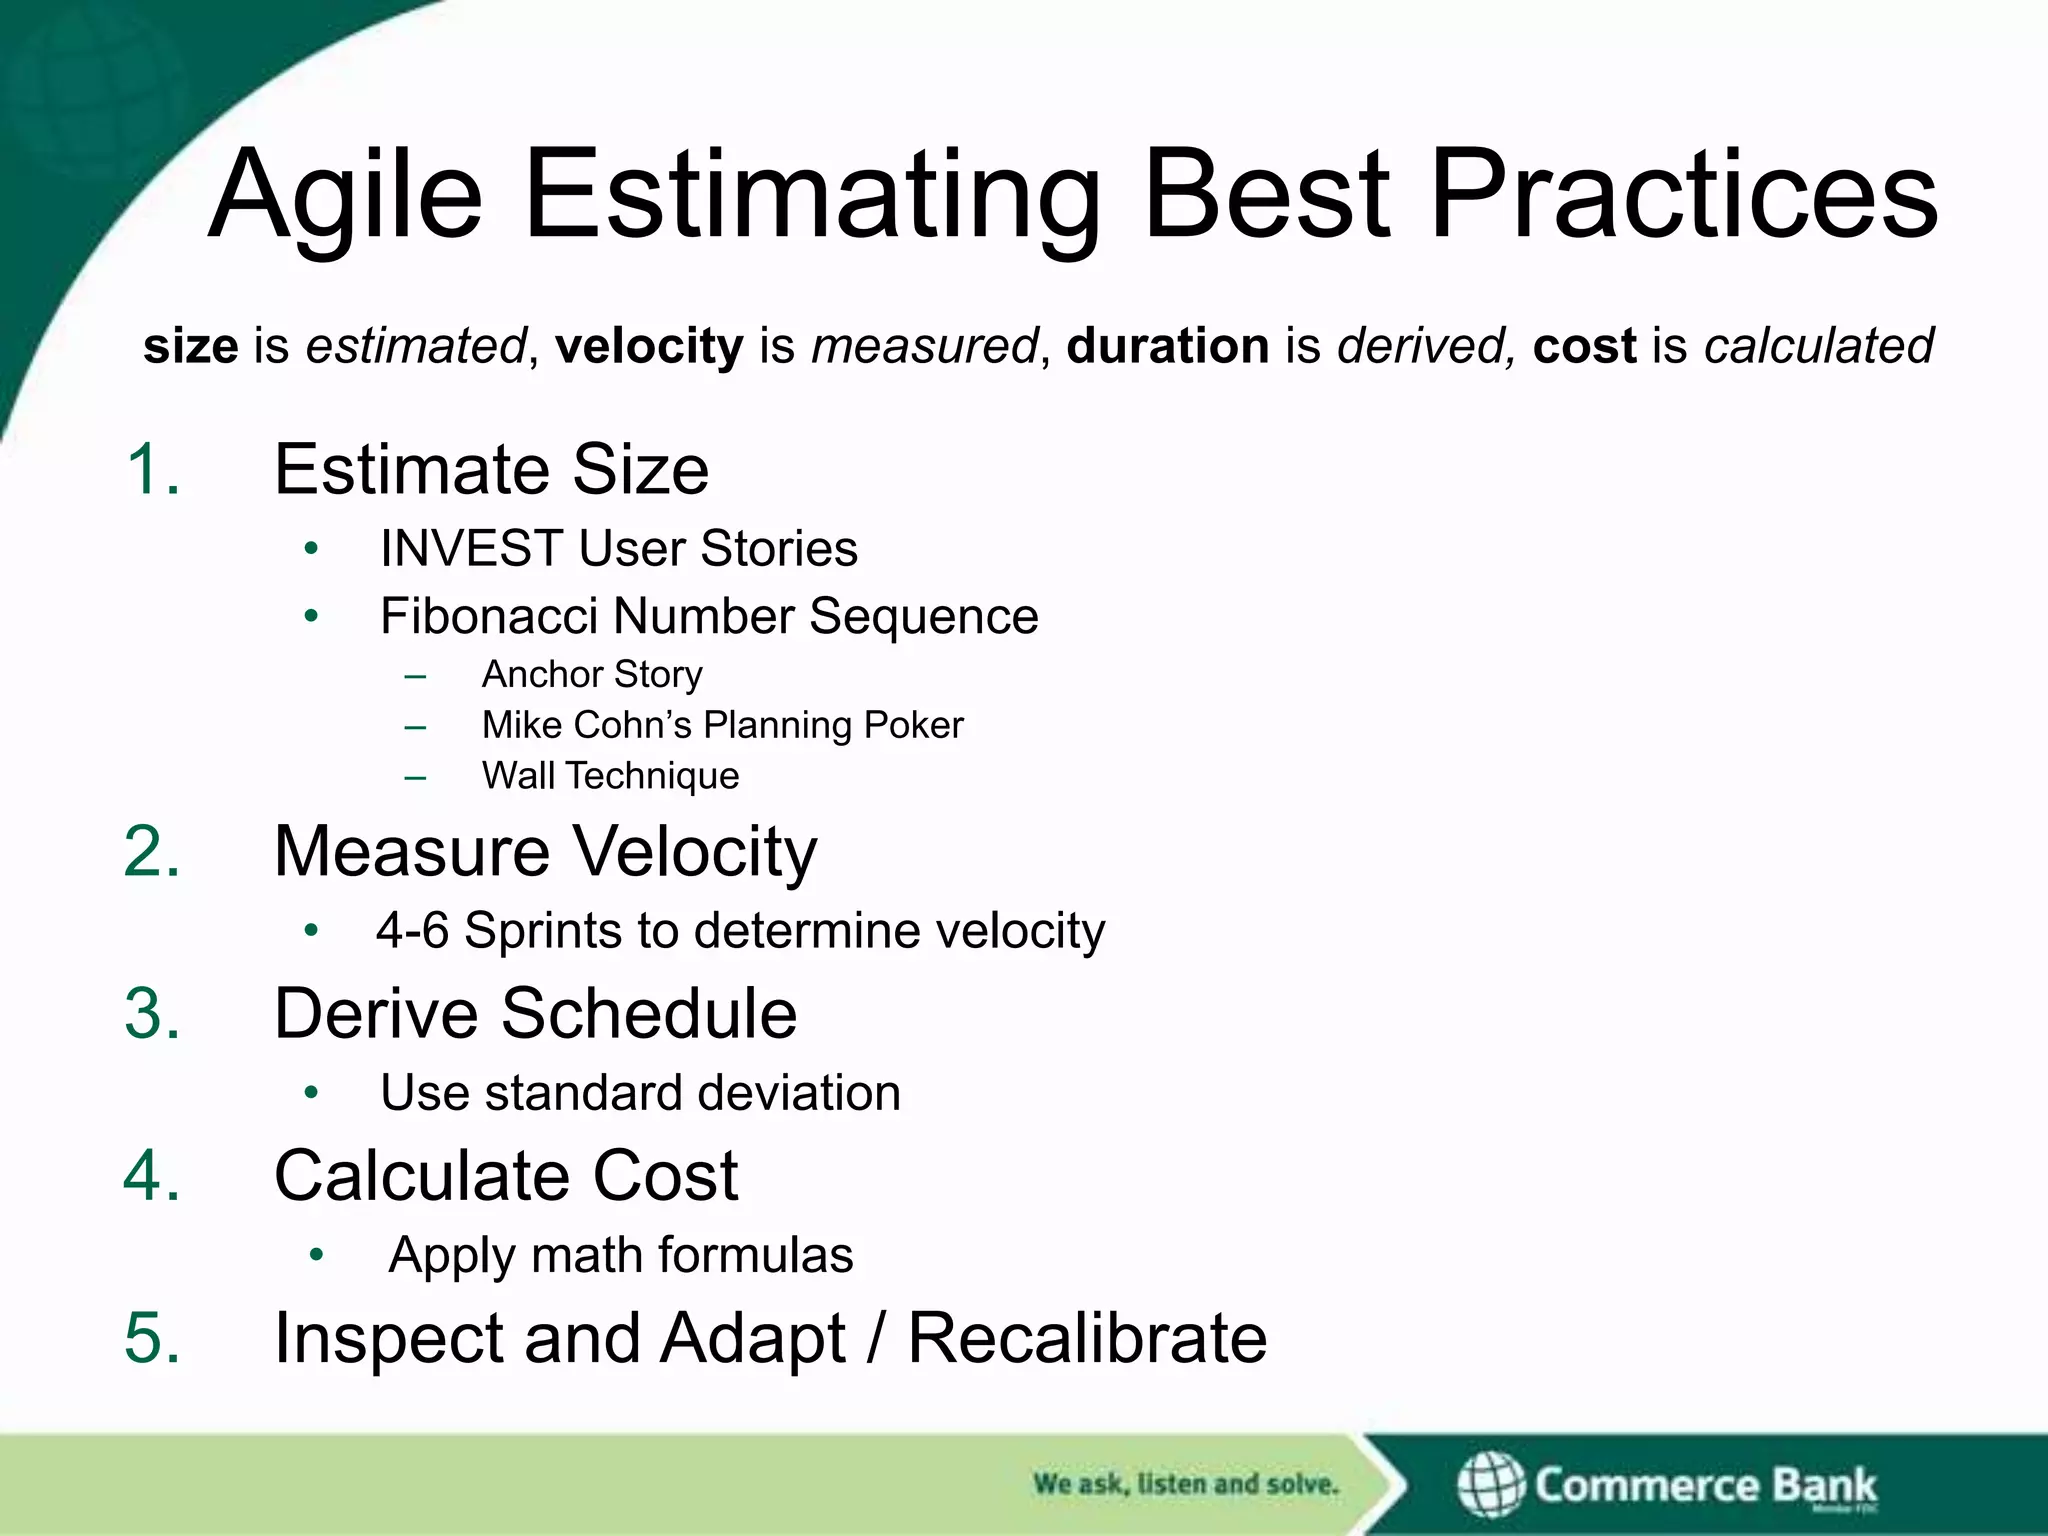
Agile Estimating BestPractices
size is estimated, velocity is measured, duration is derived, cost is calculated
1.
Estimate Size
•
•
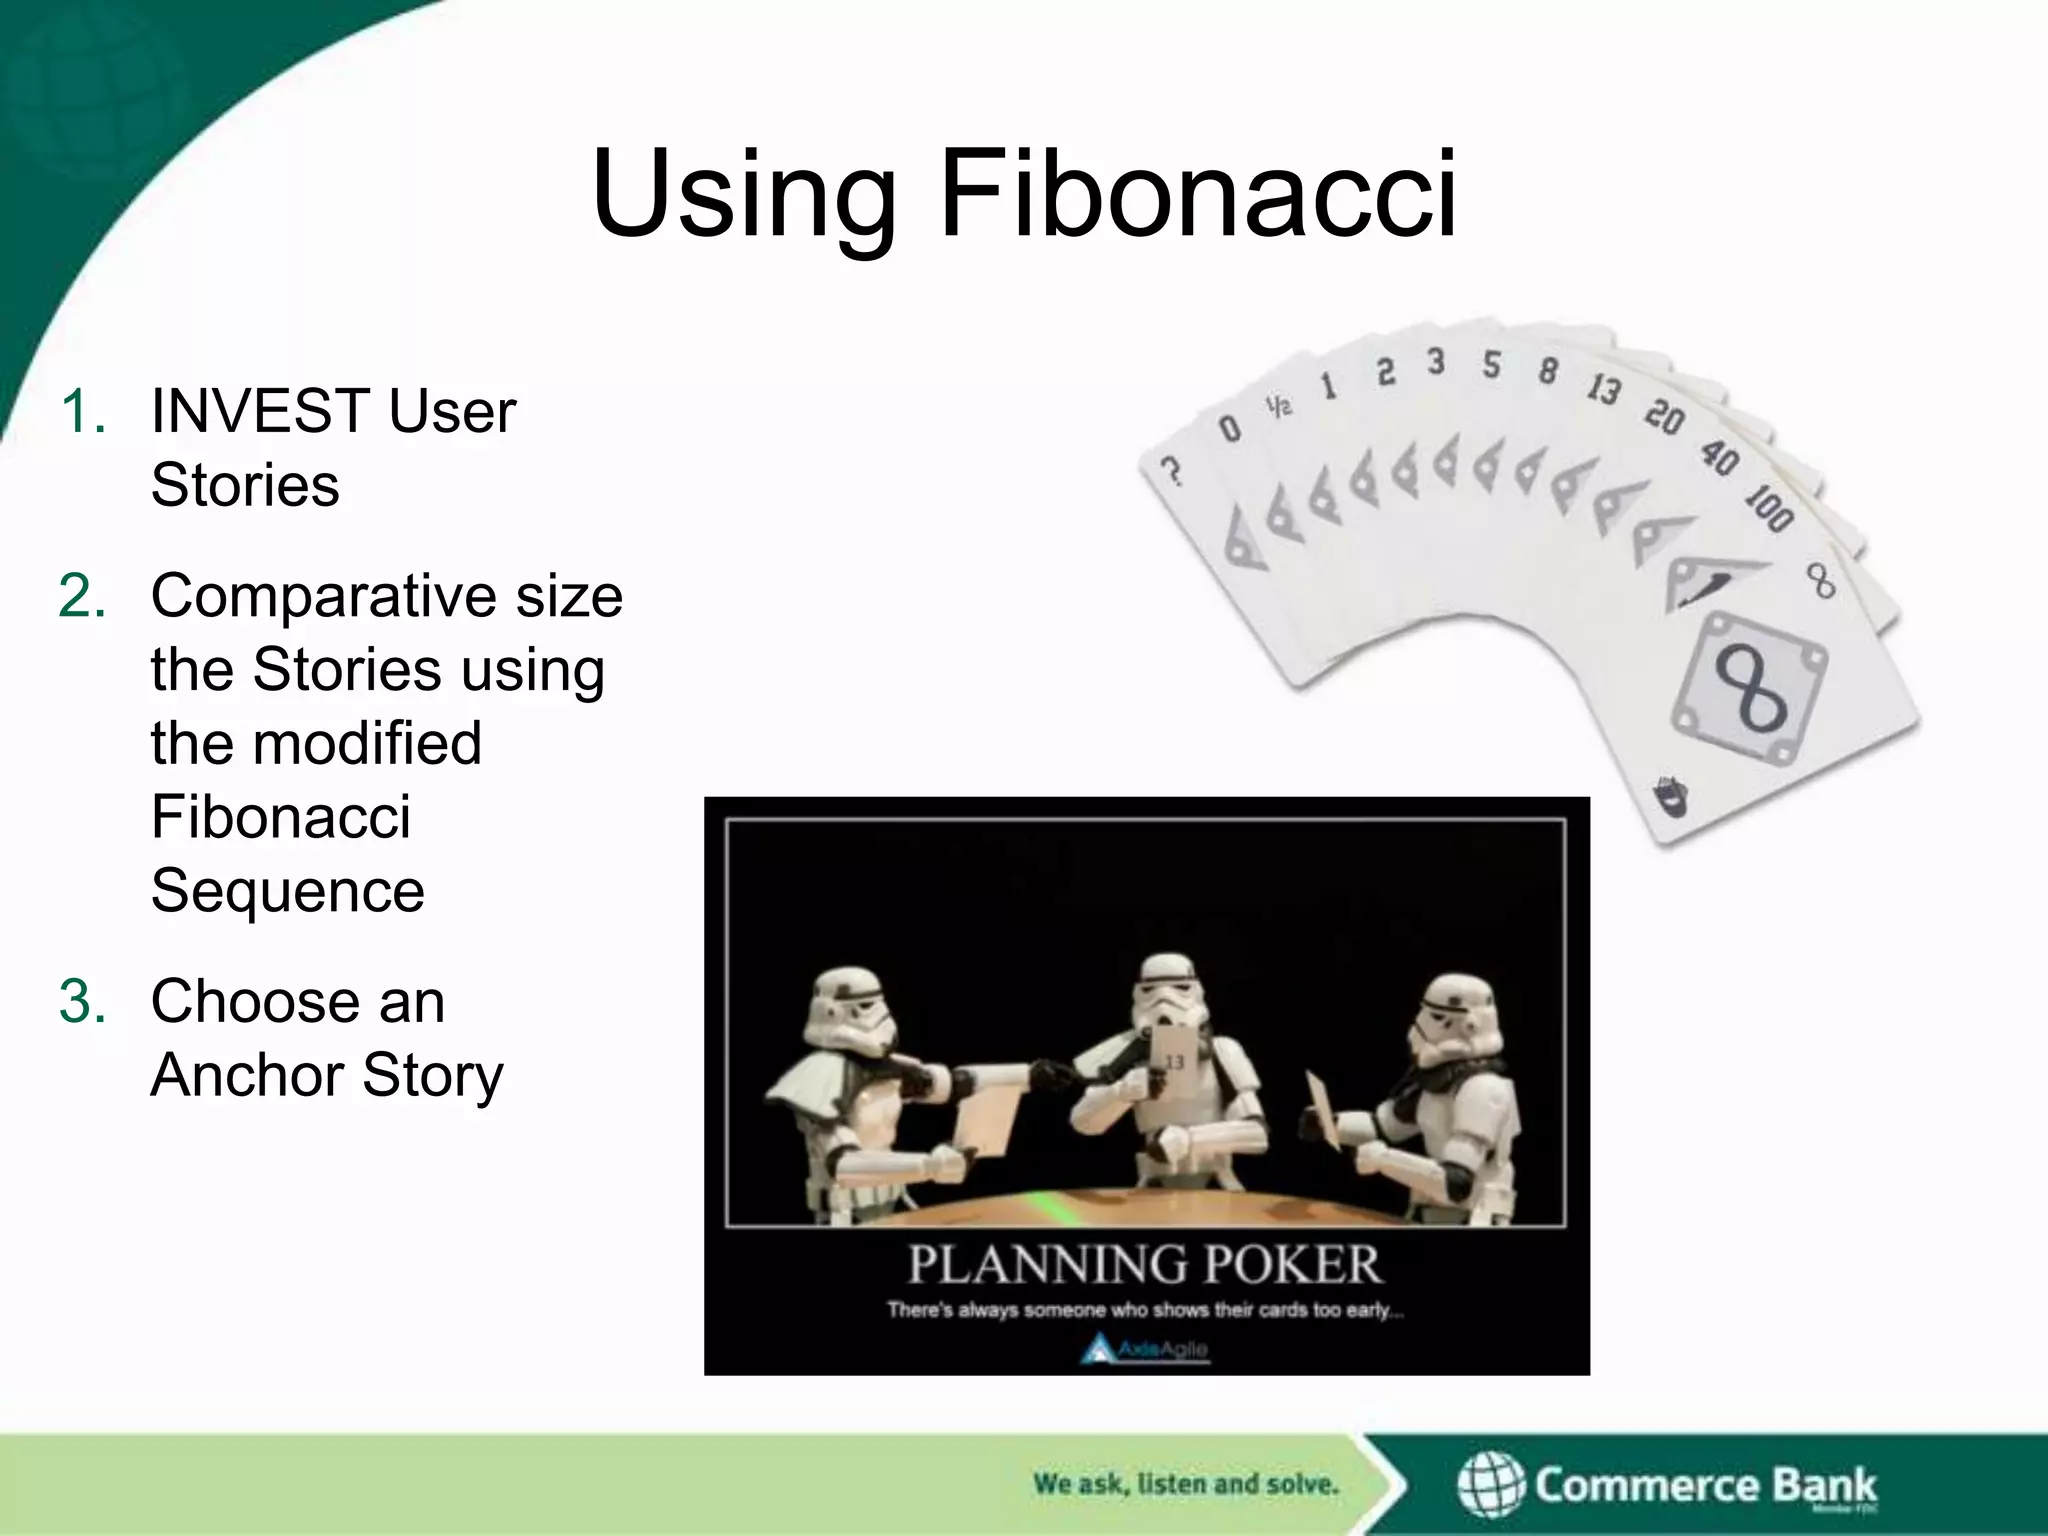
INVEST User Stories
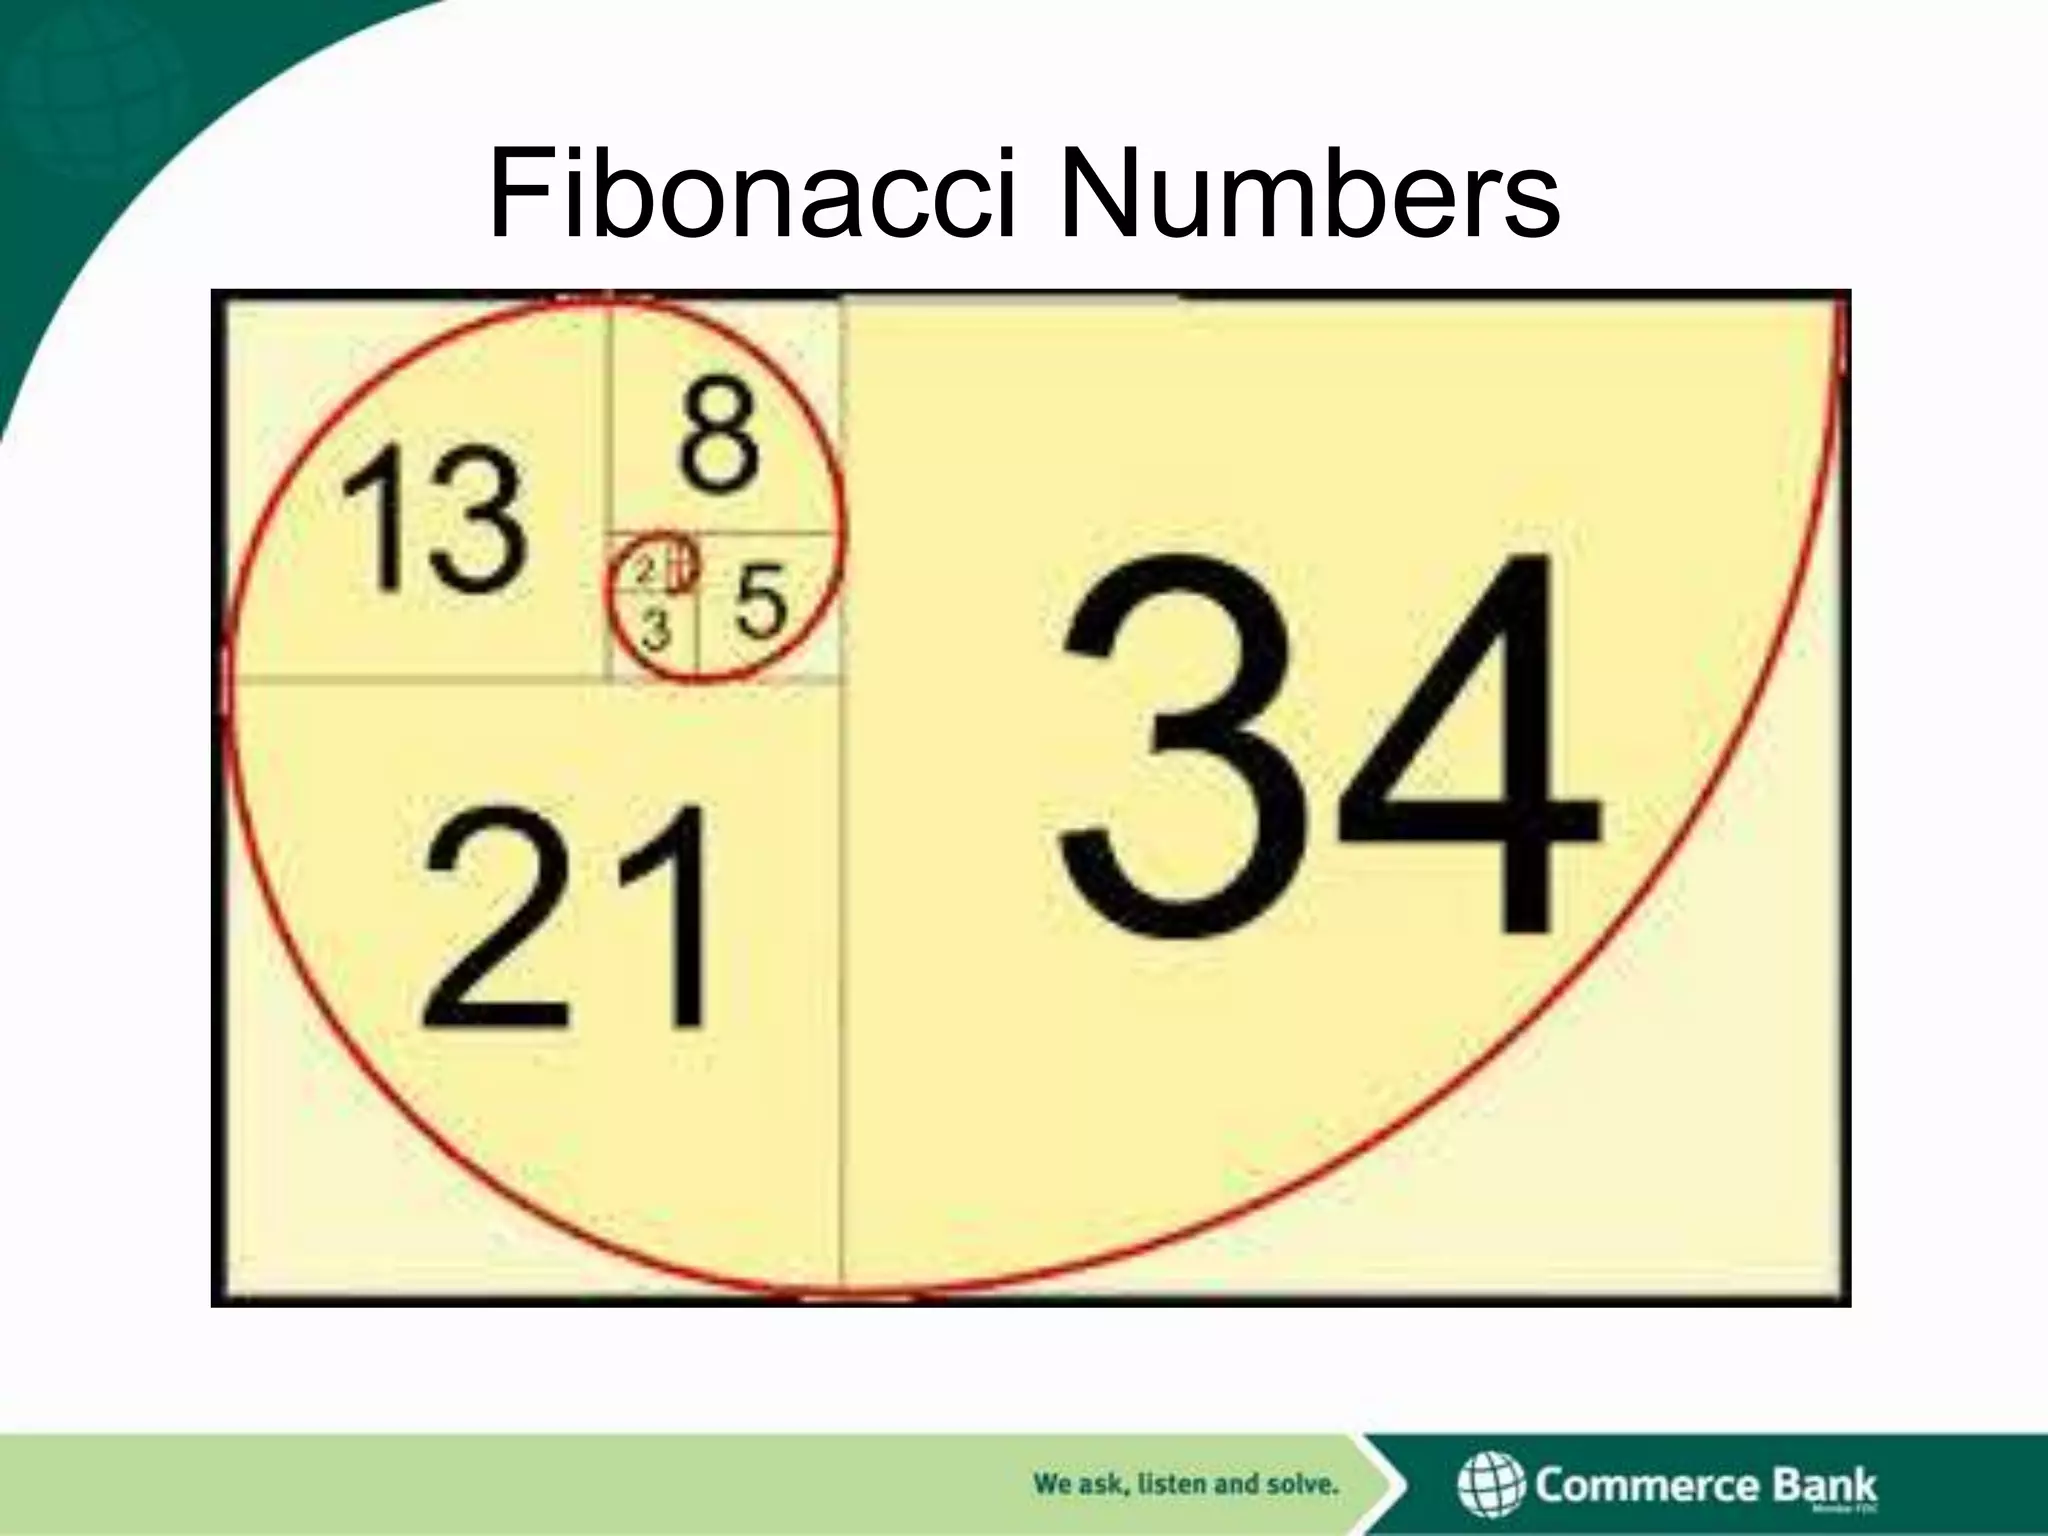
Fibonacci Number Sequence
–
–
–
2.
Measure Velocity
•
3.
Use standard deviation
Calculate Cost
•
5.
4-6 Sprints to determine velocity
Derive Schedule
•
4.
Anchor Story
Mike Cohn’s Planning Poker
Wall Technique
Apply math formulas
Inspect and Adapt / Recalibrate
6.
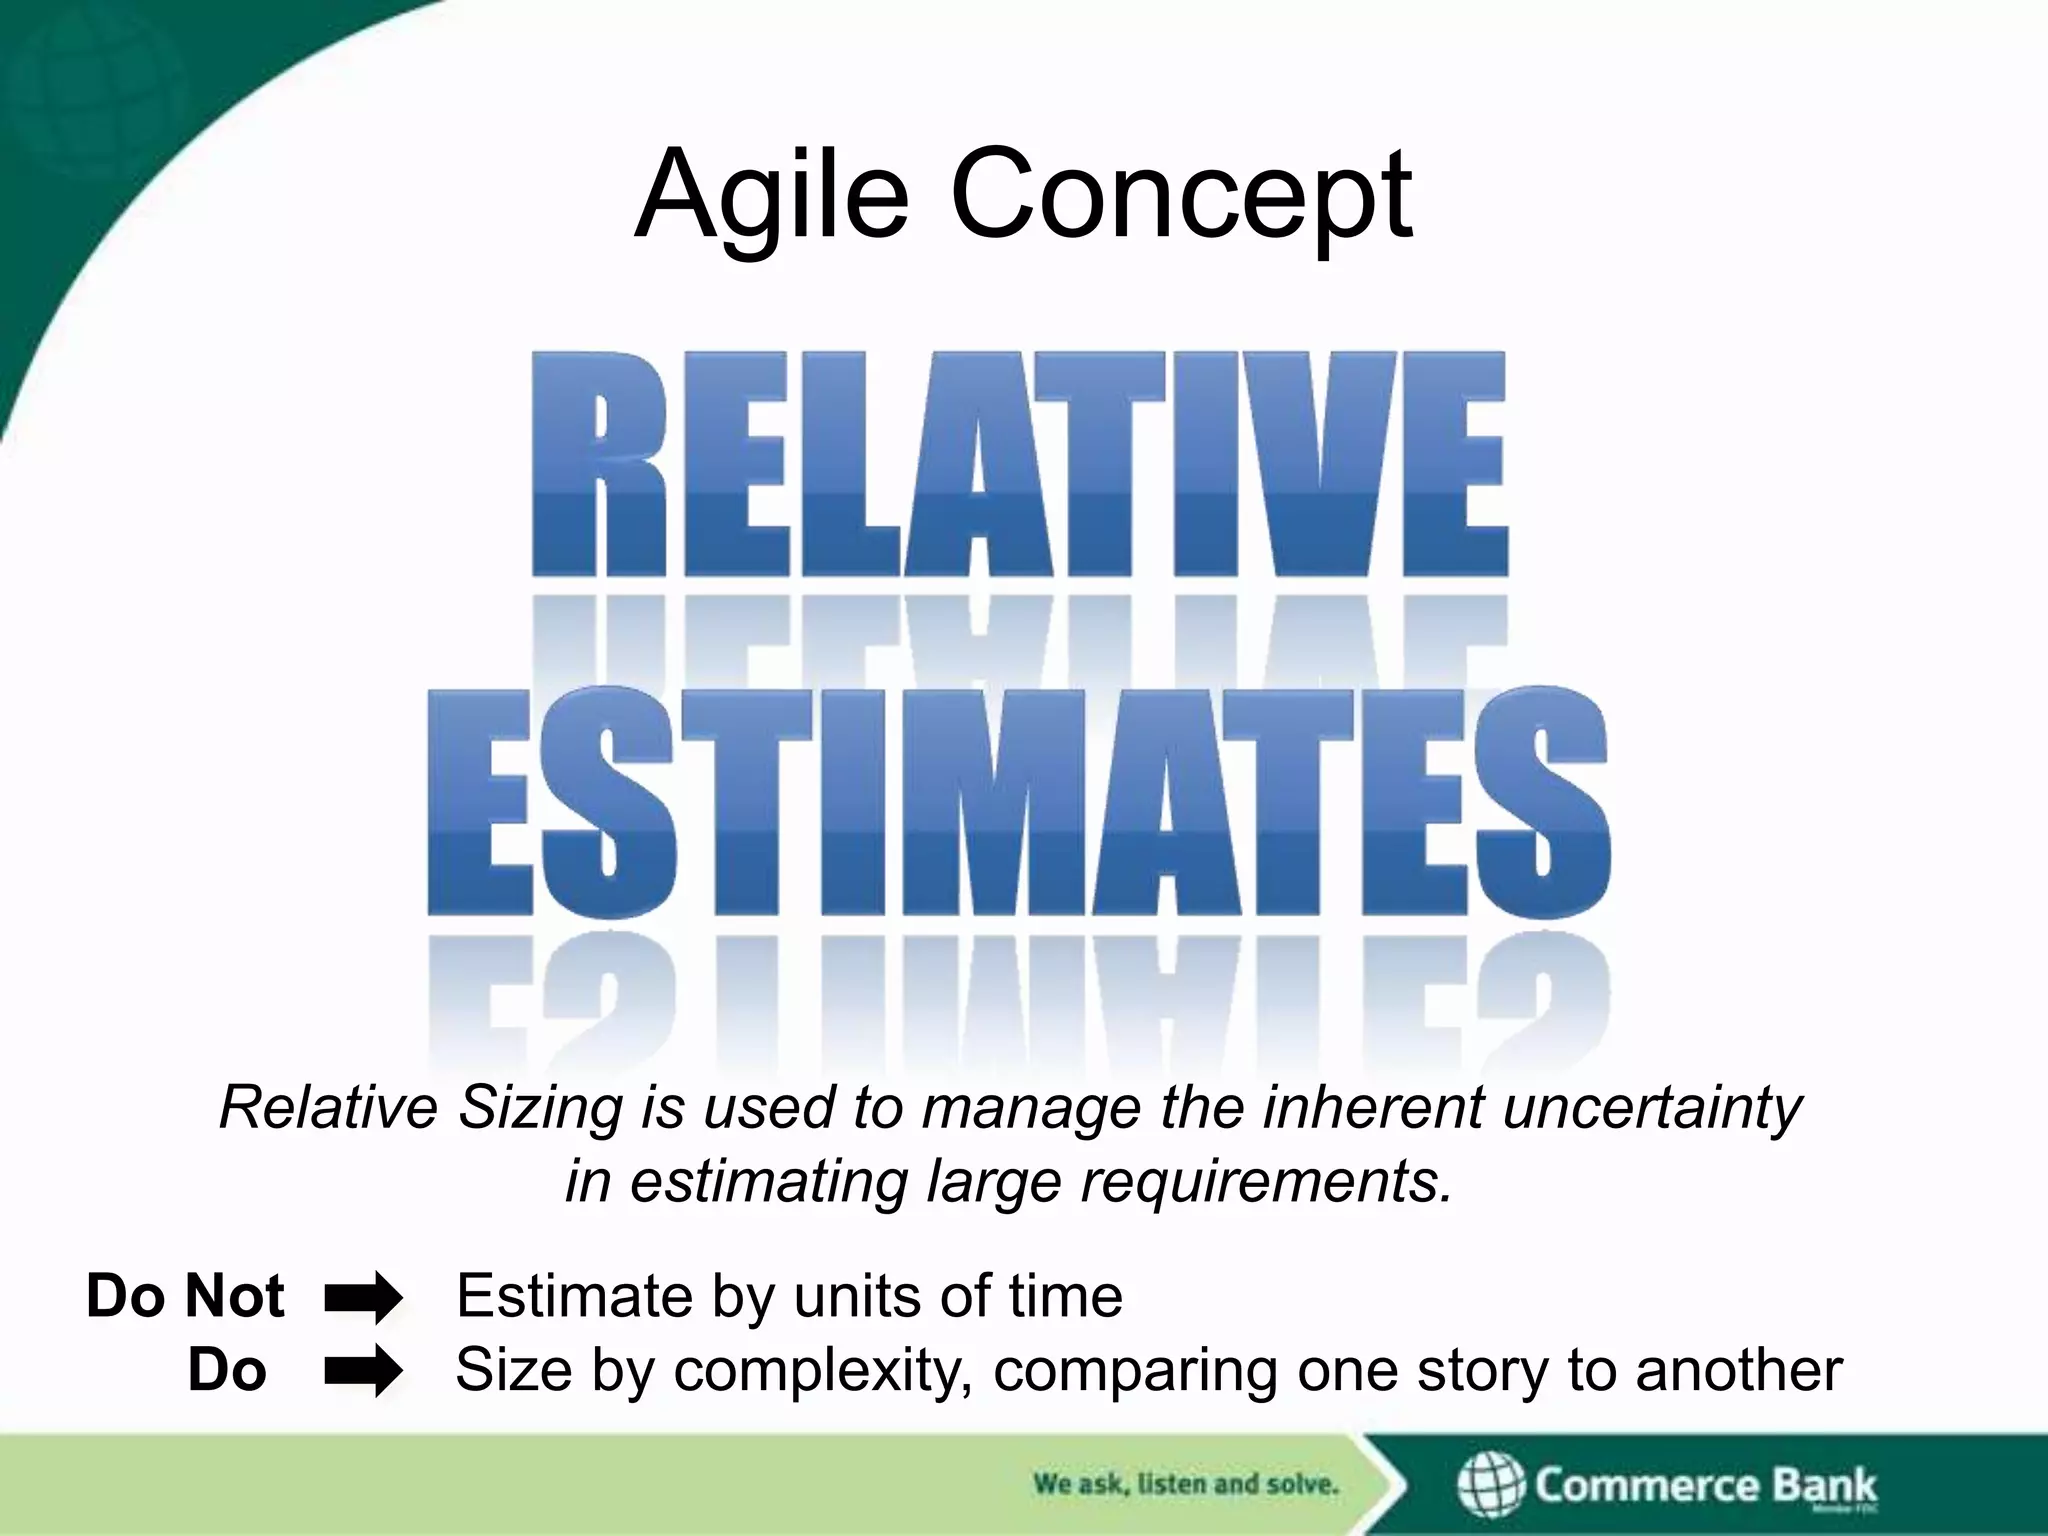
Agile Concept
Relative Sizingis used to manage the inherent uncertainty
in estimating large requirements.
Do Not
Do
Estimate by units of time
Size by complexity, comparing one story to another
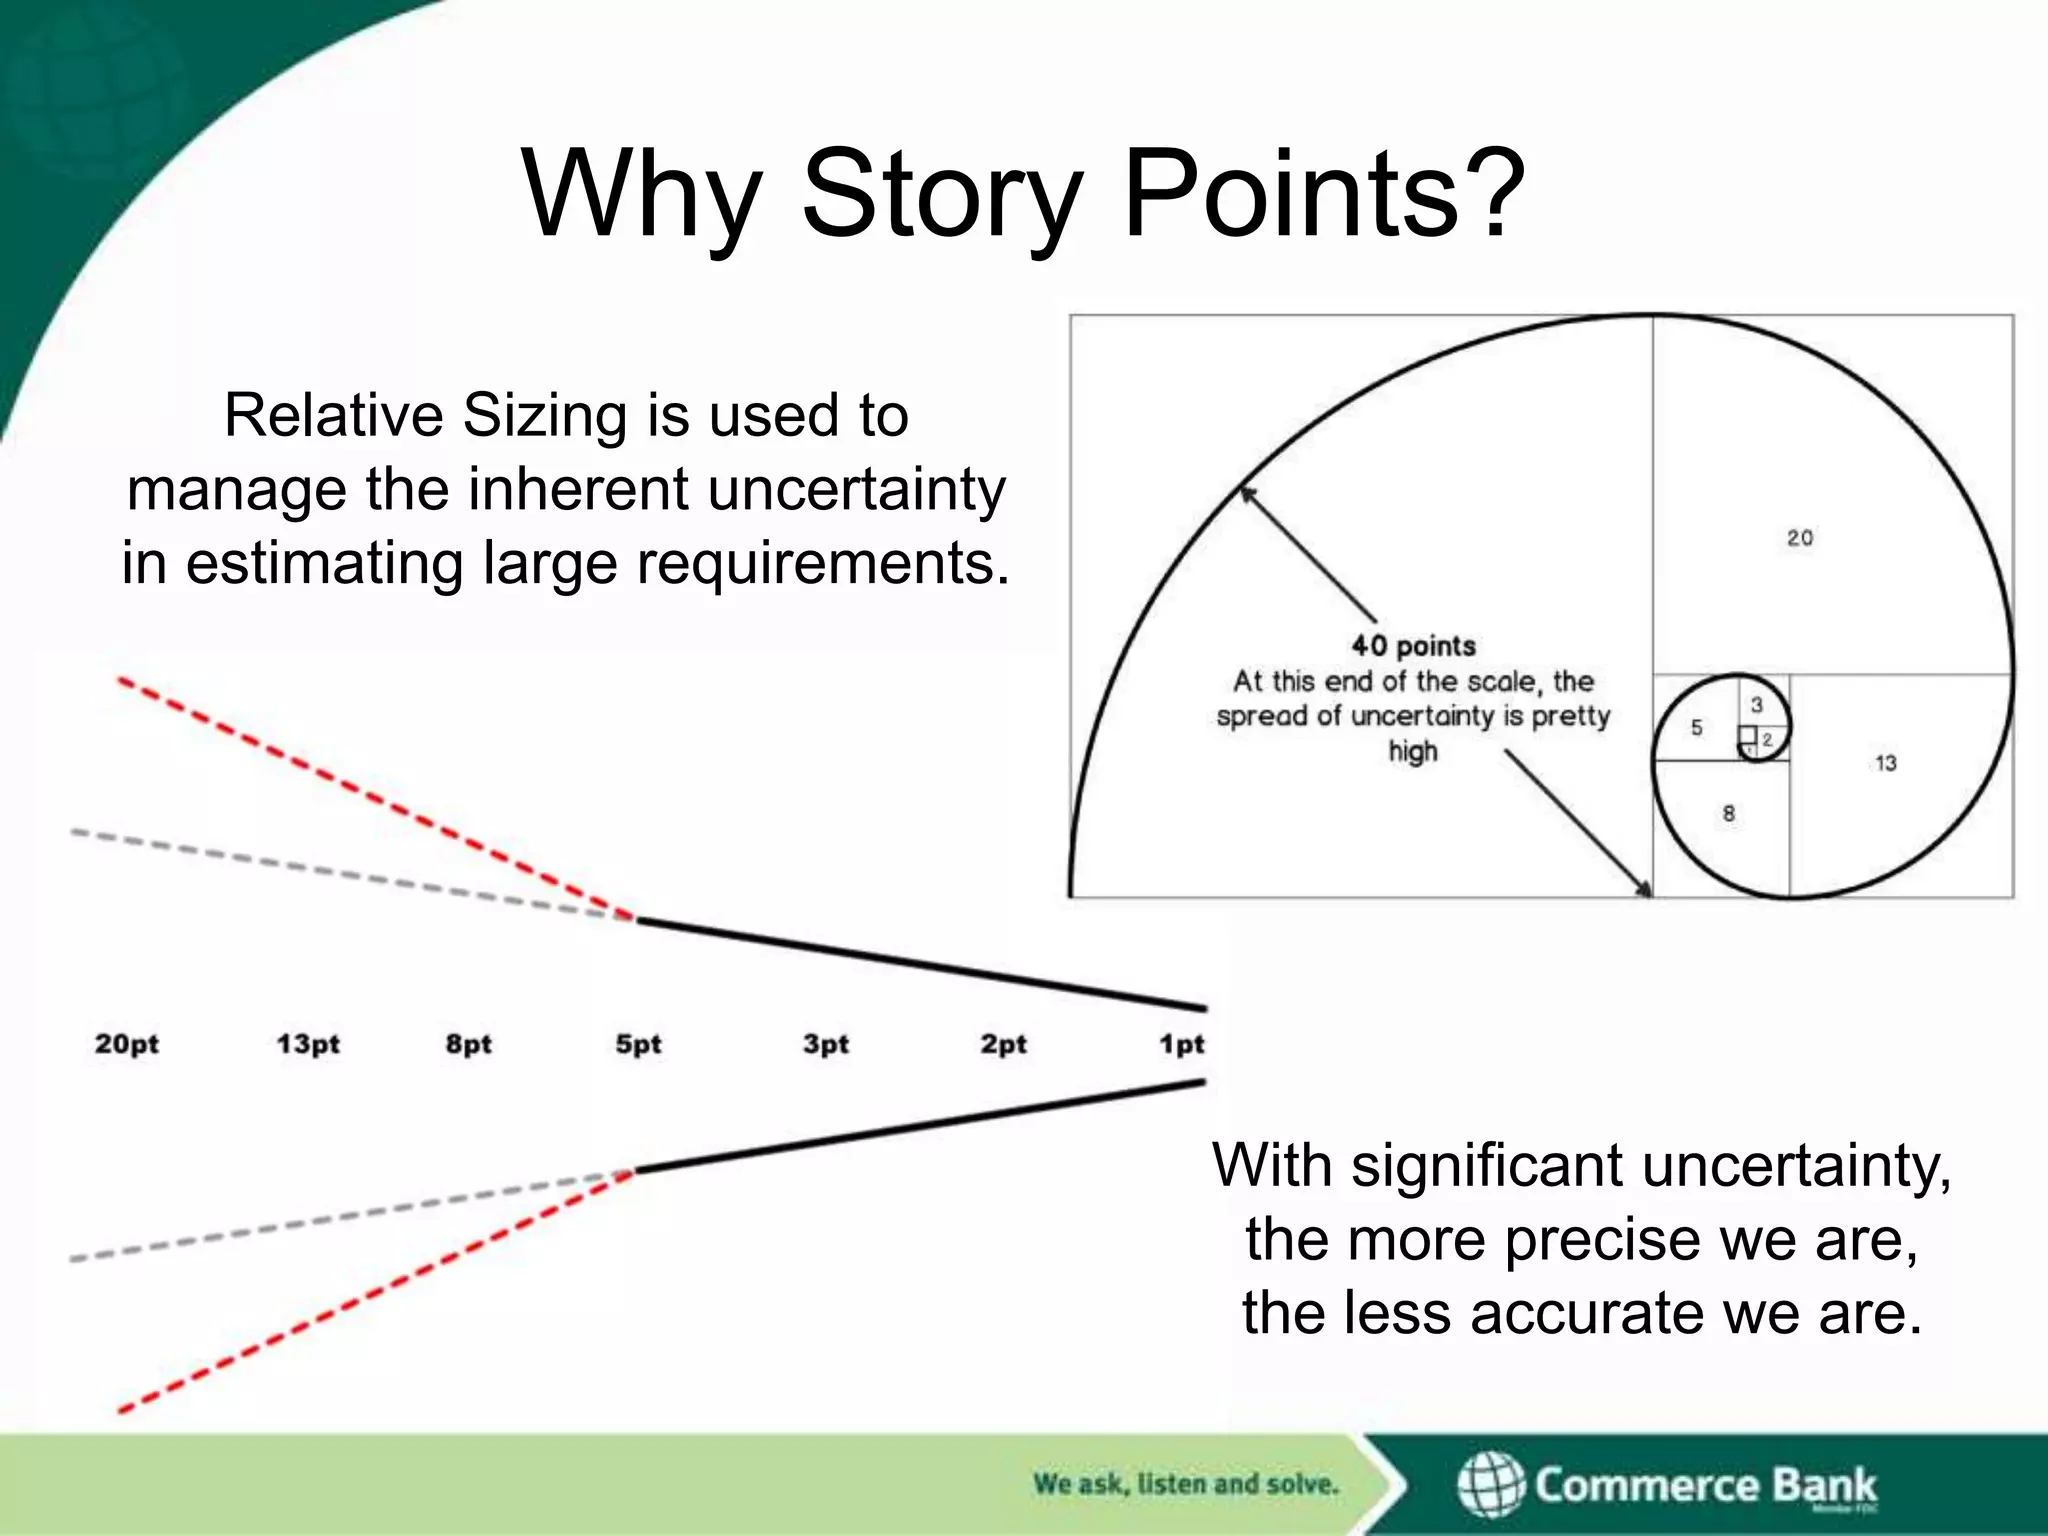
Why Story Points?
RelativeSizing is used to
manage the inherent uncertainty
in estimating large requirements.
With significant uncertainty,
the more precise we are,
the less accurate we are.
12.
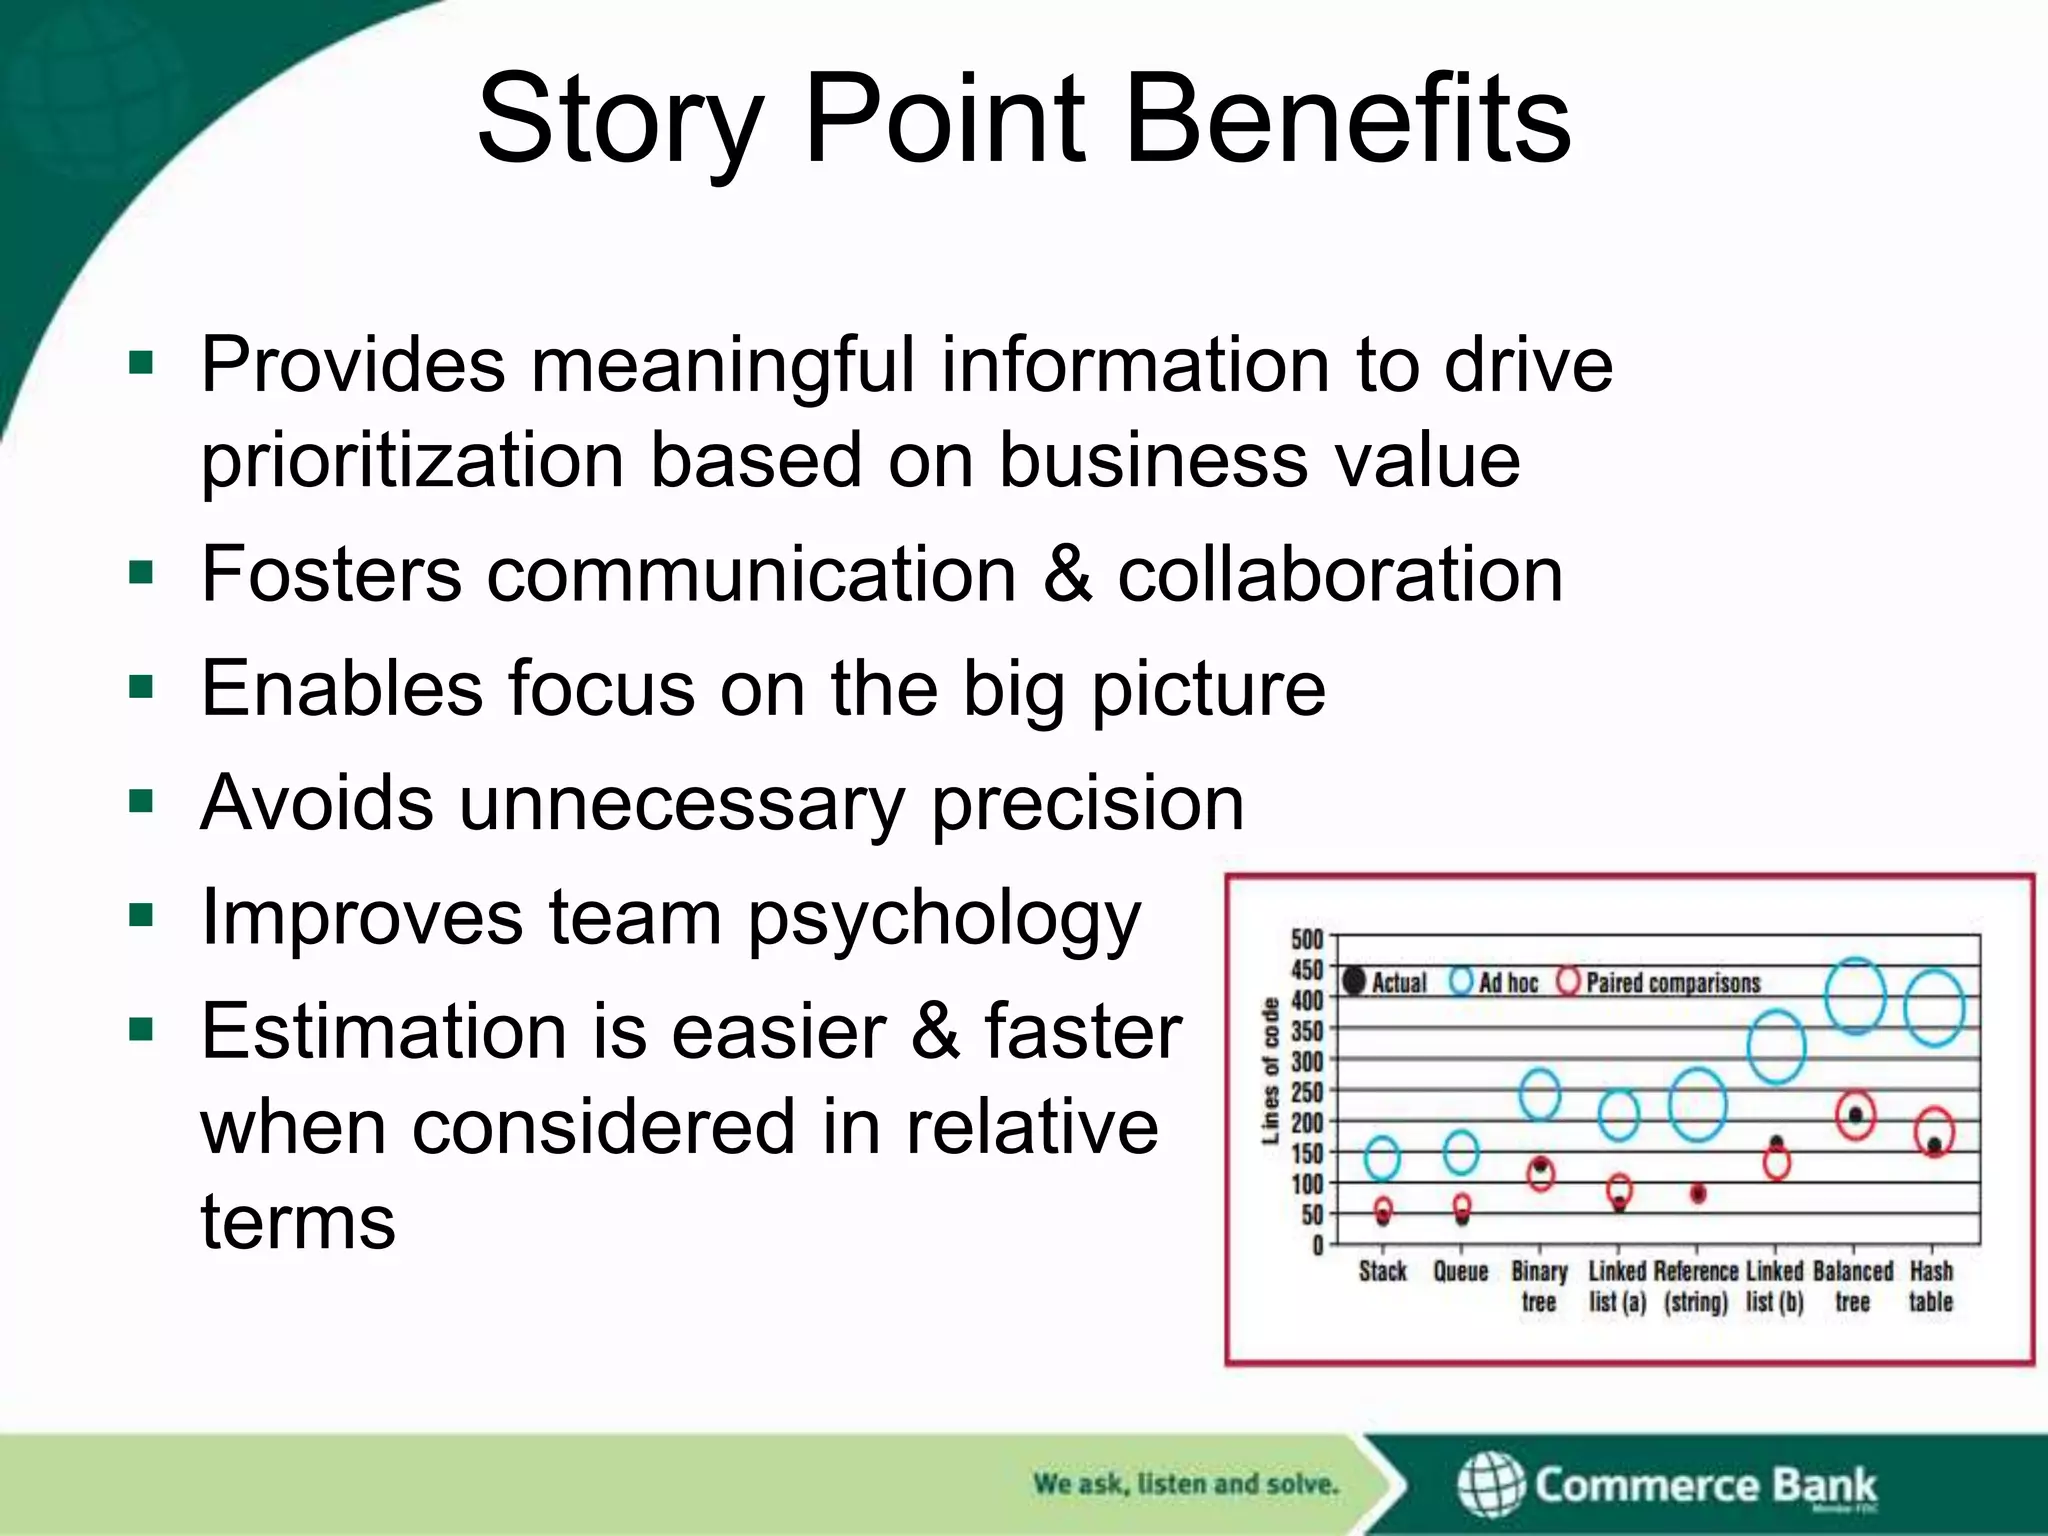
Story Point Benefits
Provides meaningful information to drive
prioritization based on business value
Fosters communication & collaboration
Enables focus on the big picture
Avoids unnecessary precision
Improves team psychology
Estimation is easier & faster
when considered in relative
terms
13.
Agile Concept
The averagenumber of story points a team gets done in a Sprint.
“Agile processes promote
sustainable development. The
sponsors, developers, and users
should be able to maintain a
constant pace indefinitely.”
14.
Understanding Velocity
Predictability
What can be done by a specific date
When something can be completed
How much business value (work) a team can
deliver over time
Accuracy
Developing a consistent velocity allows for
more accurate release and sprint planning
15.
Forecasting the ReleaseDate & Cost
Inputs
Team member allocation (from capacity planning)
Team Velocity (4 – 6 sprints)
Apply Standard Deviation
Forecast Formulas
Outputs
Project Cost Estimate
Project Schedule Forecast
16.
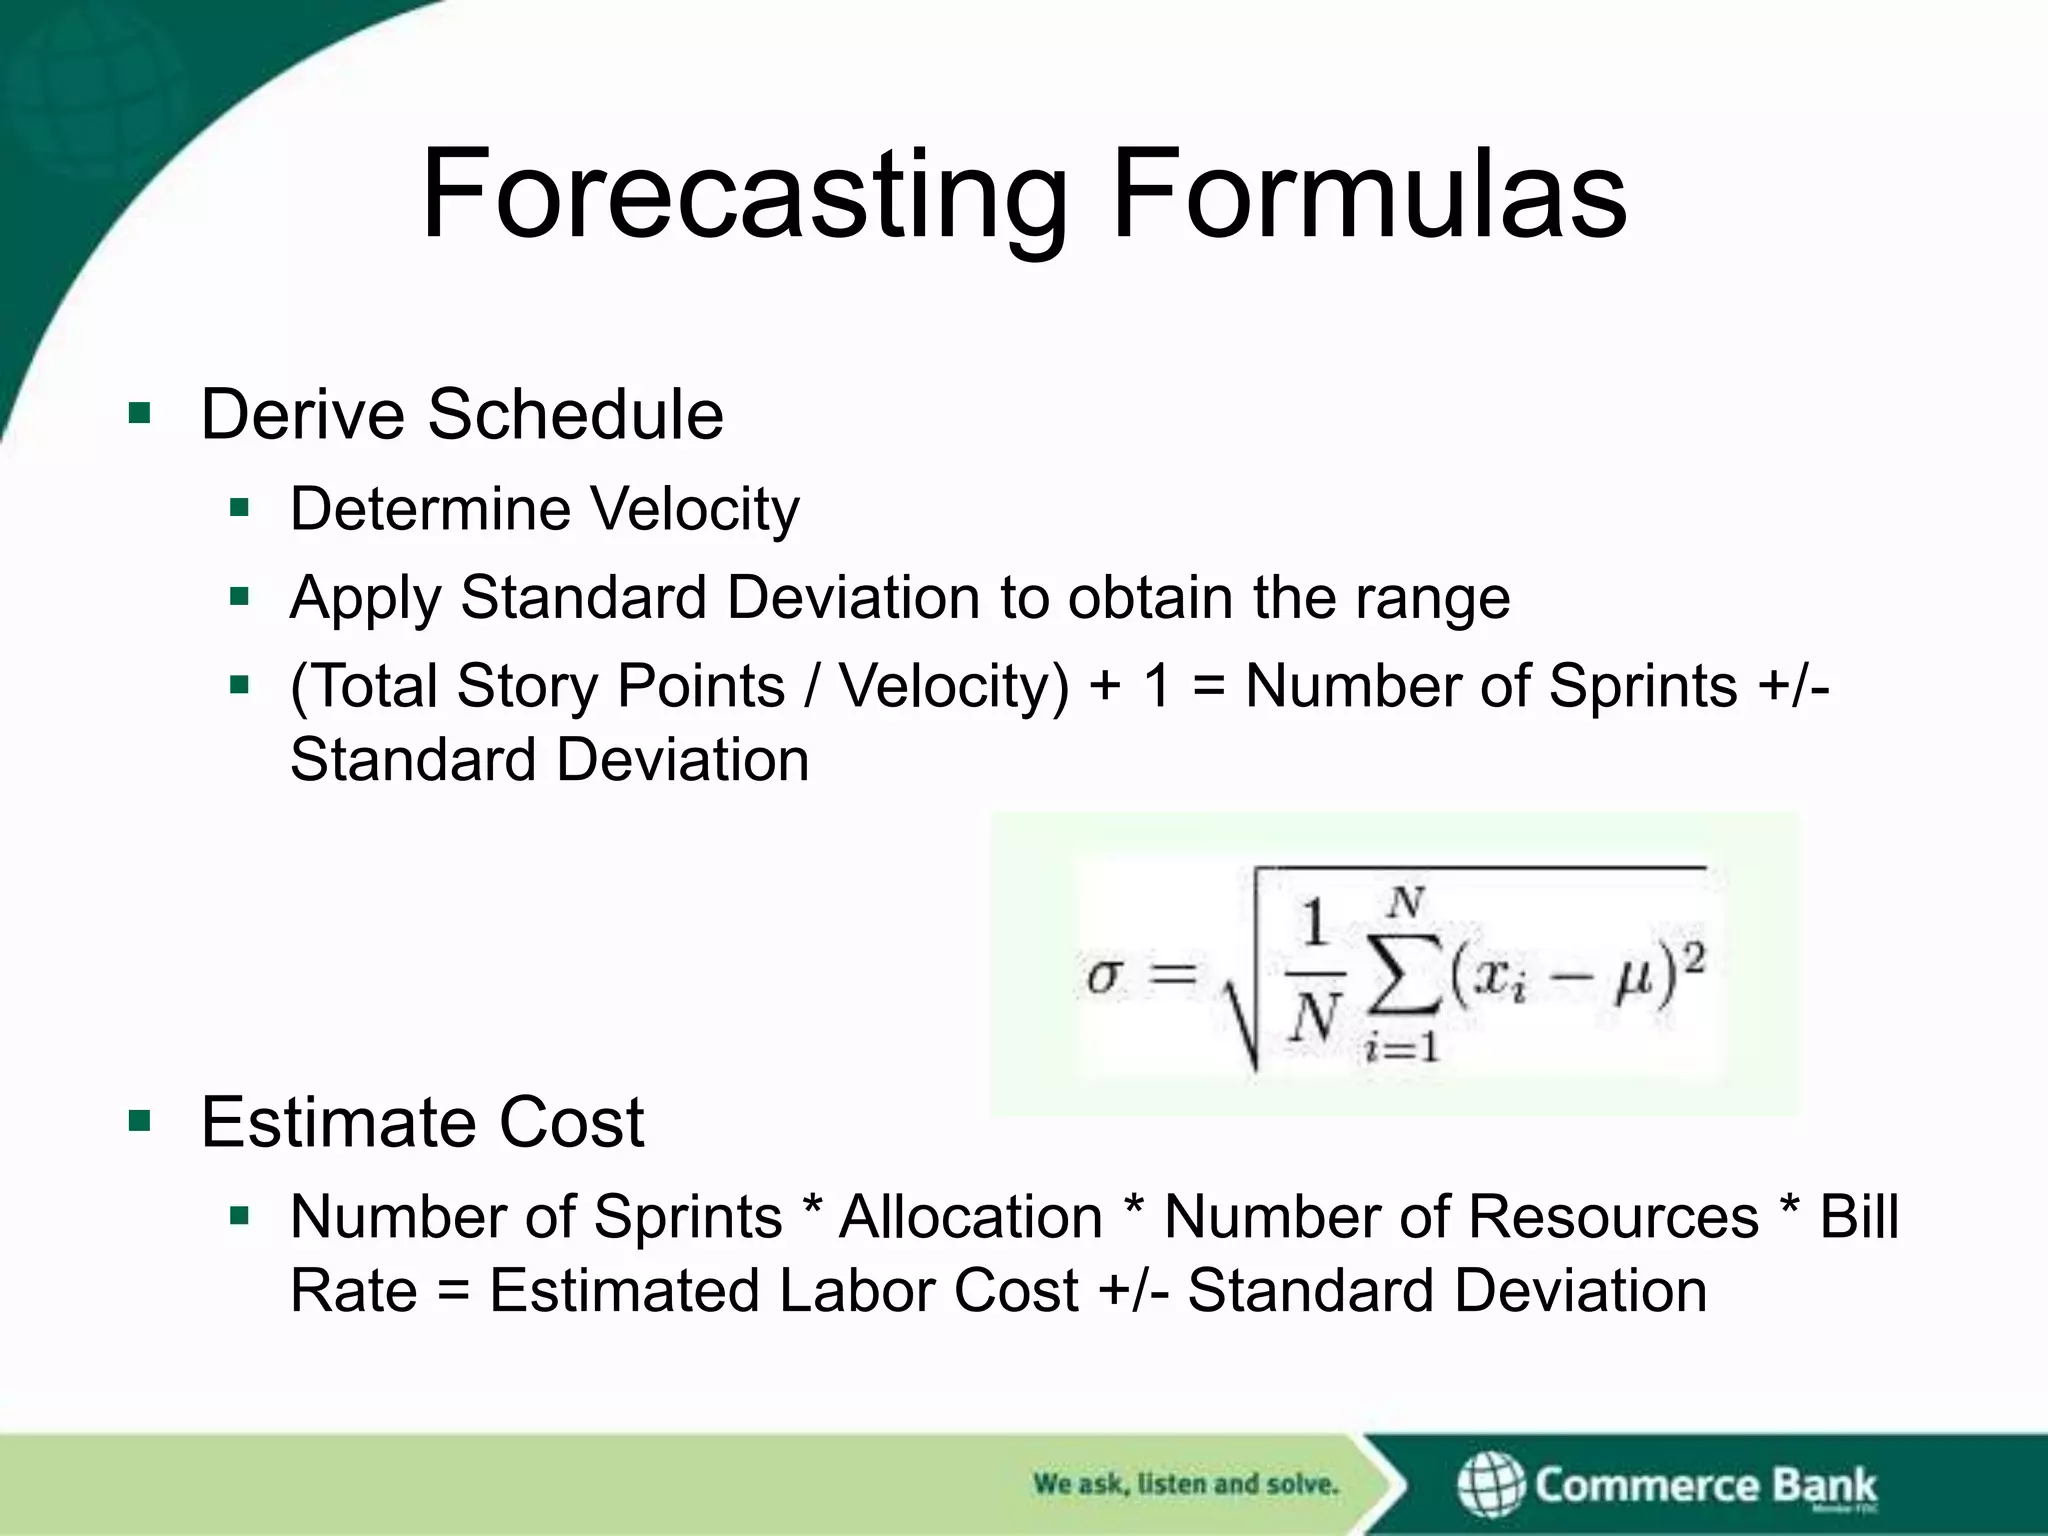
Forecasting Formulas
DeriveSchedule
Determine Velocity
Apply Standard Deviation to obtain the range
(Total Story Points / Velocity) + 1 = Number of Sprints +/Standard Deviation
Estimate Cost
Number of Sprints * Allocation * Number of Resources * Bill
Rate = Estimated Labor Cost +/- Standard Deviation
17.
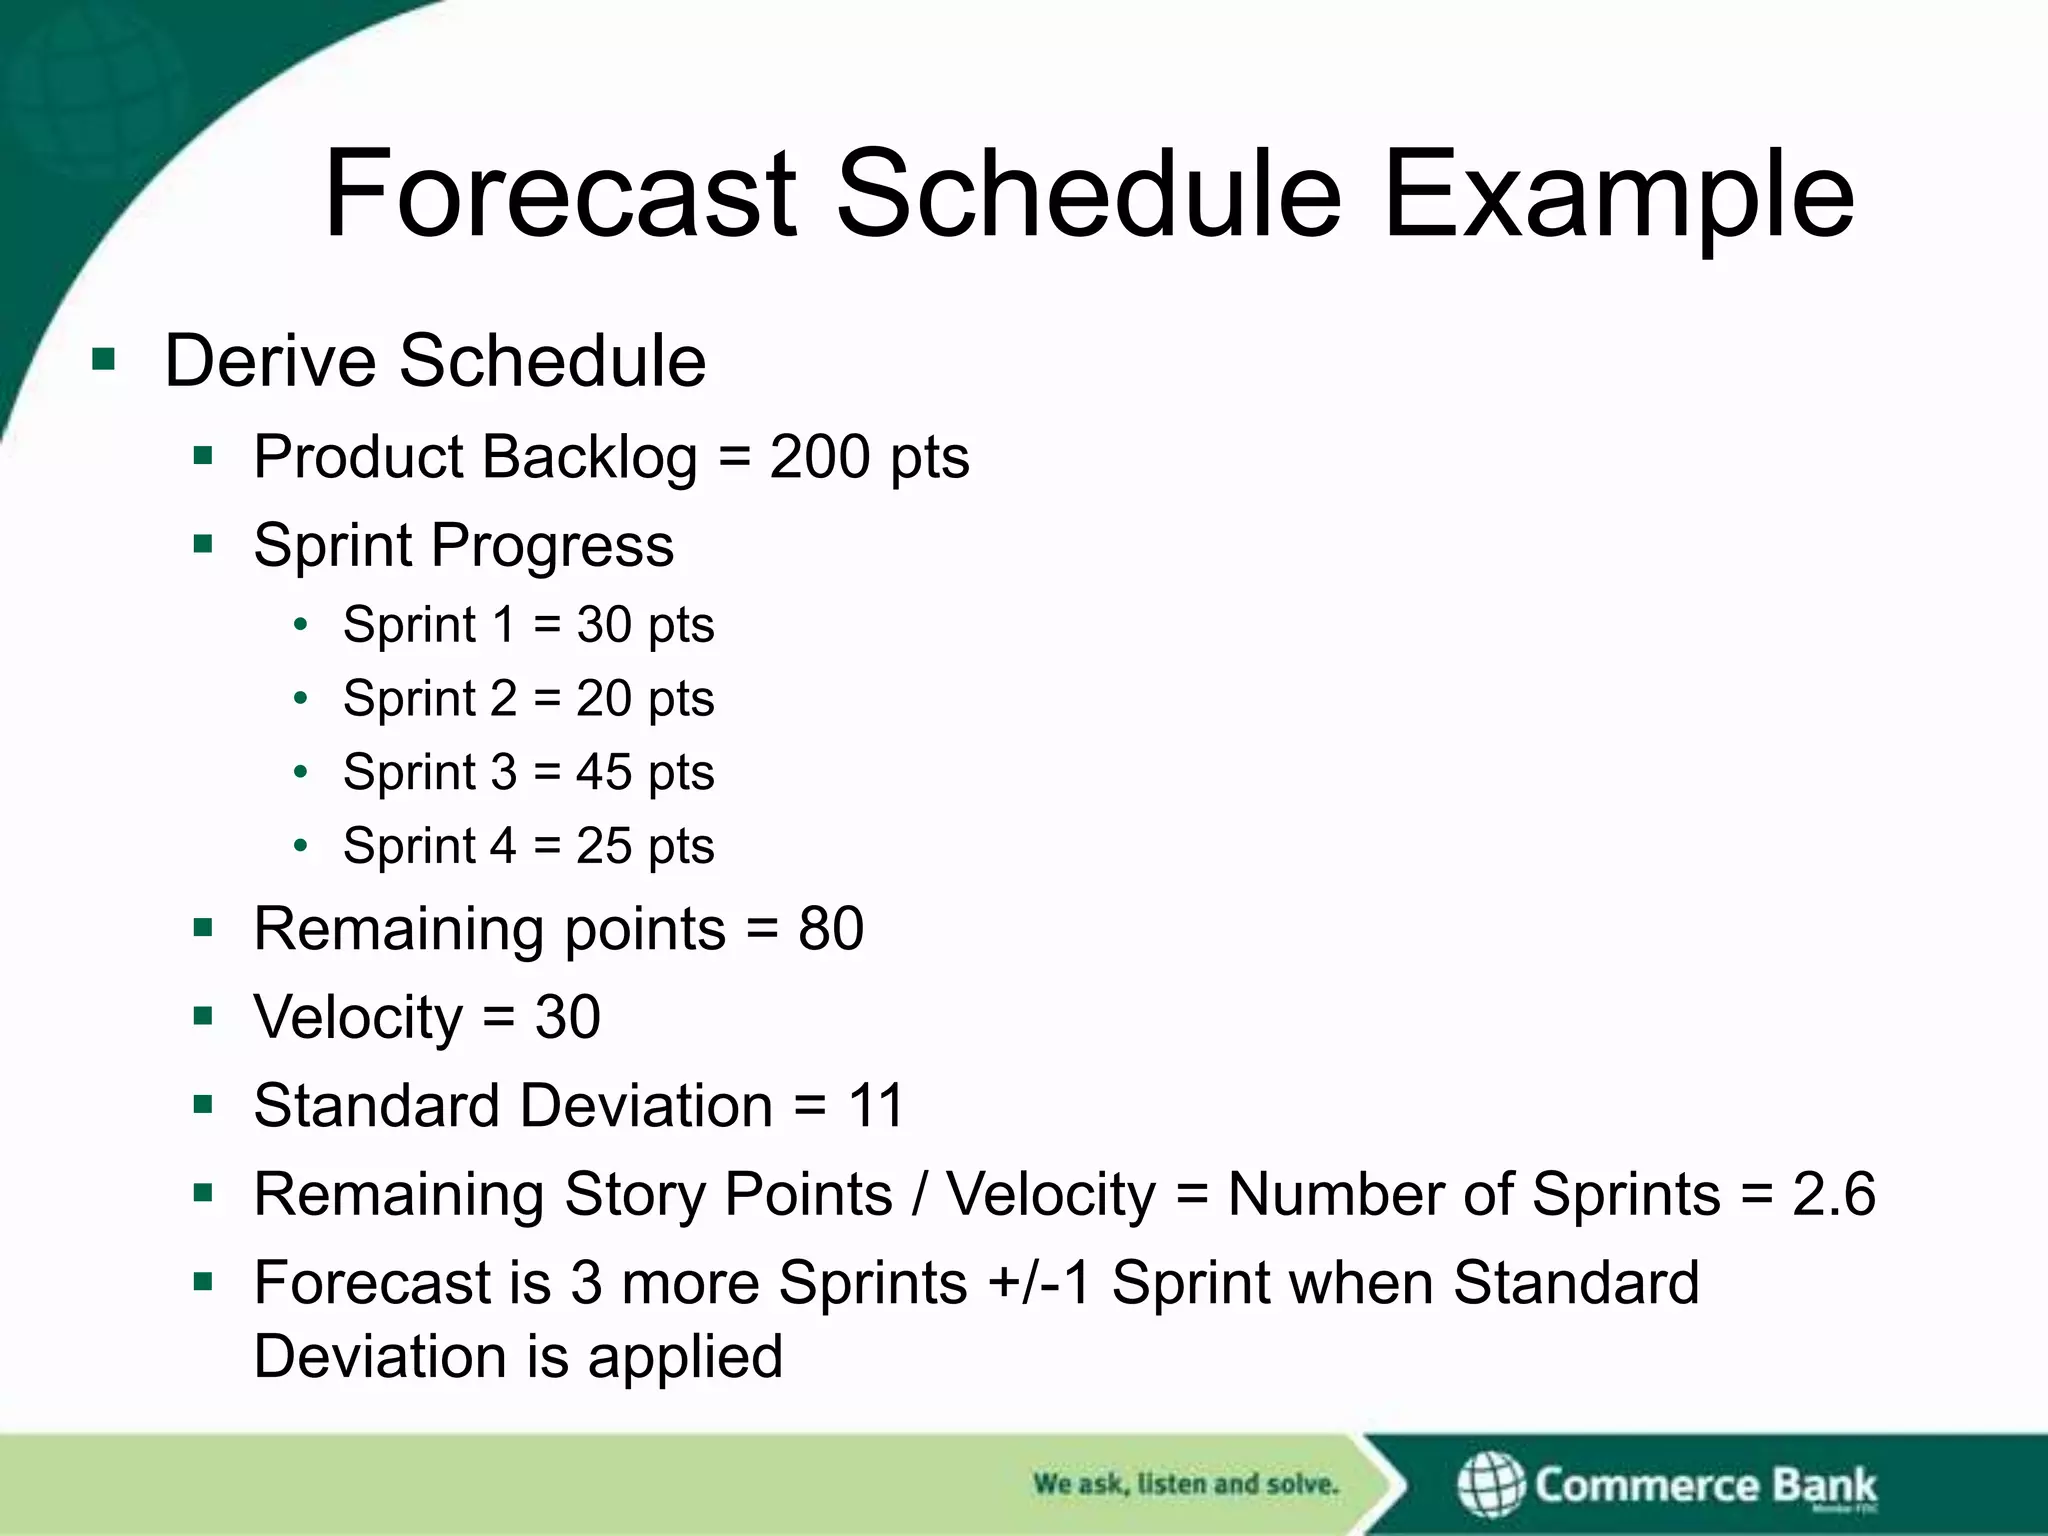
Forecast Schedule Example
Derive Schedule
Product Backlog = 200 pts
Sprint Progress
•
•
•
•
Sprint 1 = 30 pts
Sprint 2 = 20 pts
Sprint 3 = 45 pts
Sprint 4 = 25 pts
Remaining points = 80
Velocity = 30
Standard Deviation = 11
Remaining Story Points / Velocity = Number of Sprints = 2.6
Forecast is 3 more Sprints +/-1 Sprint when Standard
Deviation is applied
18.
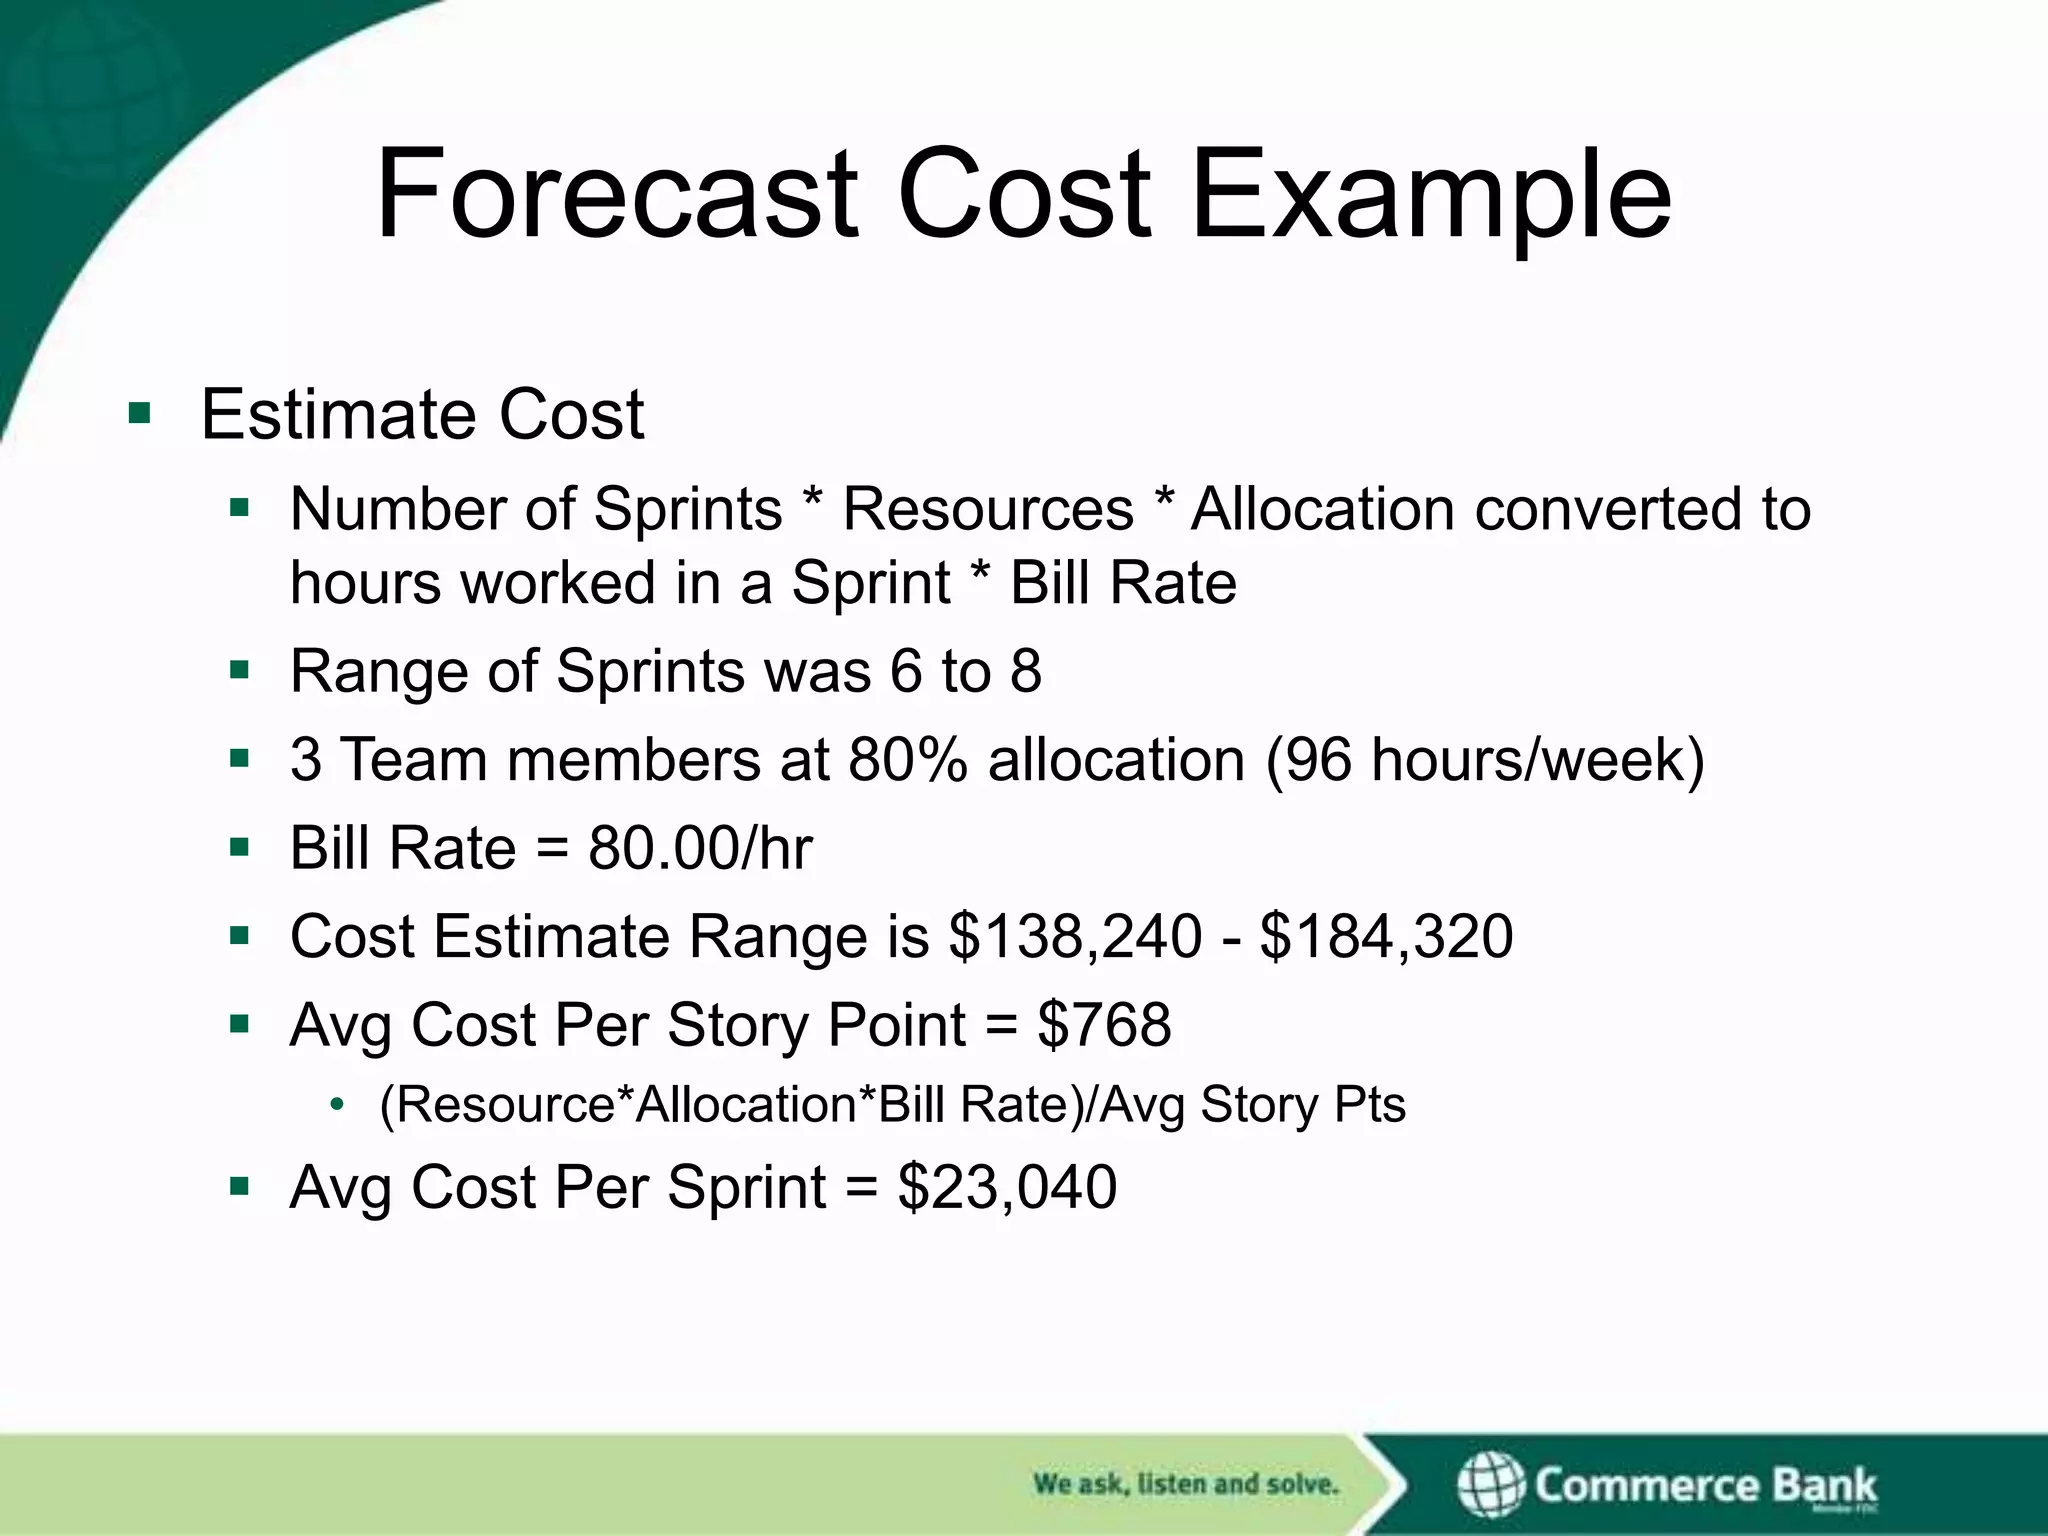
Forecast Cost Example
Estimate Cost
Number of Sprints * Resources * Allocation converted to
hours worked in a Sprint * Bill Rate
Range of Sprints was 6 to 8
3 Team members at 80% allocation (96 hours/week)
Bill Rate = 80.00/hr
Cost Estimate Range is $138,240 - $184,320
Avg Cost Per Story Point = $768
• (Resource*Allocation*Bill Rate)/Avg Story Pts
Avg Cost Per Sprint = $23,040
Publish Your ReleaseForecast
After all user stories are Sized, and team
Velocity is measured, then the Duration
can be derived, and Cost calculated
The forecast is then published as a
project Release Date and Labor Expense
size is estimated, velocity is measured, duration is derived, cost is calculated
21.
Agile Concept
Regularly revisitestimates and forecast
“At regular intervals, the team
reflects on how to become
more effective, then tunes and
adjusts its behavior
accordingly.”
22.
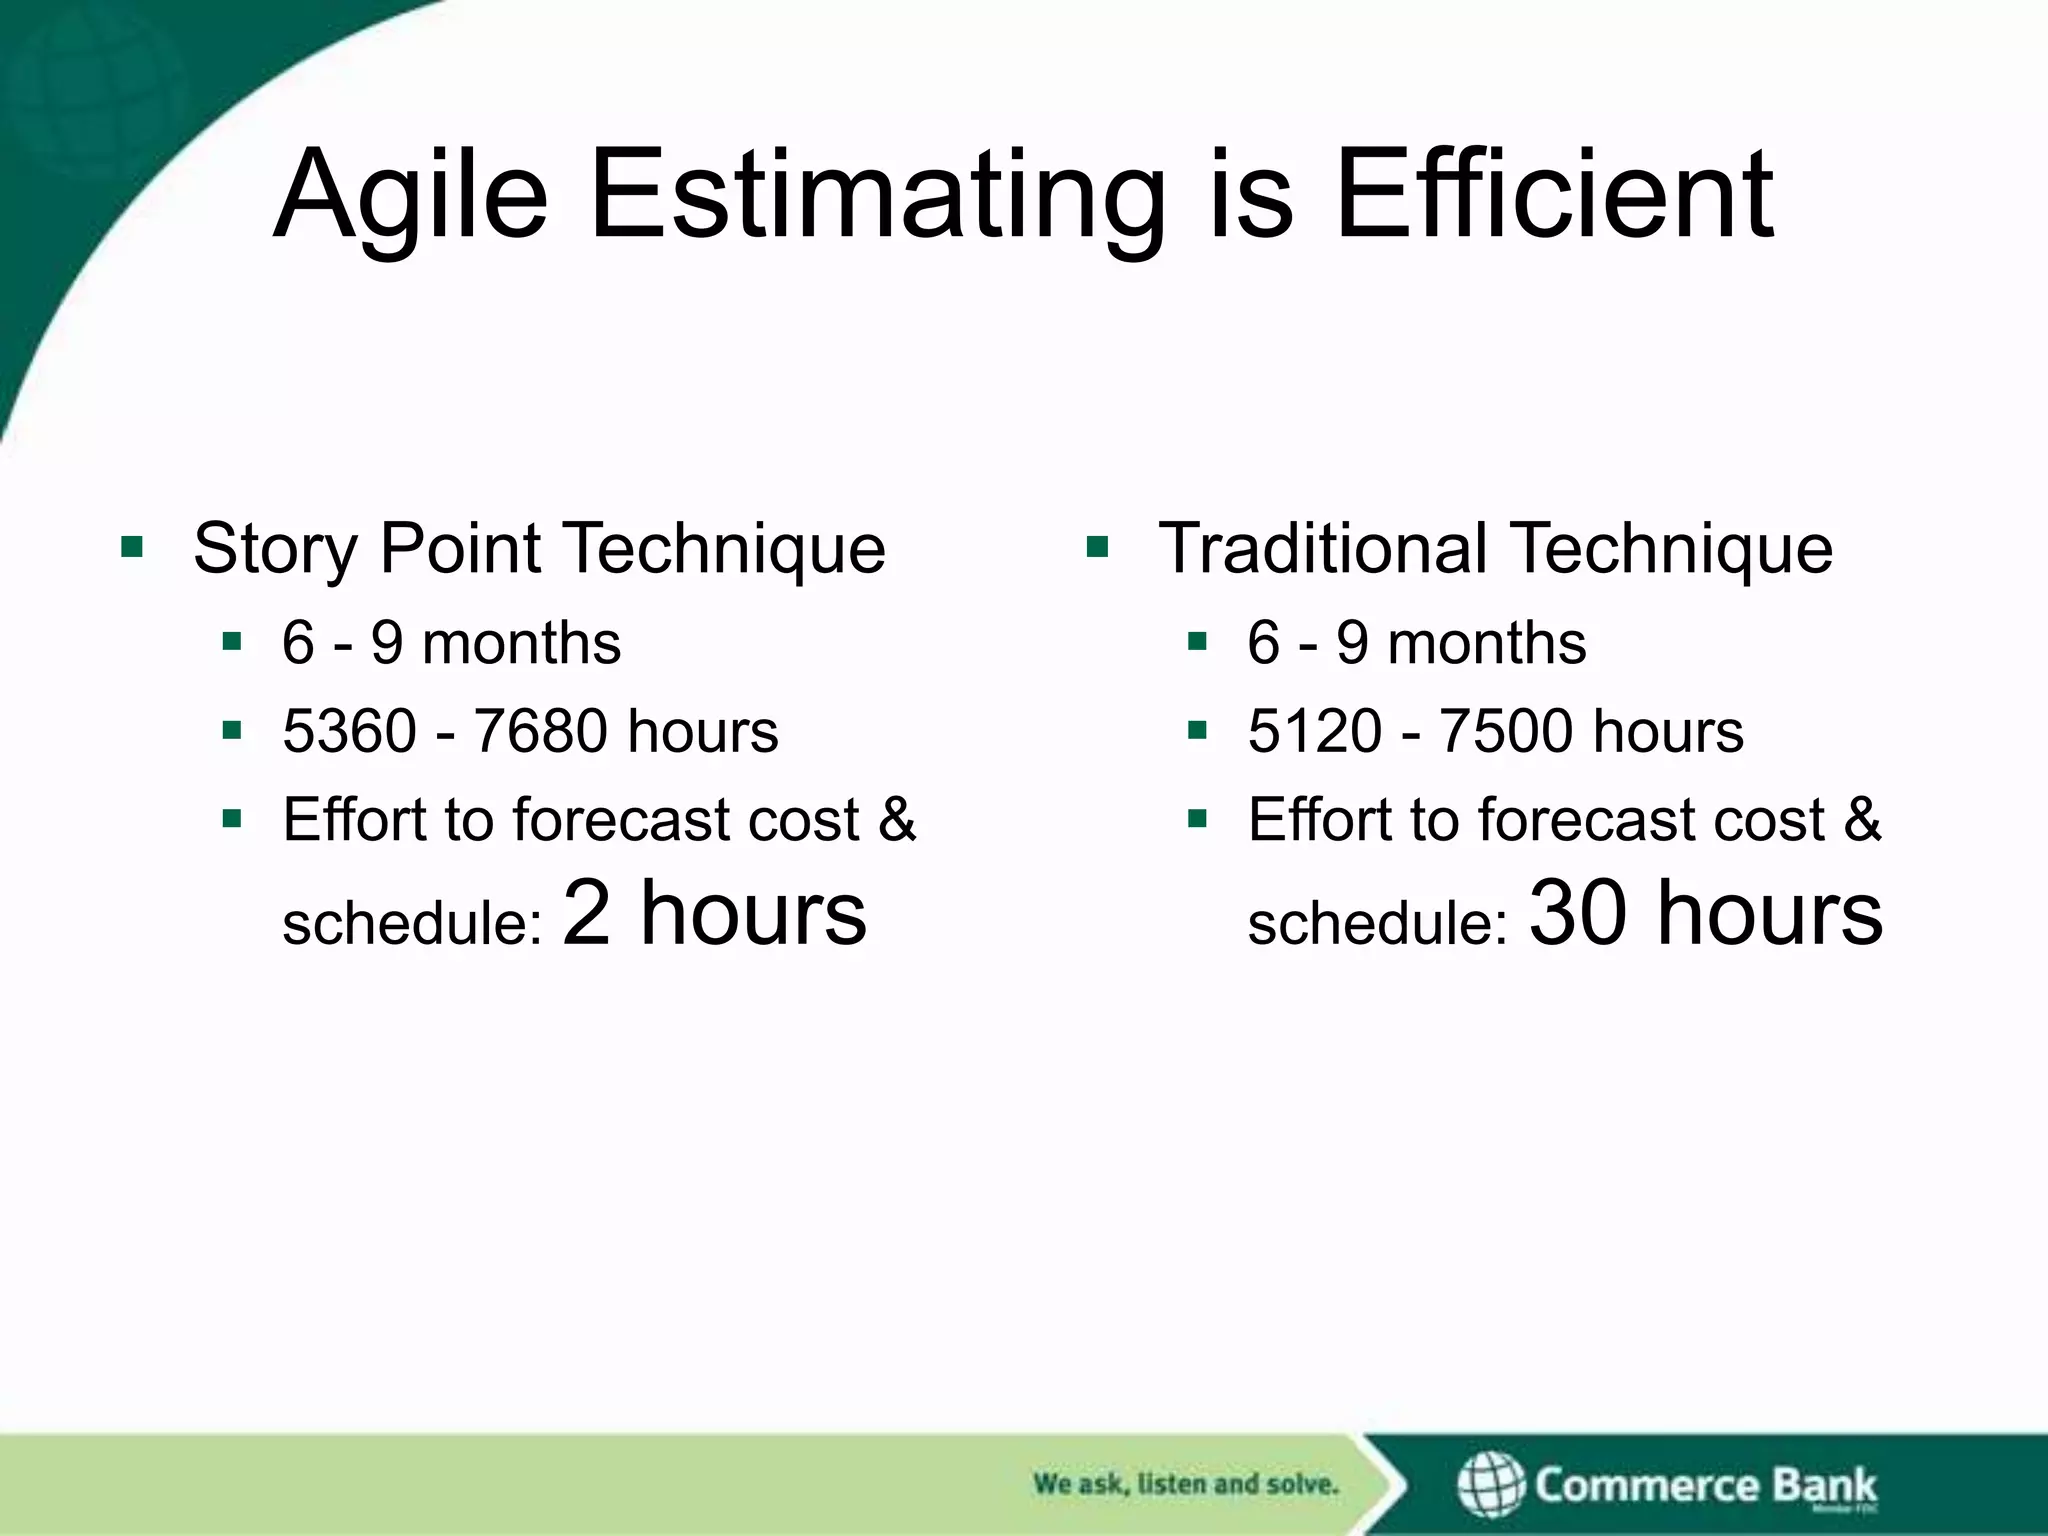
Agile Estimating isEfficient
Story Point Technique
6 - 9 months
5360 - 7680 hours
Effort to forecast cost &
schedule: 2
hours
Traditional Technique
6 - 9 months
5120 - 7500 hours
Effort to forecast cost &
schedule: 30
hours
23.
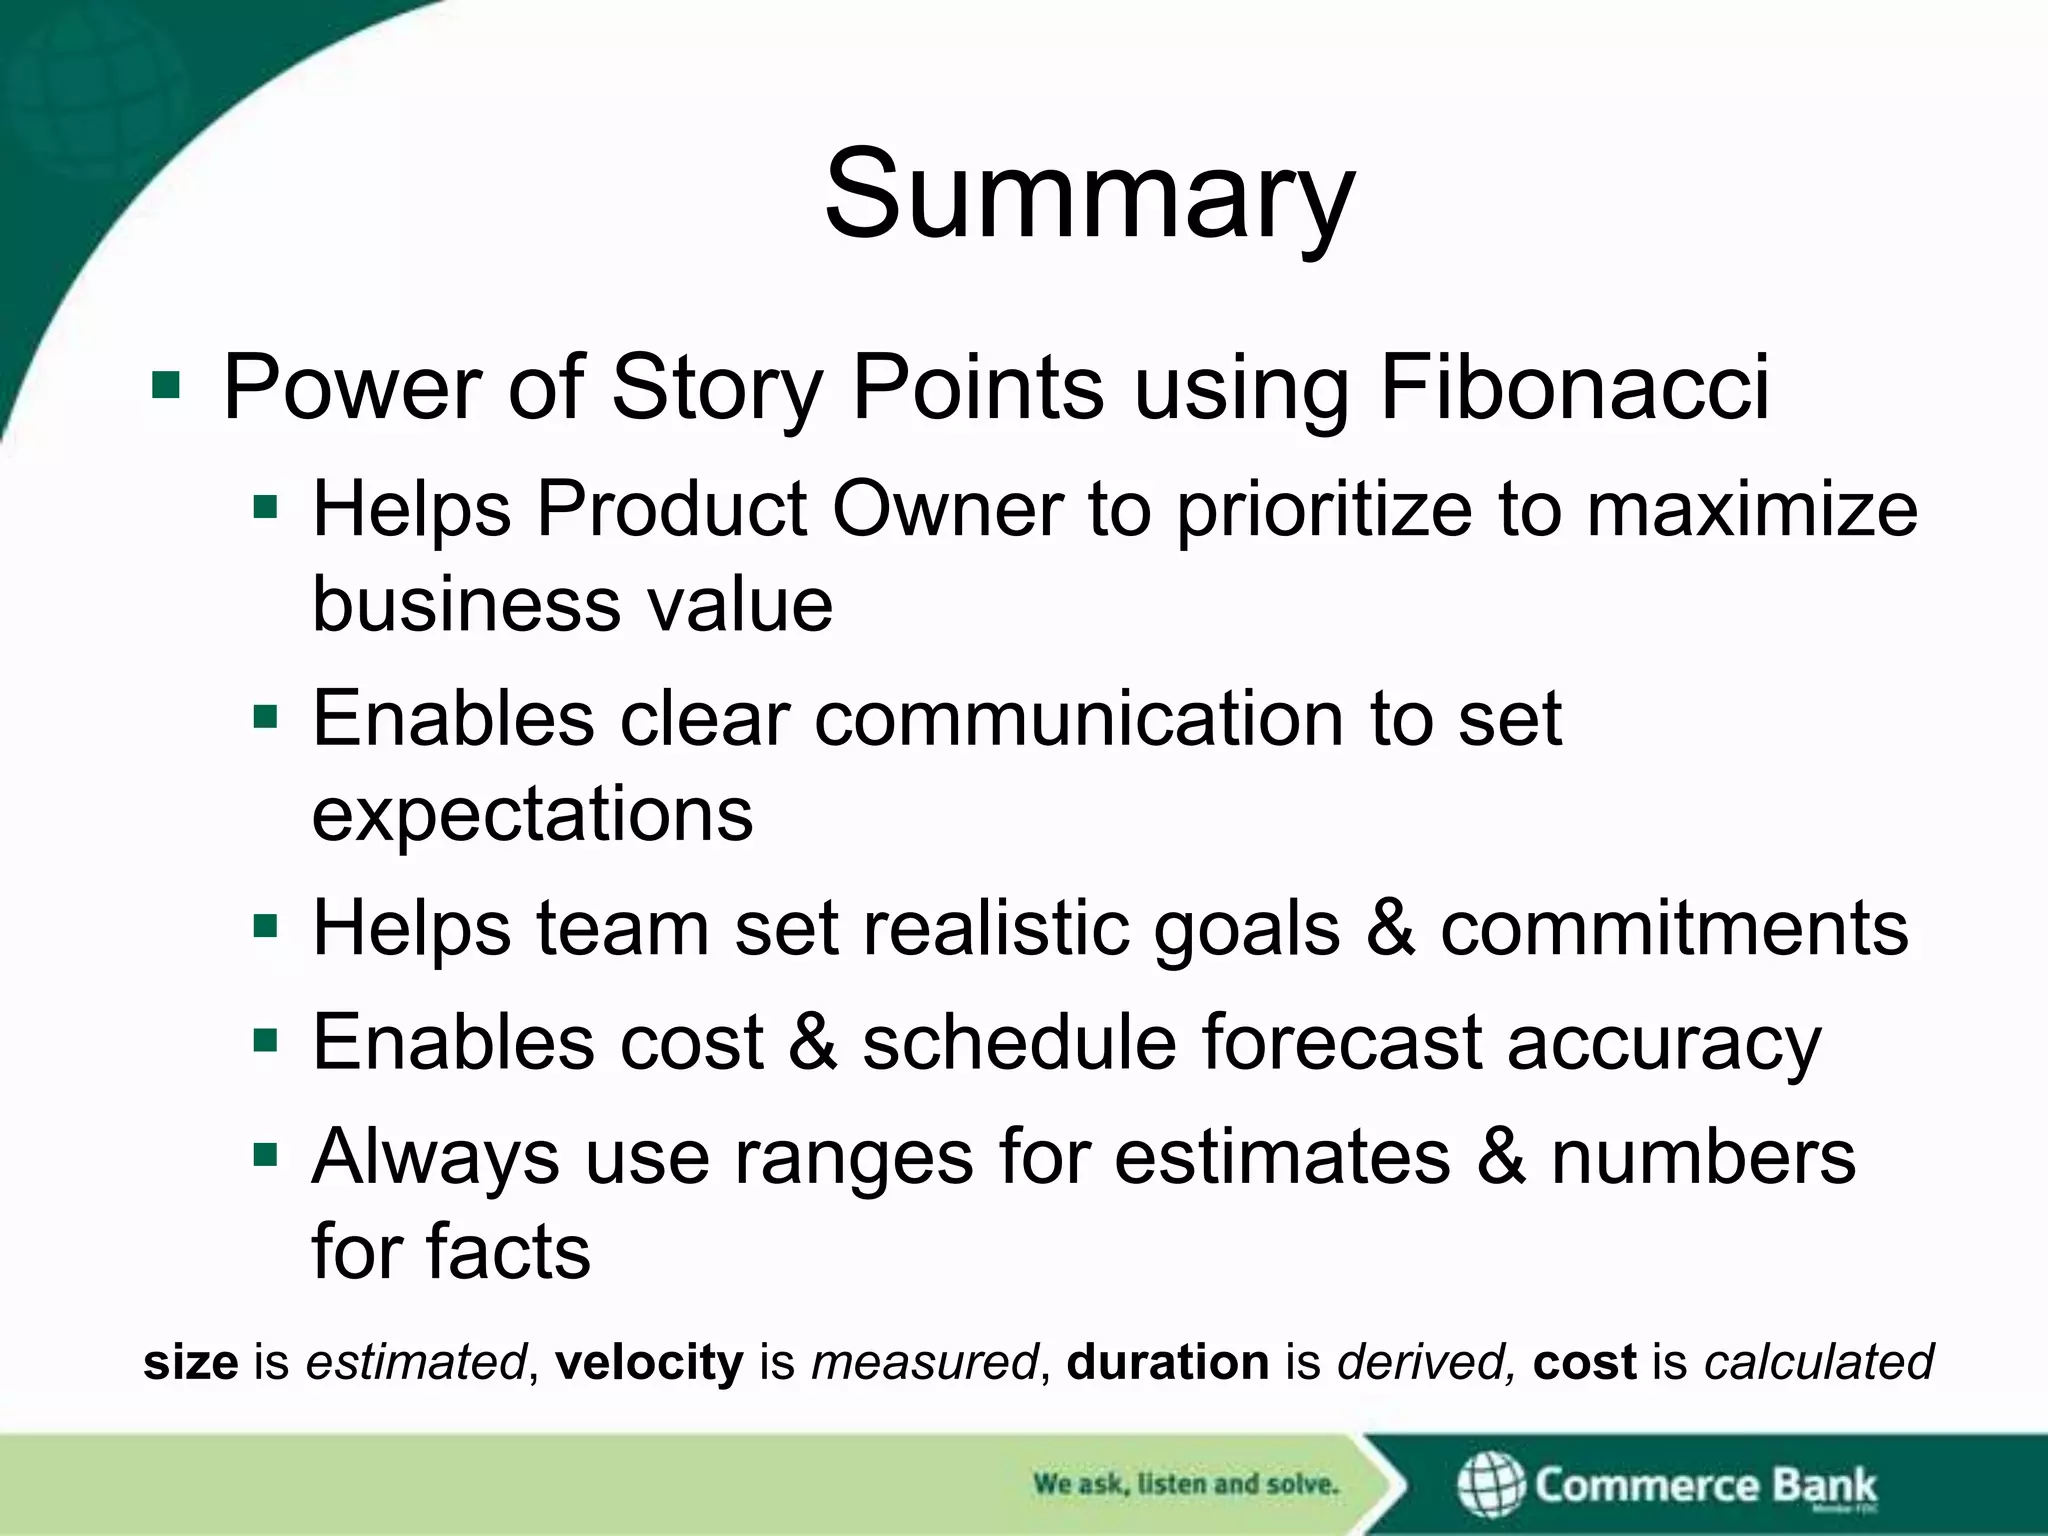
Summary
Power ofStory Points using Fibonacci
Helps Product Owner to prioritize to maximize
business value
Enables clear communication to set
expectations
Helps team set realistic goals & commitments
Enables cost & schedule forecast accuracy
Always use ranges for estimates & numbers
for facts
size is estimated, velocity is measured, duration is derived, cost is calculated

![[HCM Scrum Breakfast] Agile estimation - Story points](https://cdn.slidesharecdn.com/ss_thumbnails/storypointsestimations-160827052054-thumbnail.jpg?width=640&height=640&fit=bounds)


![Vibe Coding vs. Spec-Driven Development [Free Meetup]](https://cdn.slidesharecdn.com/ss_thumbnails/vibecodingvsspecdrivendevelopment-251209105622-43f455e7-thumbnail.jpg?width=640&height=640&fit=bounds)


