Download as PDF, PPTX
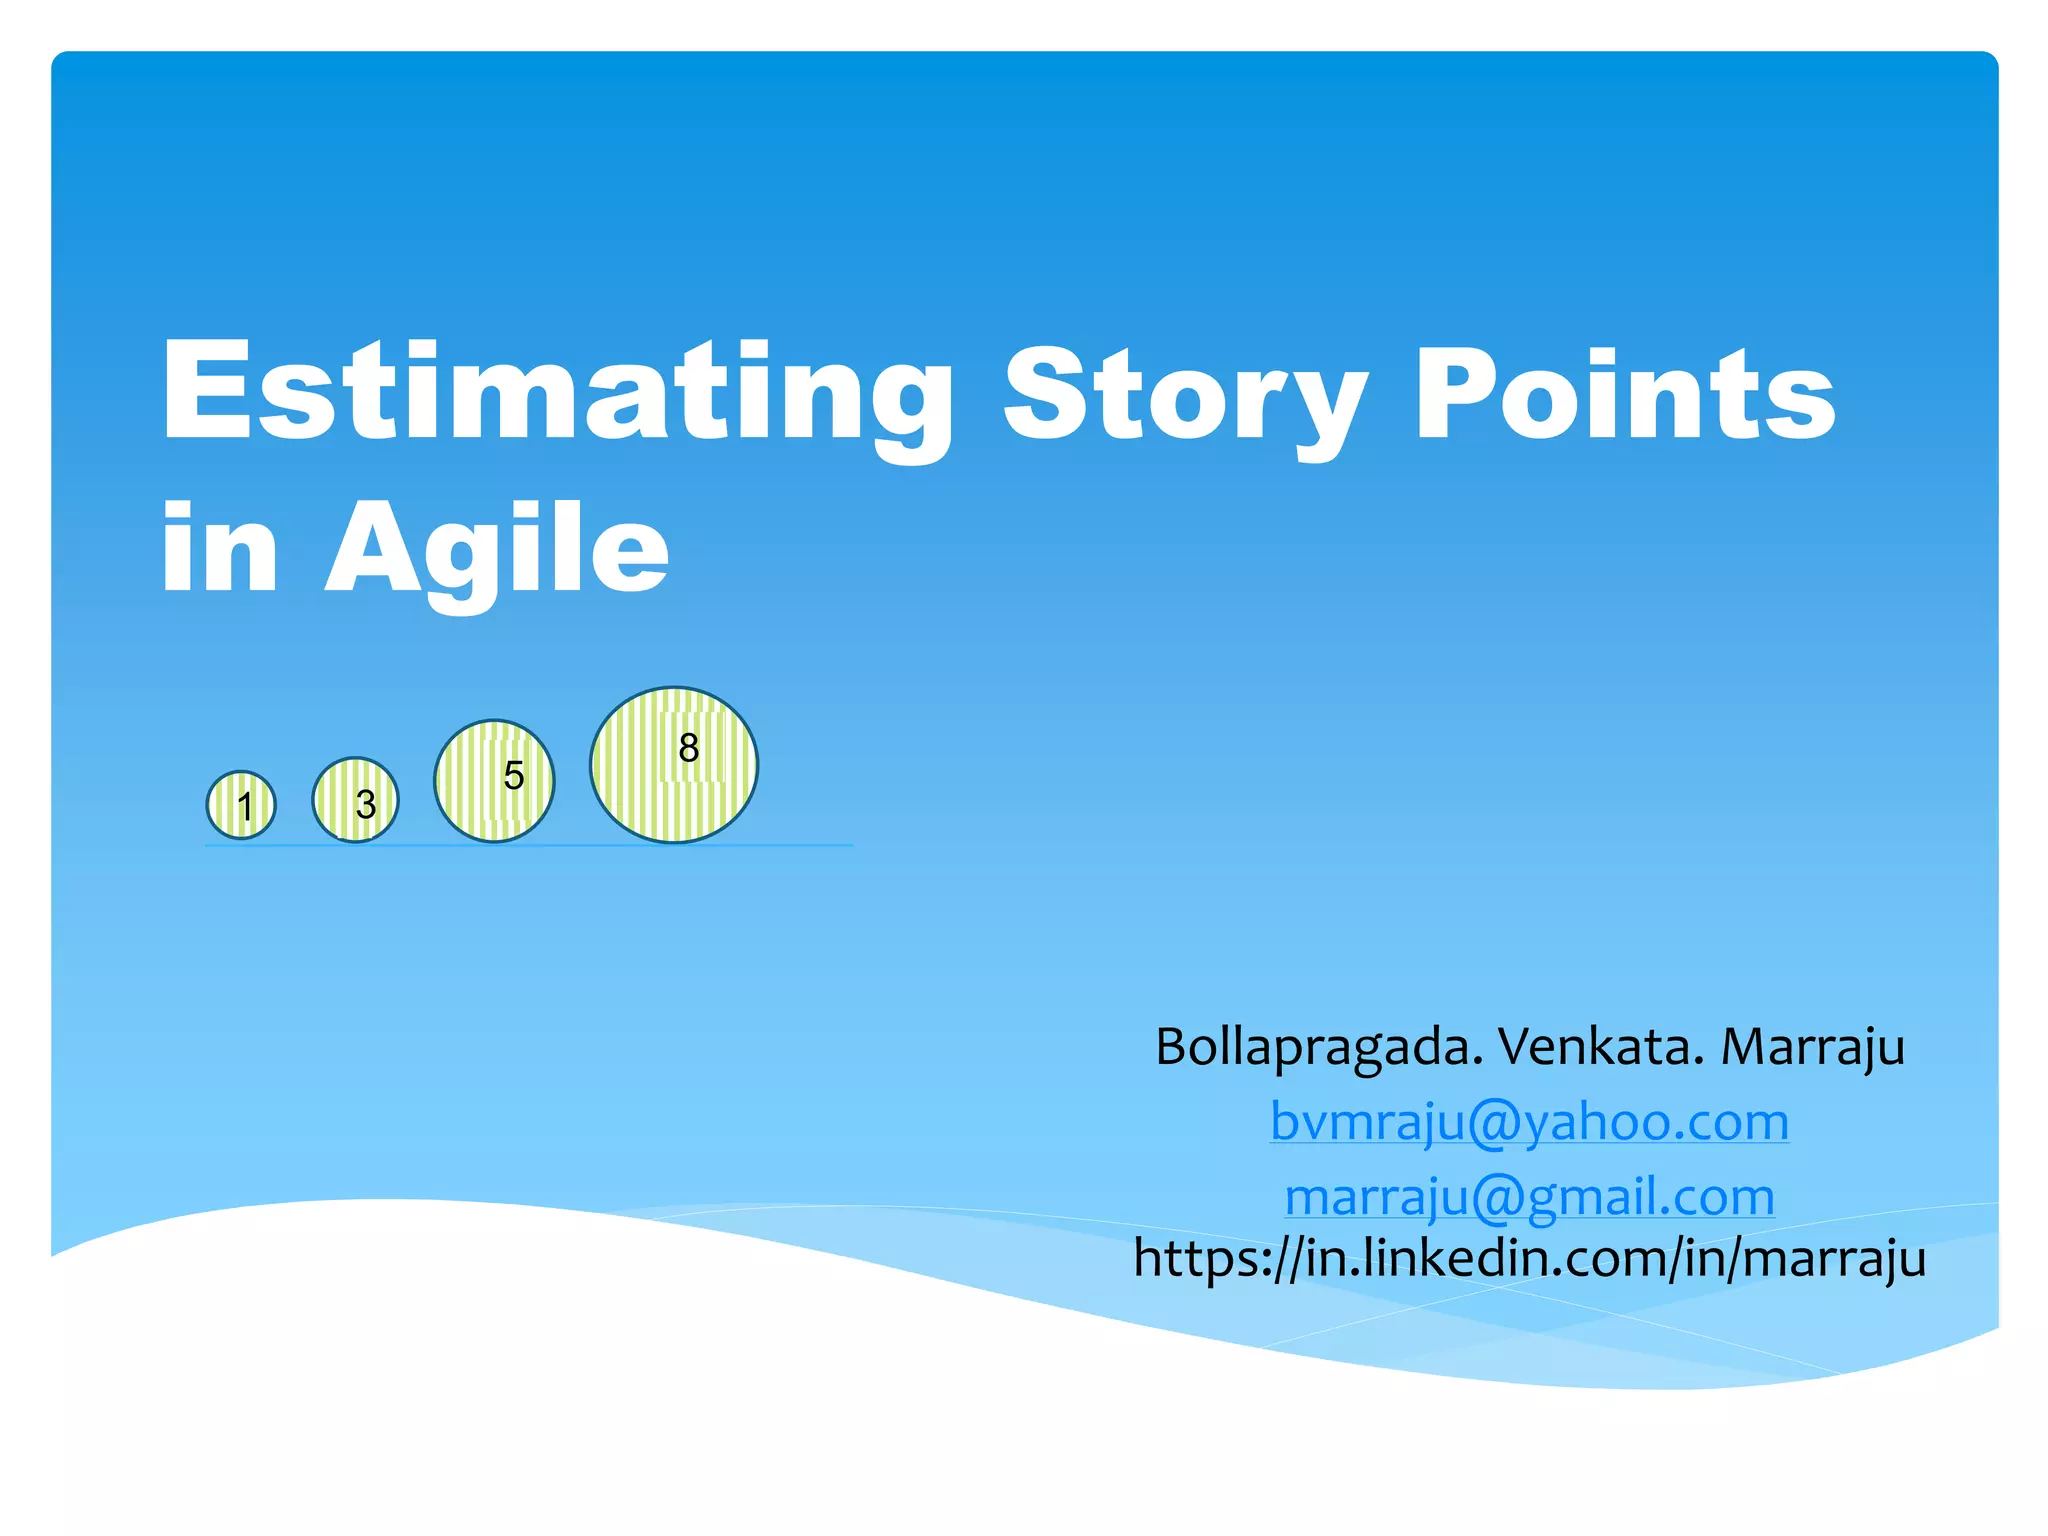
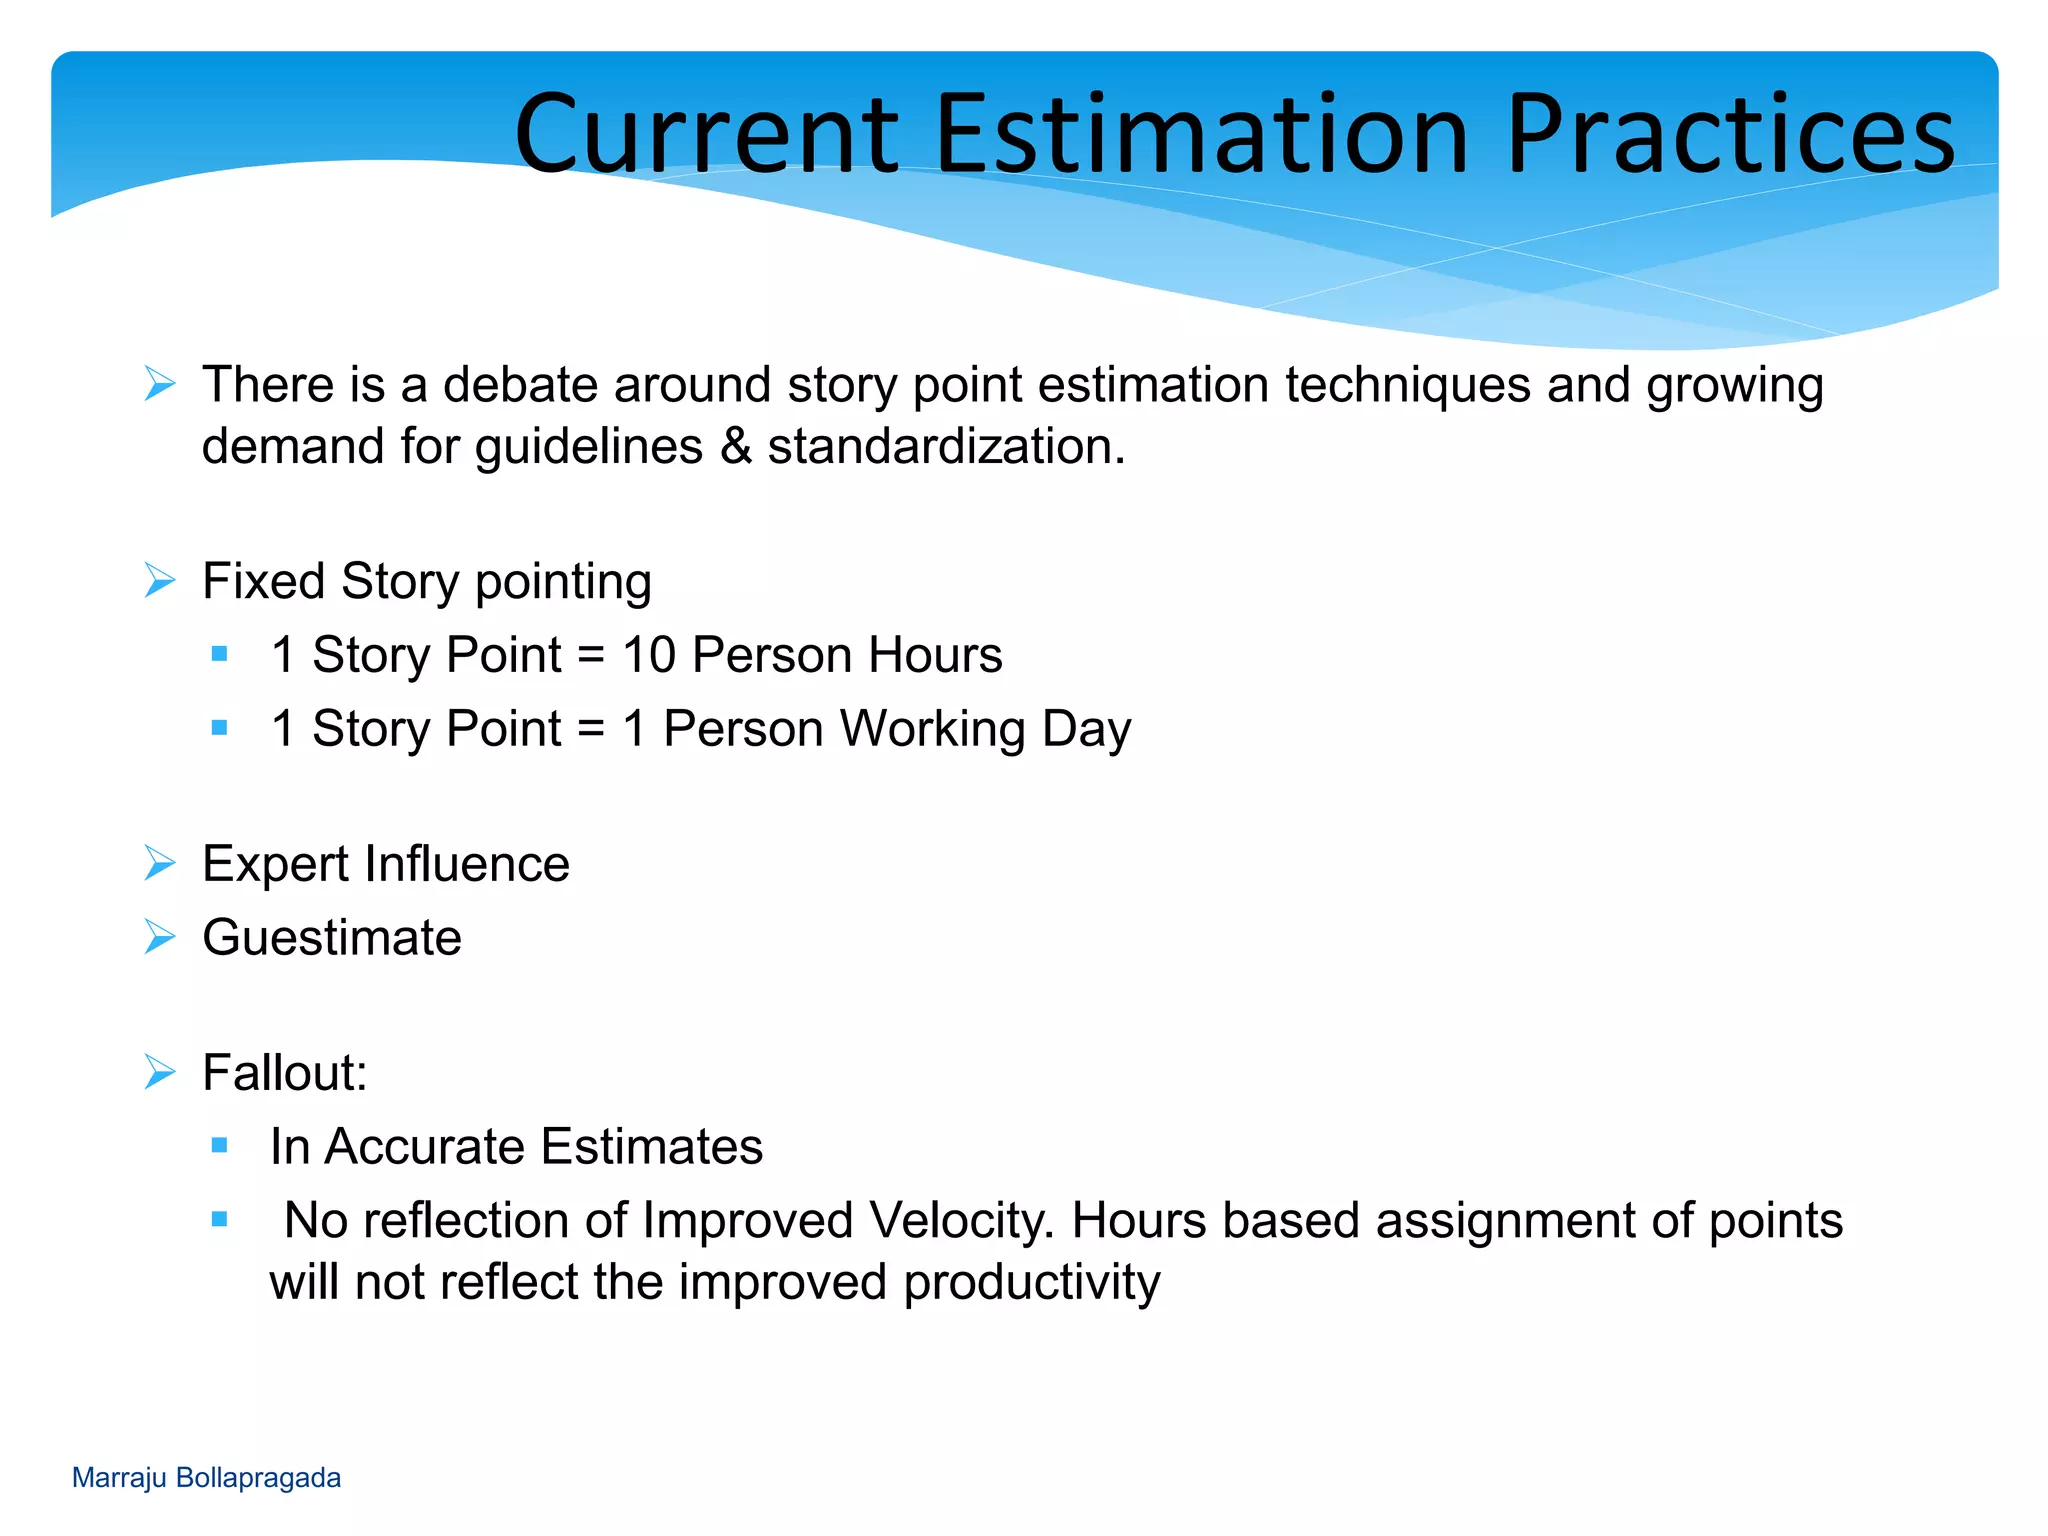
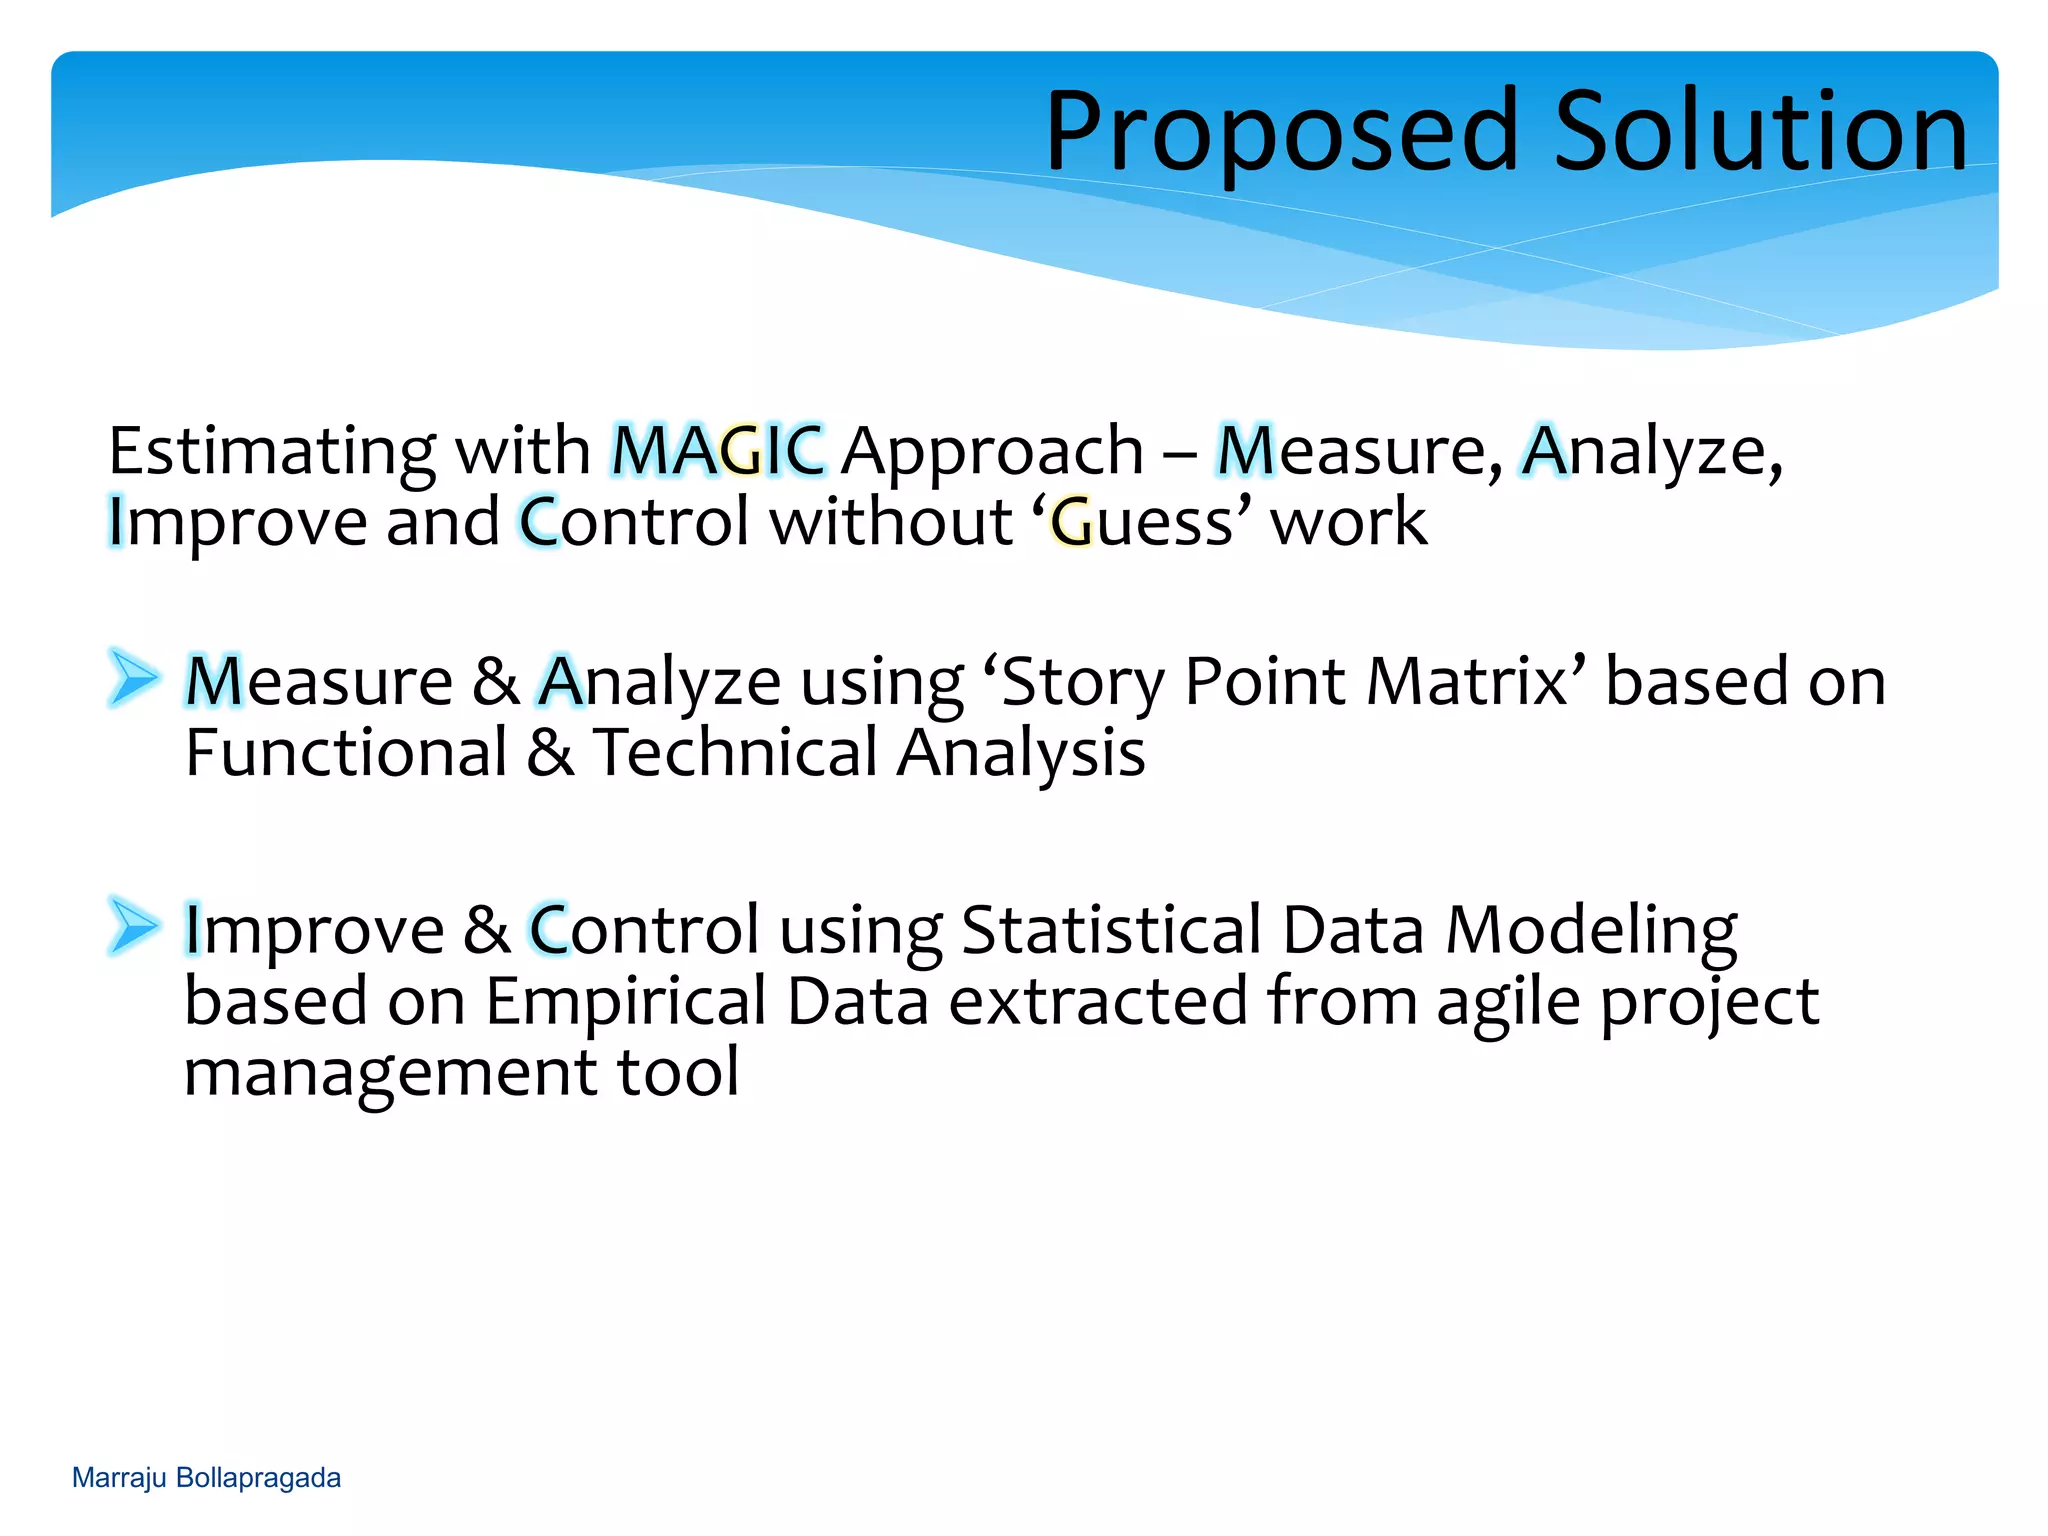


This document discusses techniques for estimating story points in Agile projects. It describes current estimation practices like fixed story pointing based on person hours or days, expert influence, and guestimating. These can lead to inaccurate estimates and not reflect improved productivity over time. The document proposes an approach called MAGIC which uses a story point matrix based on functional and technical analysis to measure and analyze stories, and an empirical data model using historical project data to improve and control estimates. Templates are provided for the story point matrix and empirical data model.
Introduction to story point estimation techniques and the issues with current practices.
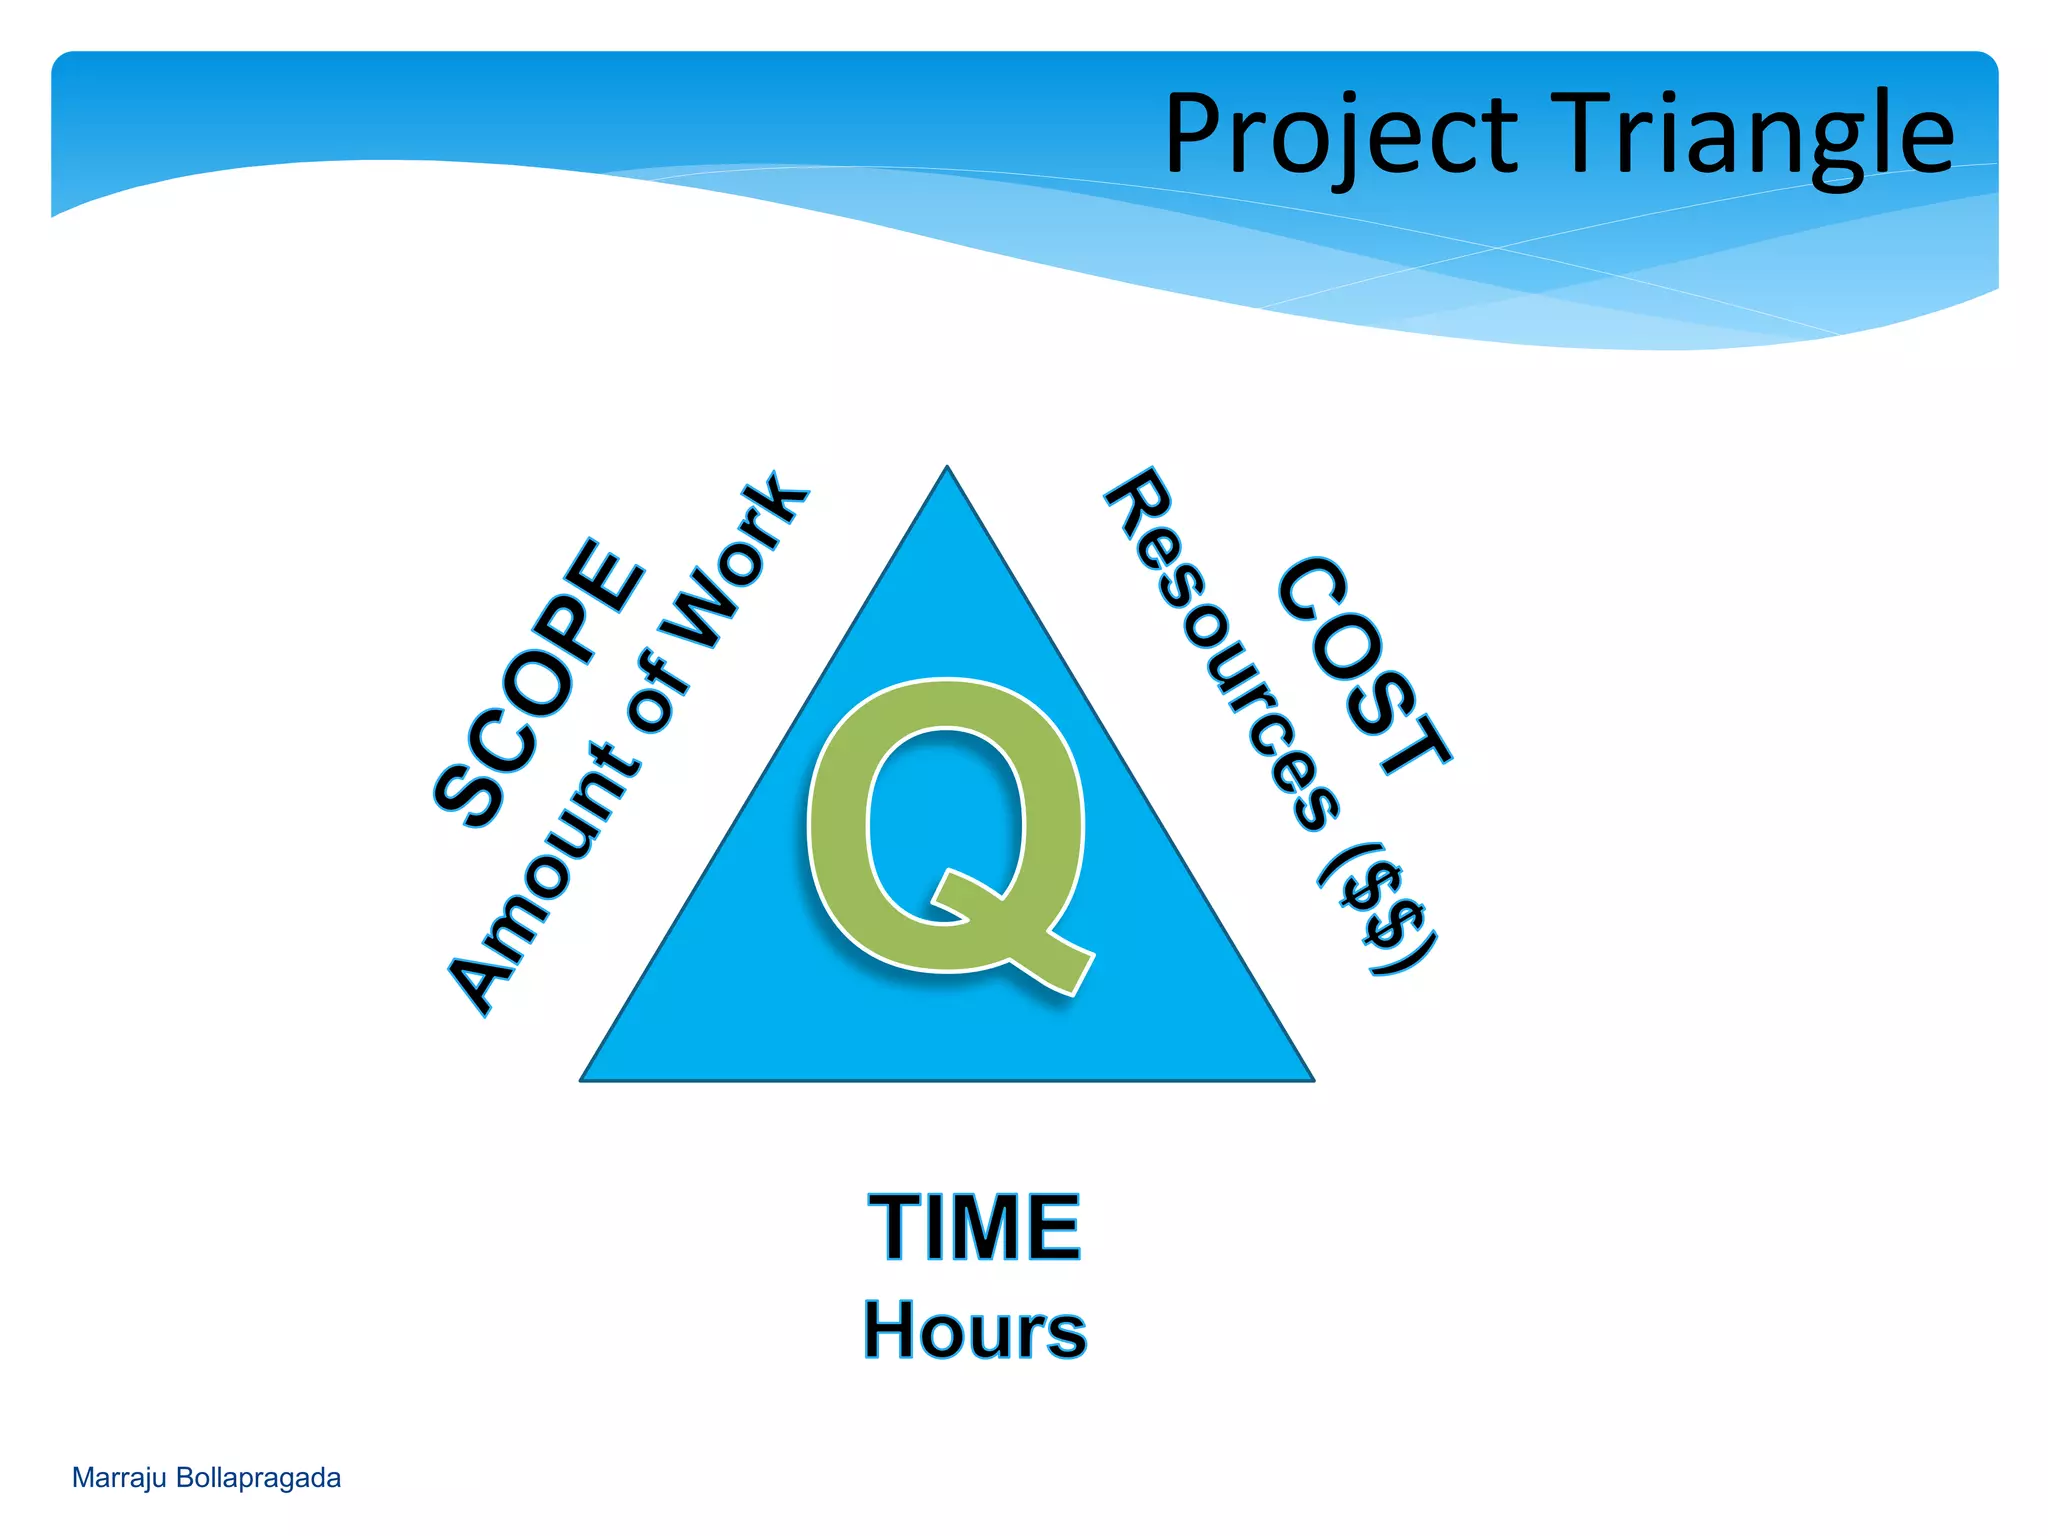
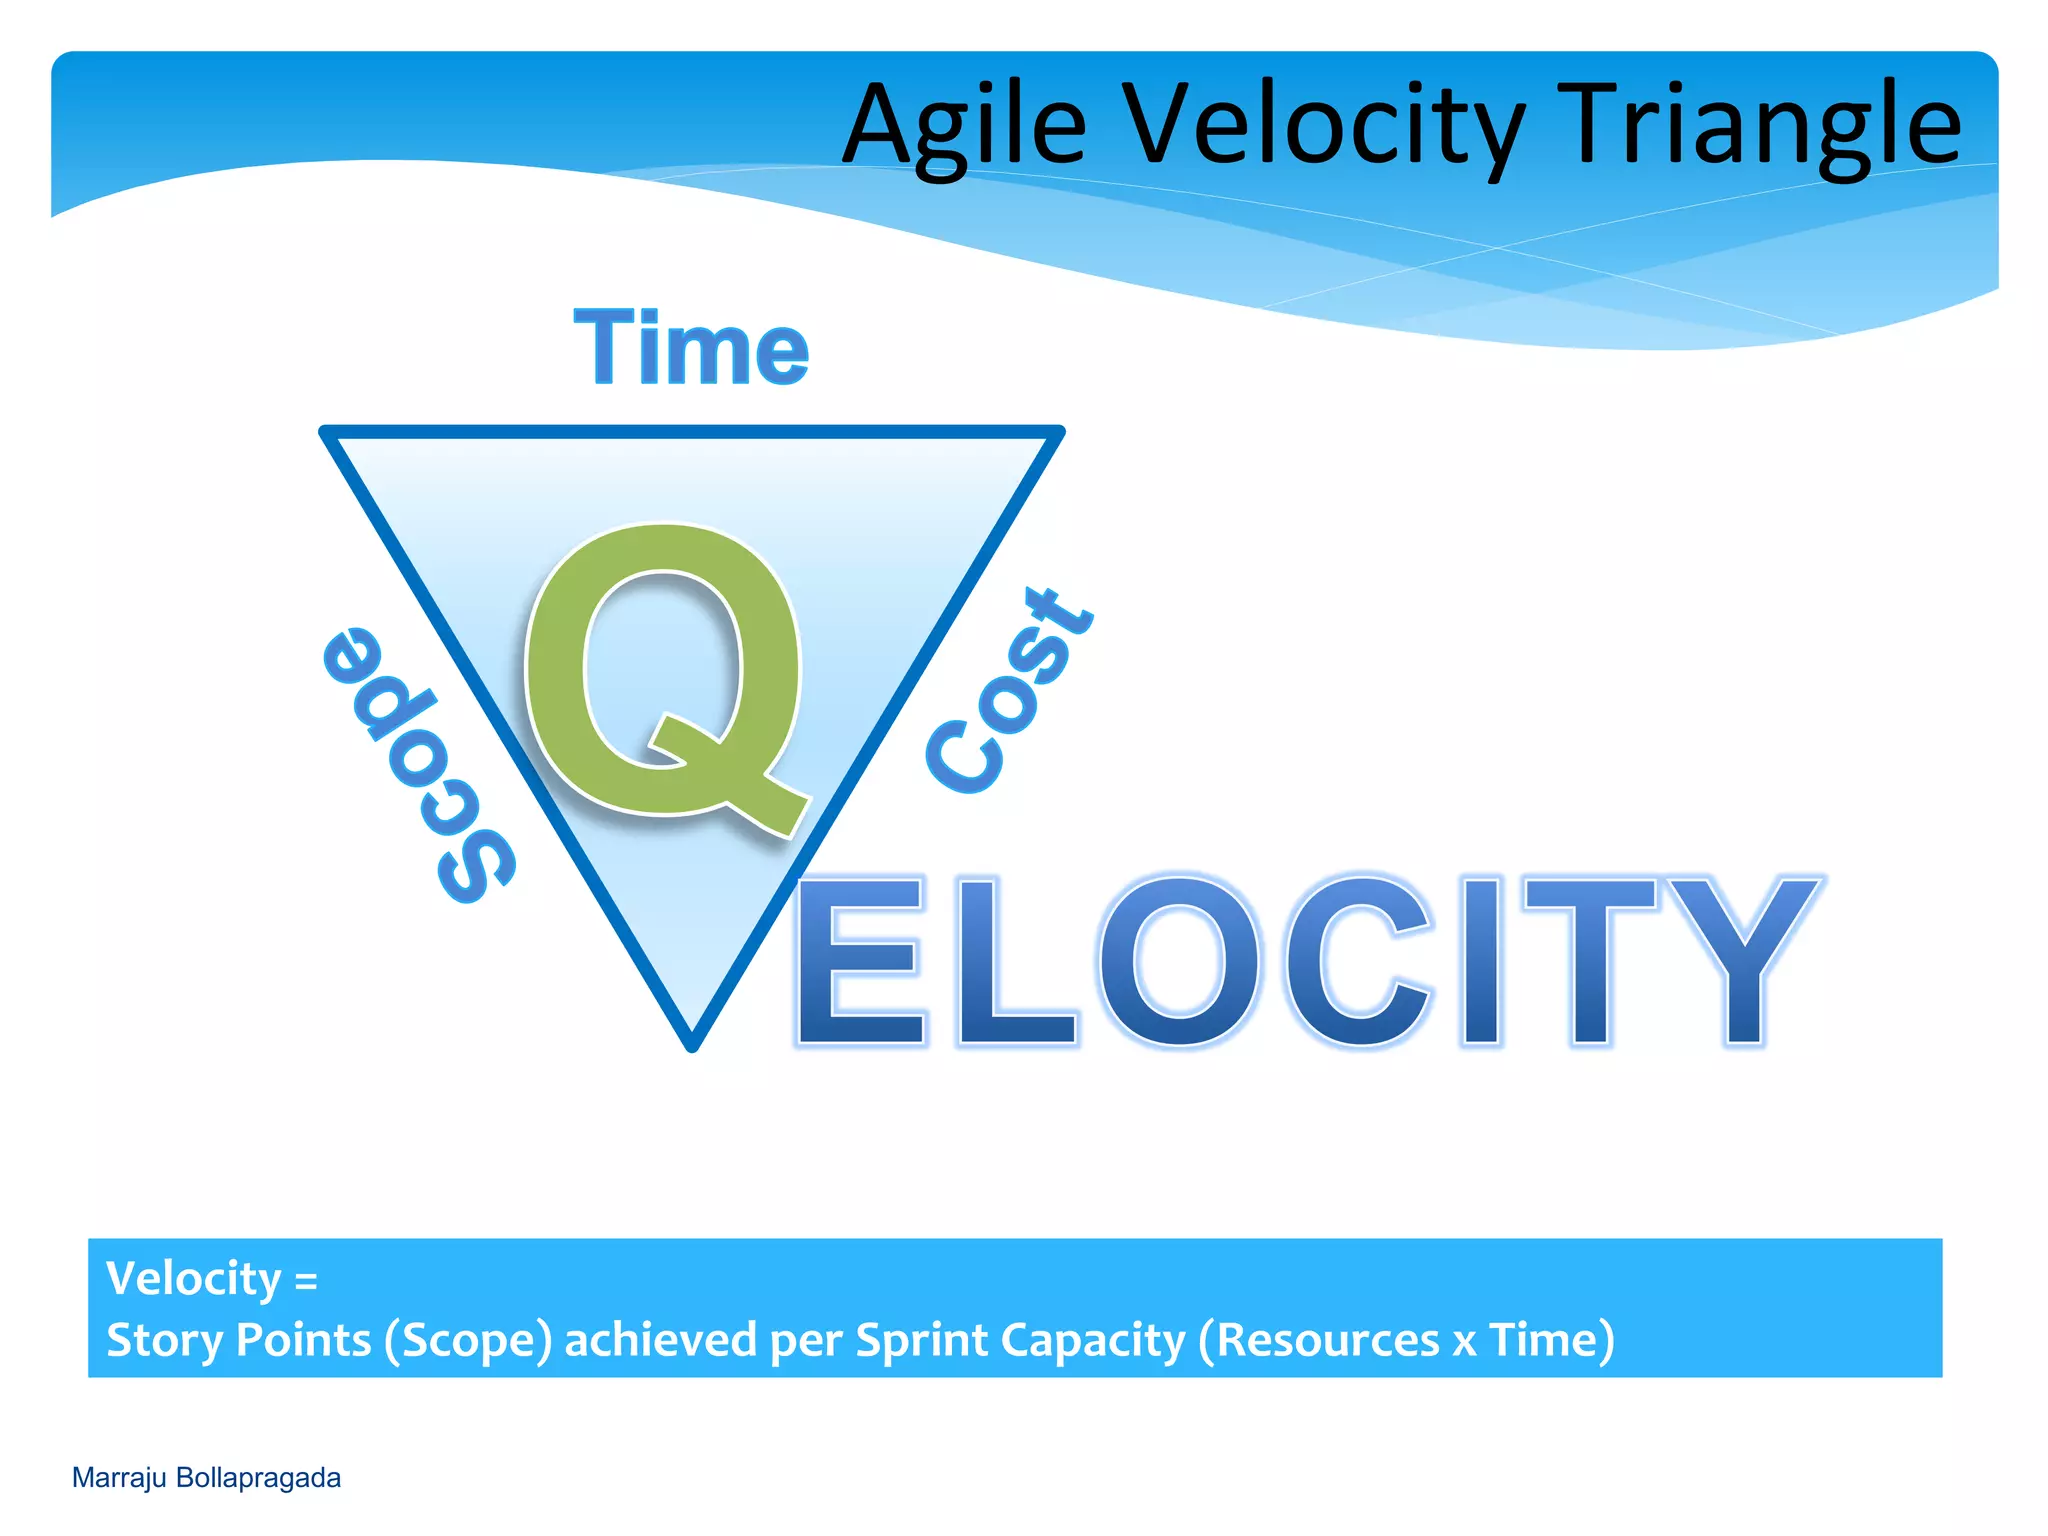
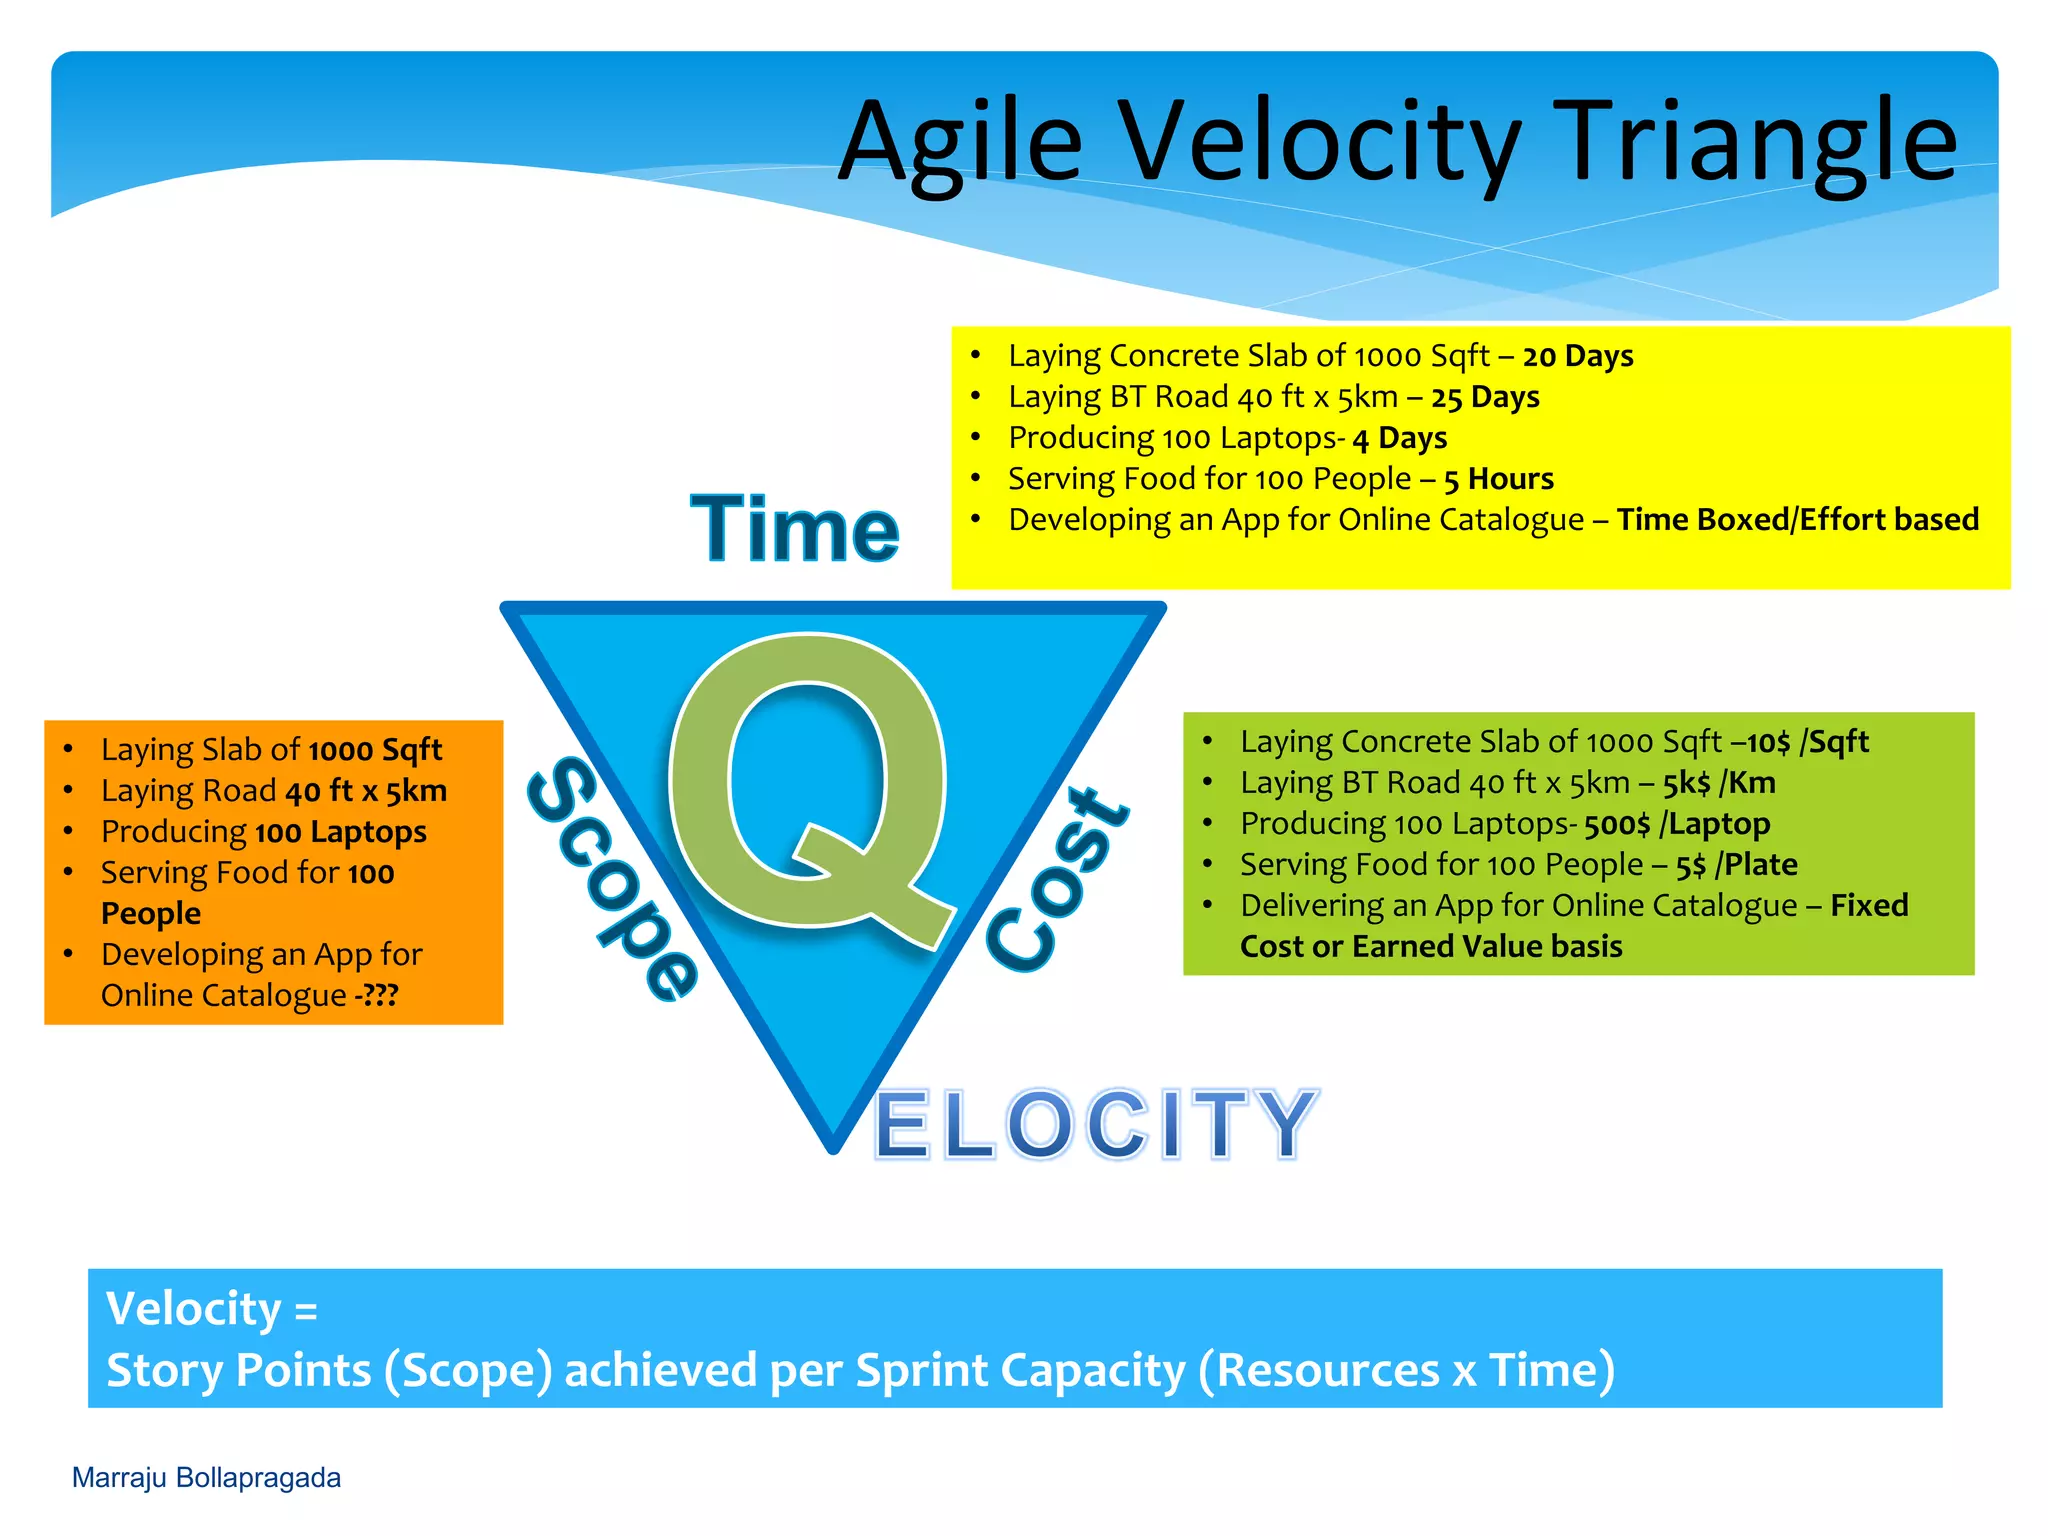
Explains project constraints with velocity defined as story points achieved per sprint.
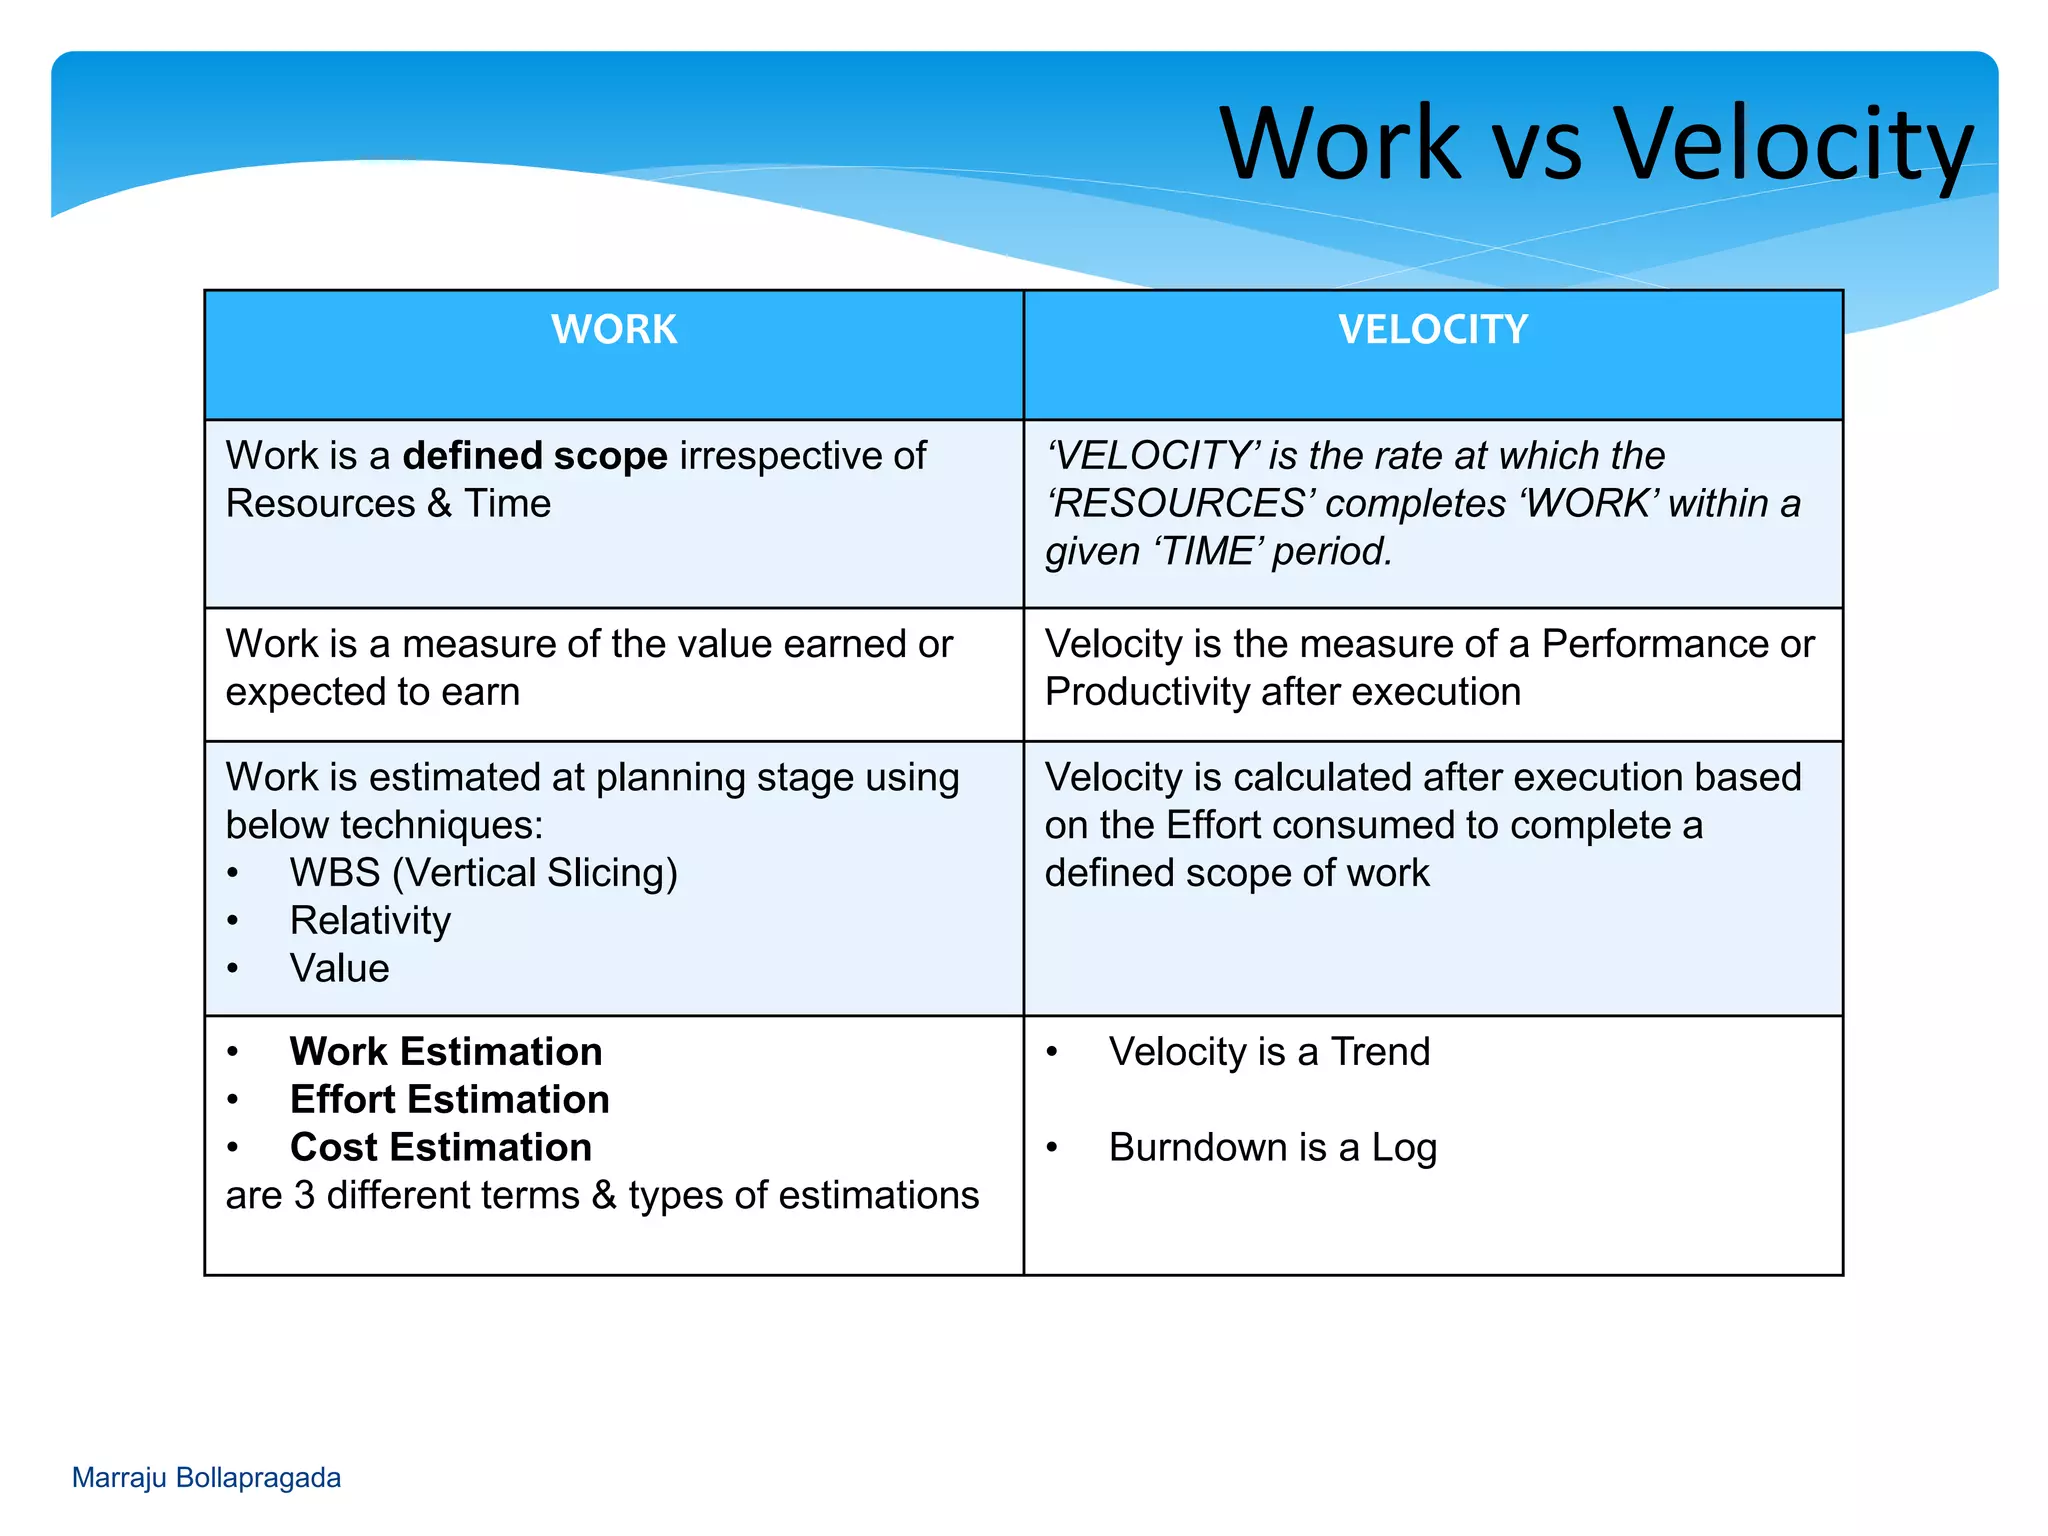
Differentiation between work definition and velocity; methods for measuring and estimating.
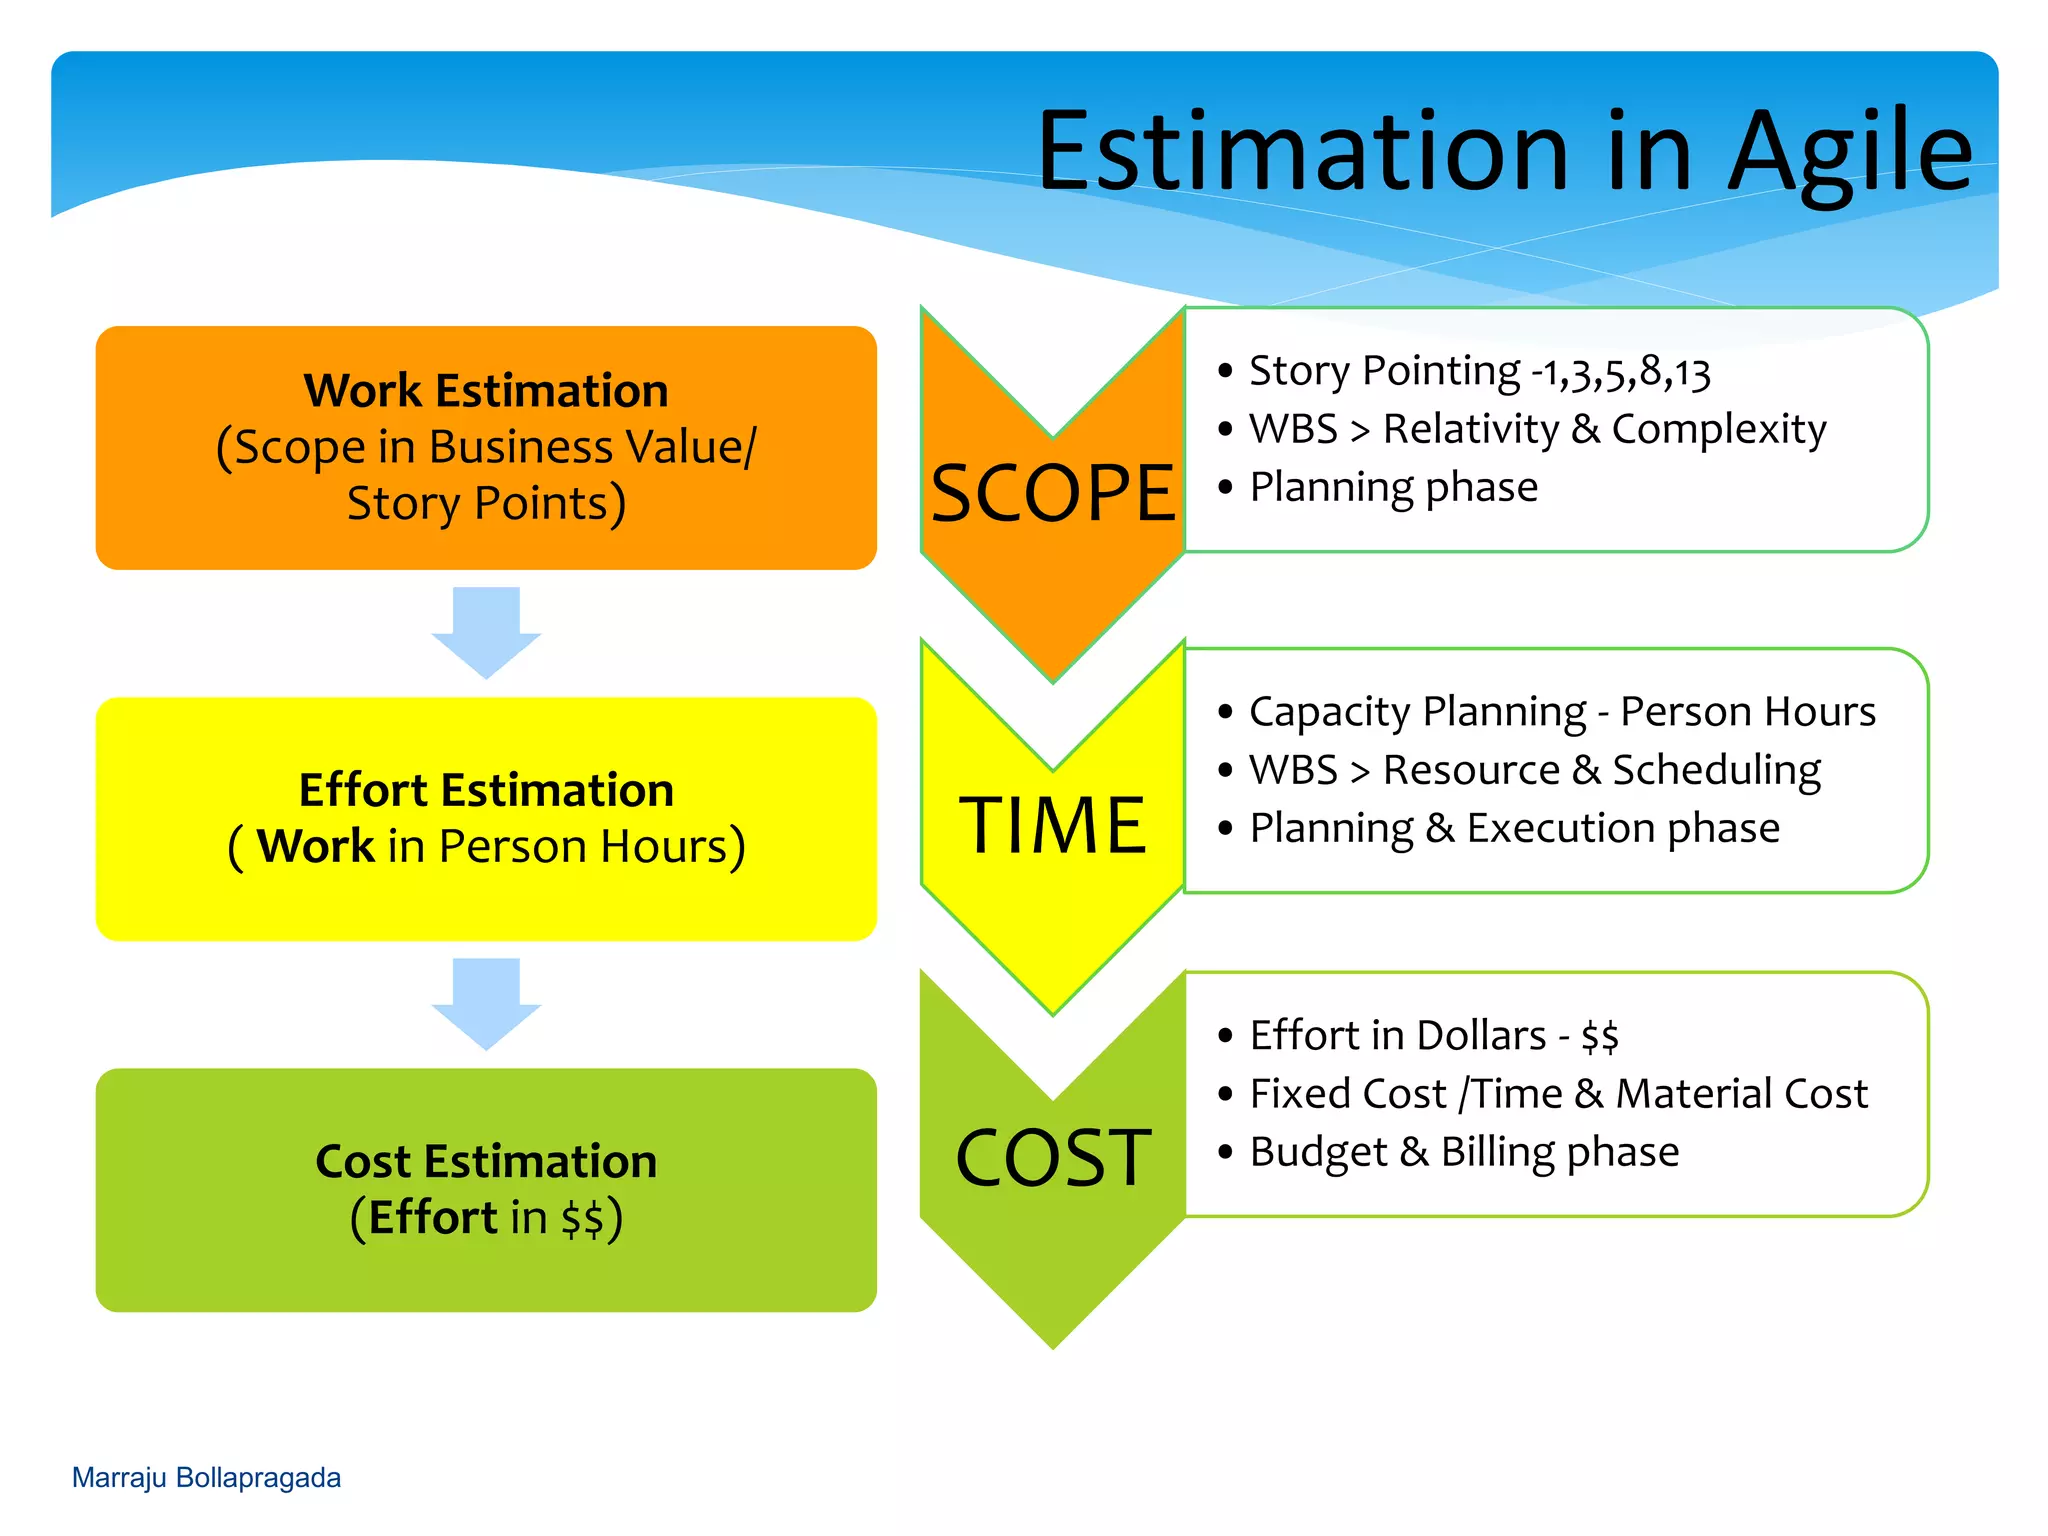
Scope, time, and cost estimations in Agile, and the implication of the MAGIC approach on improving estimates.
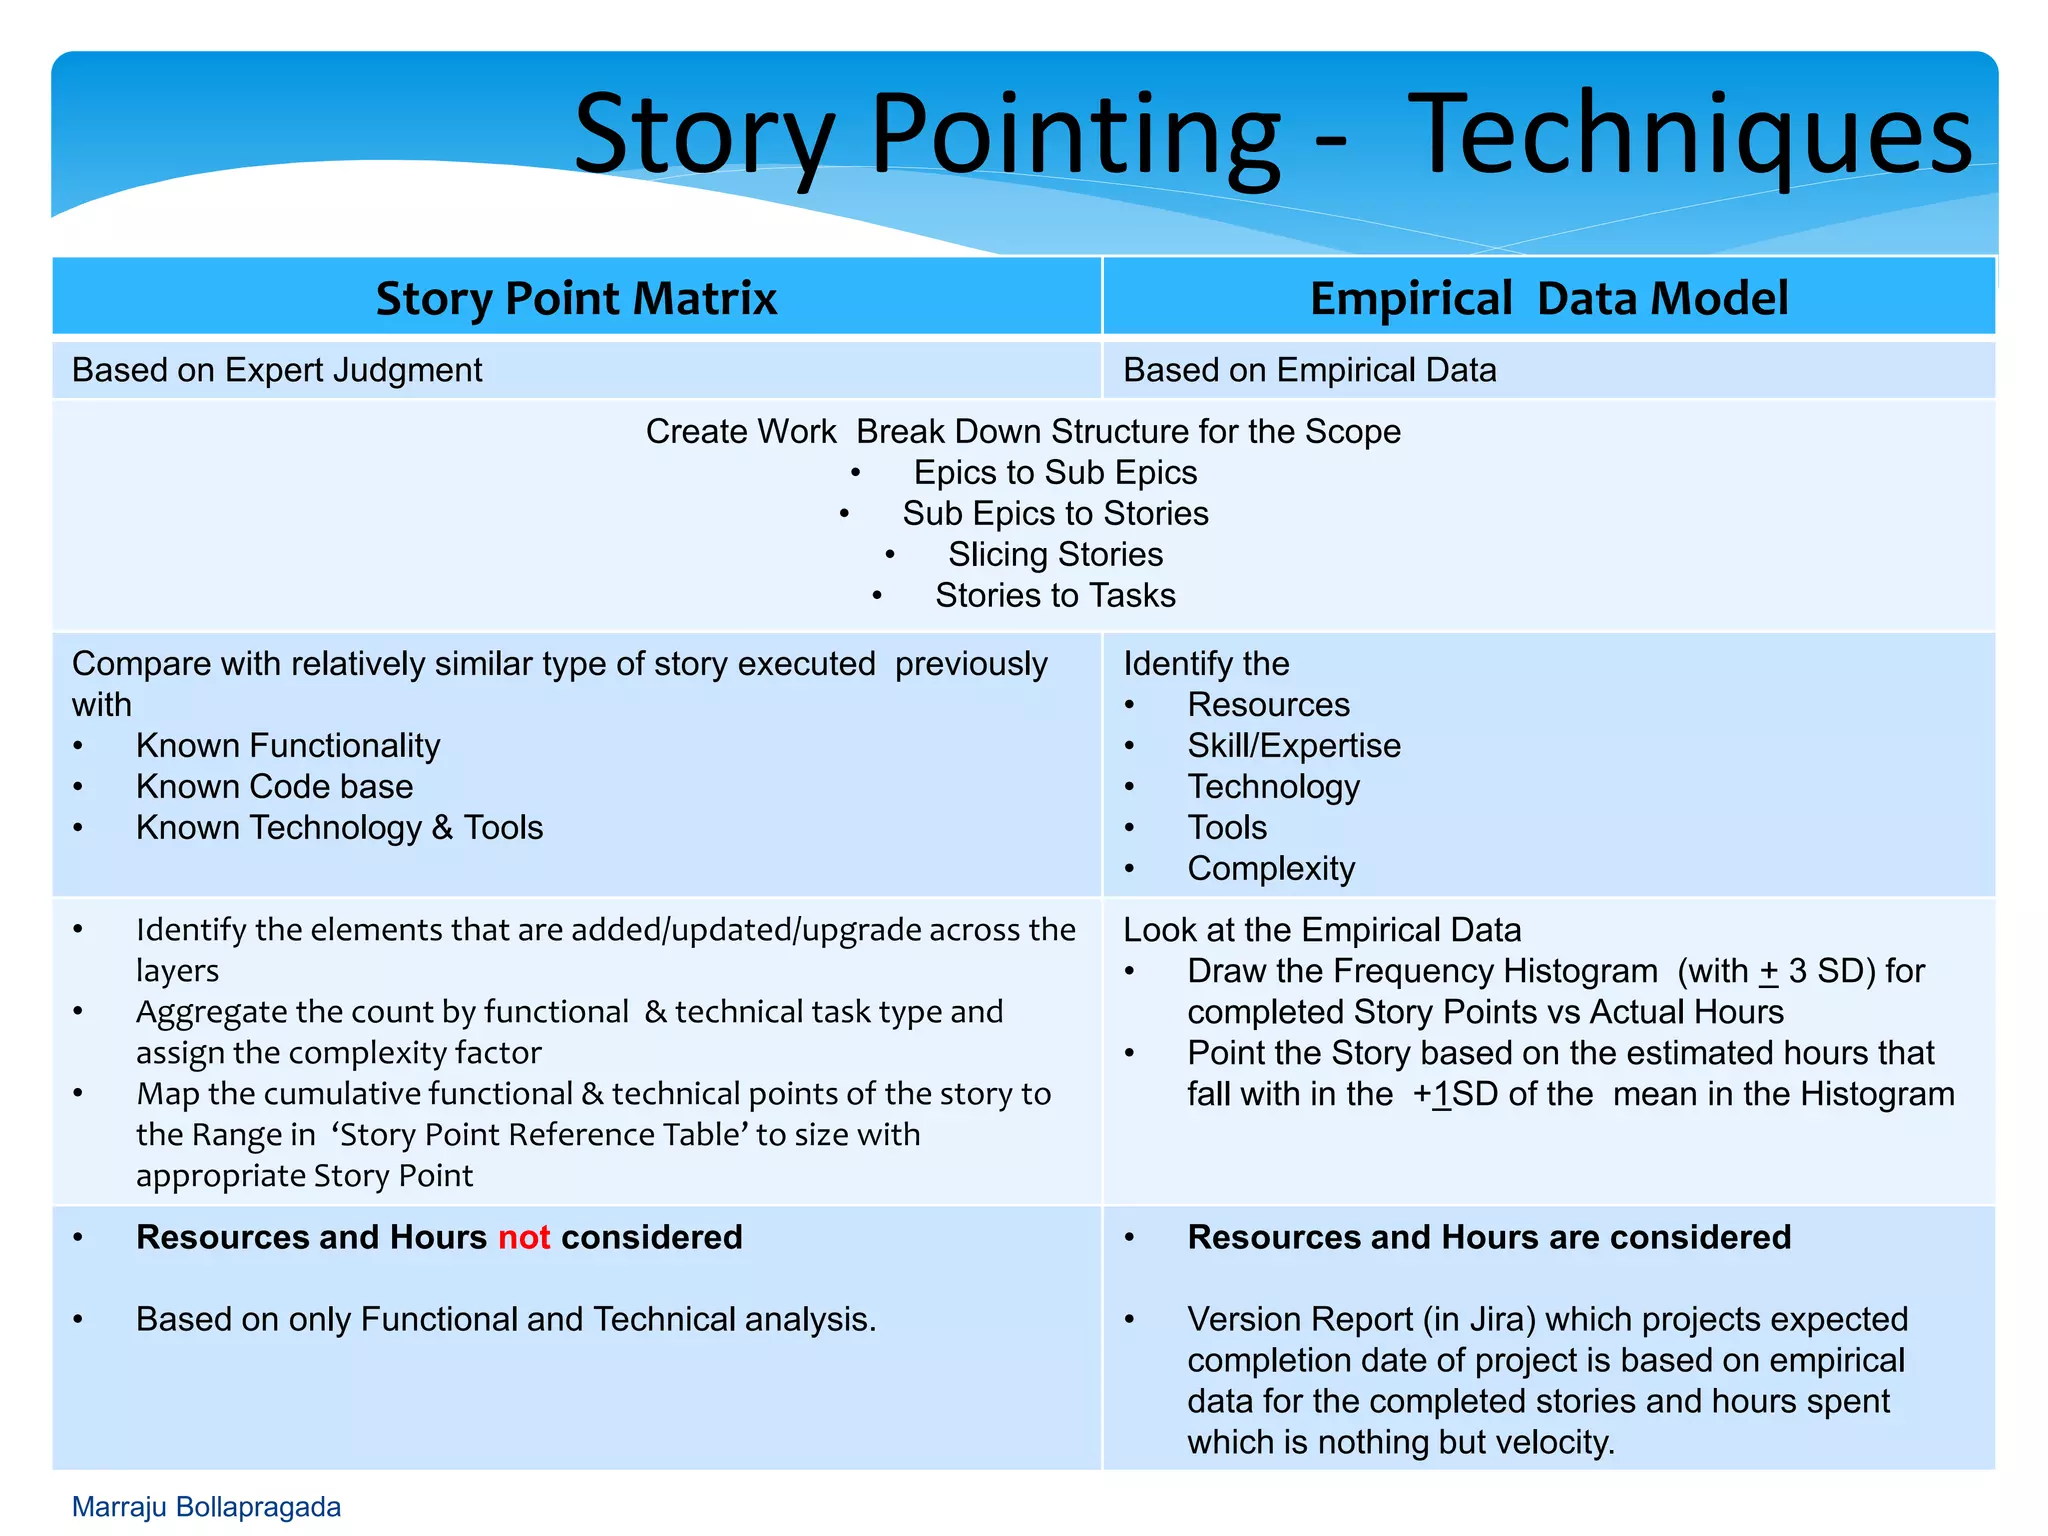
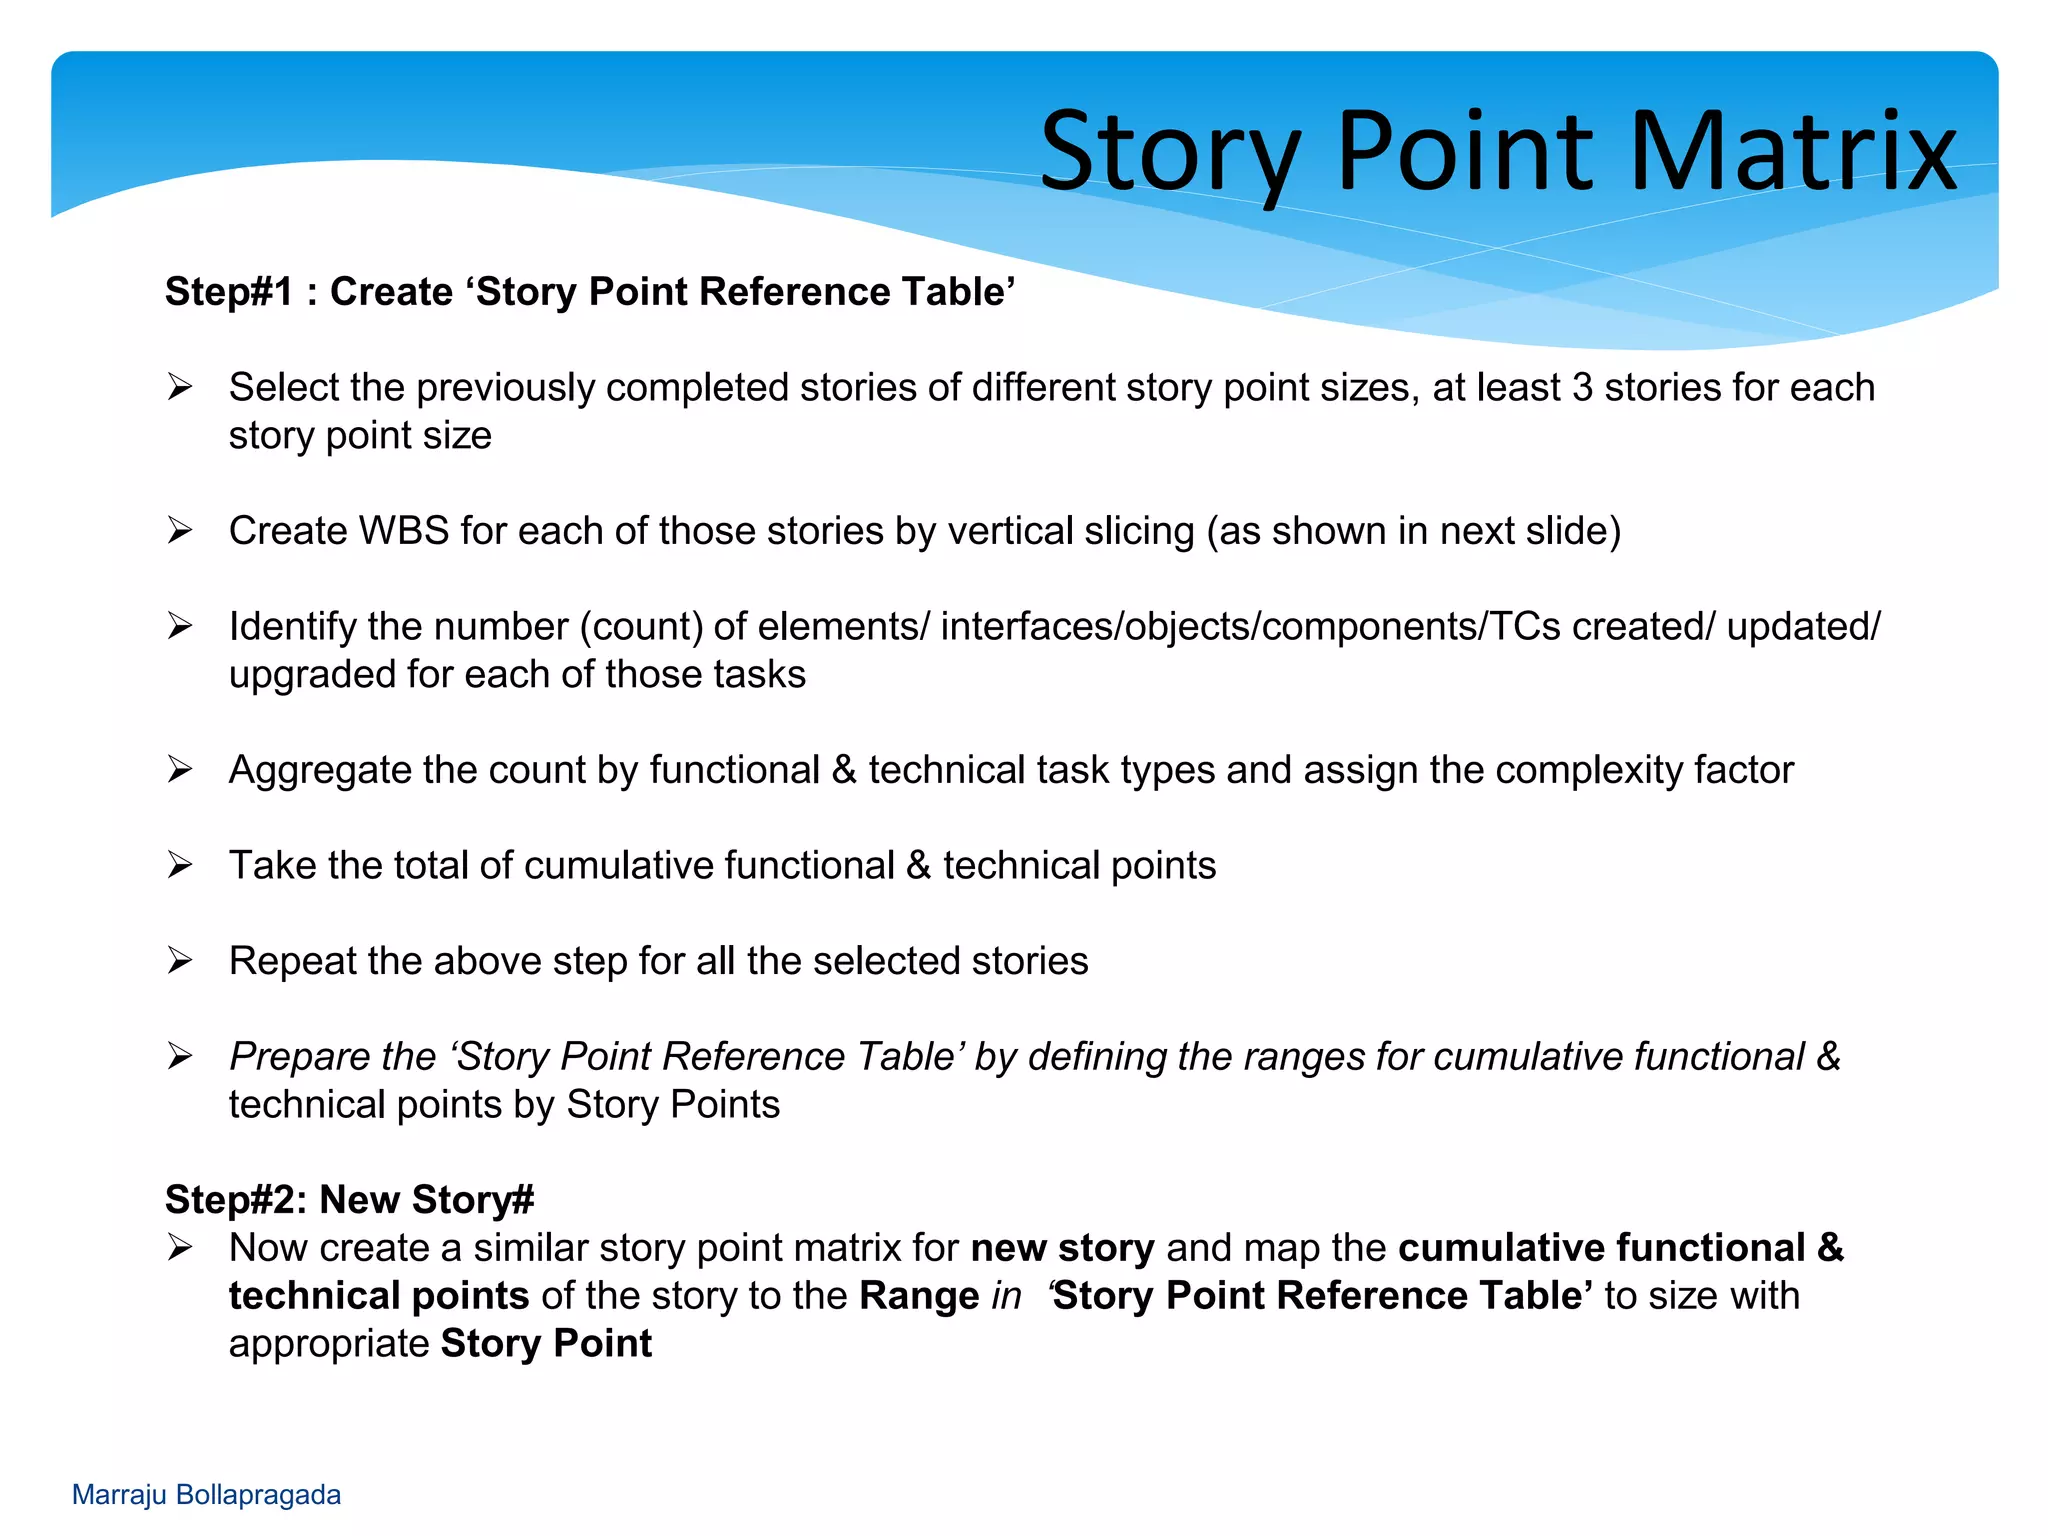
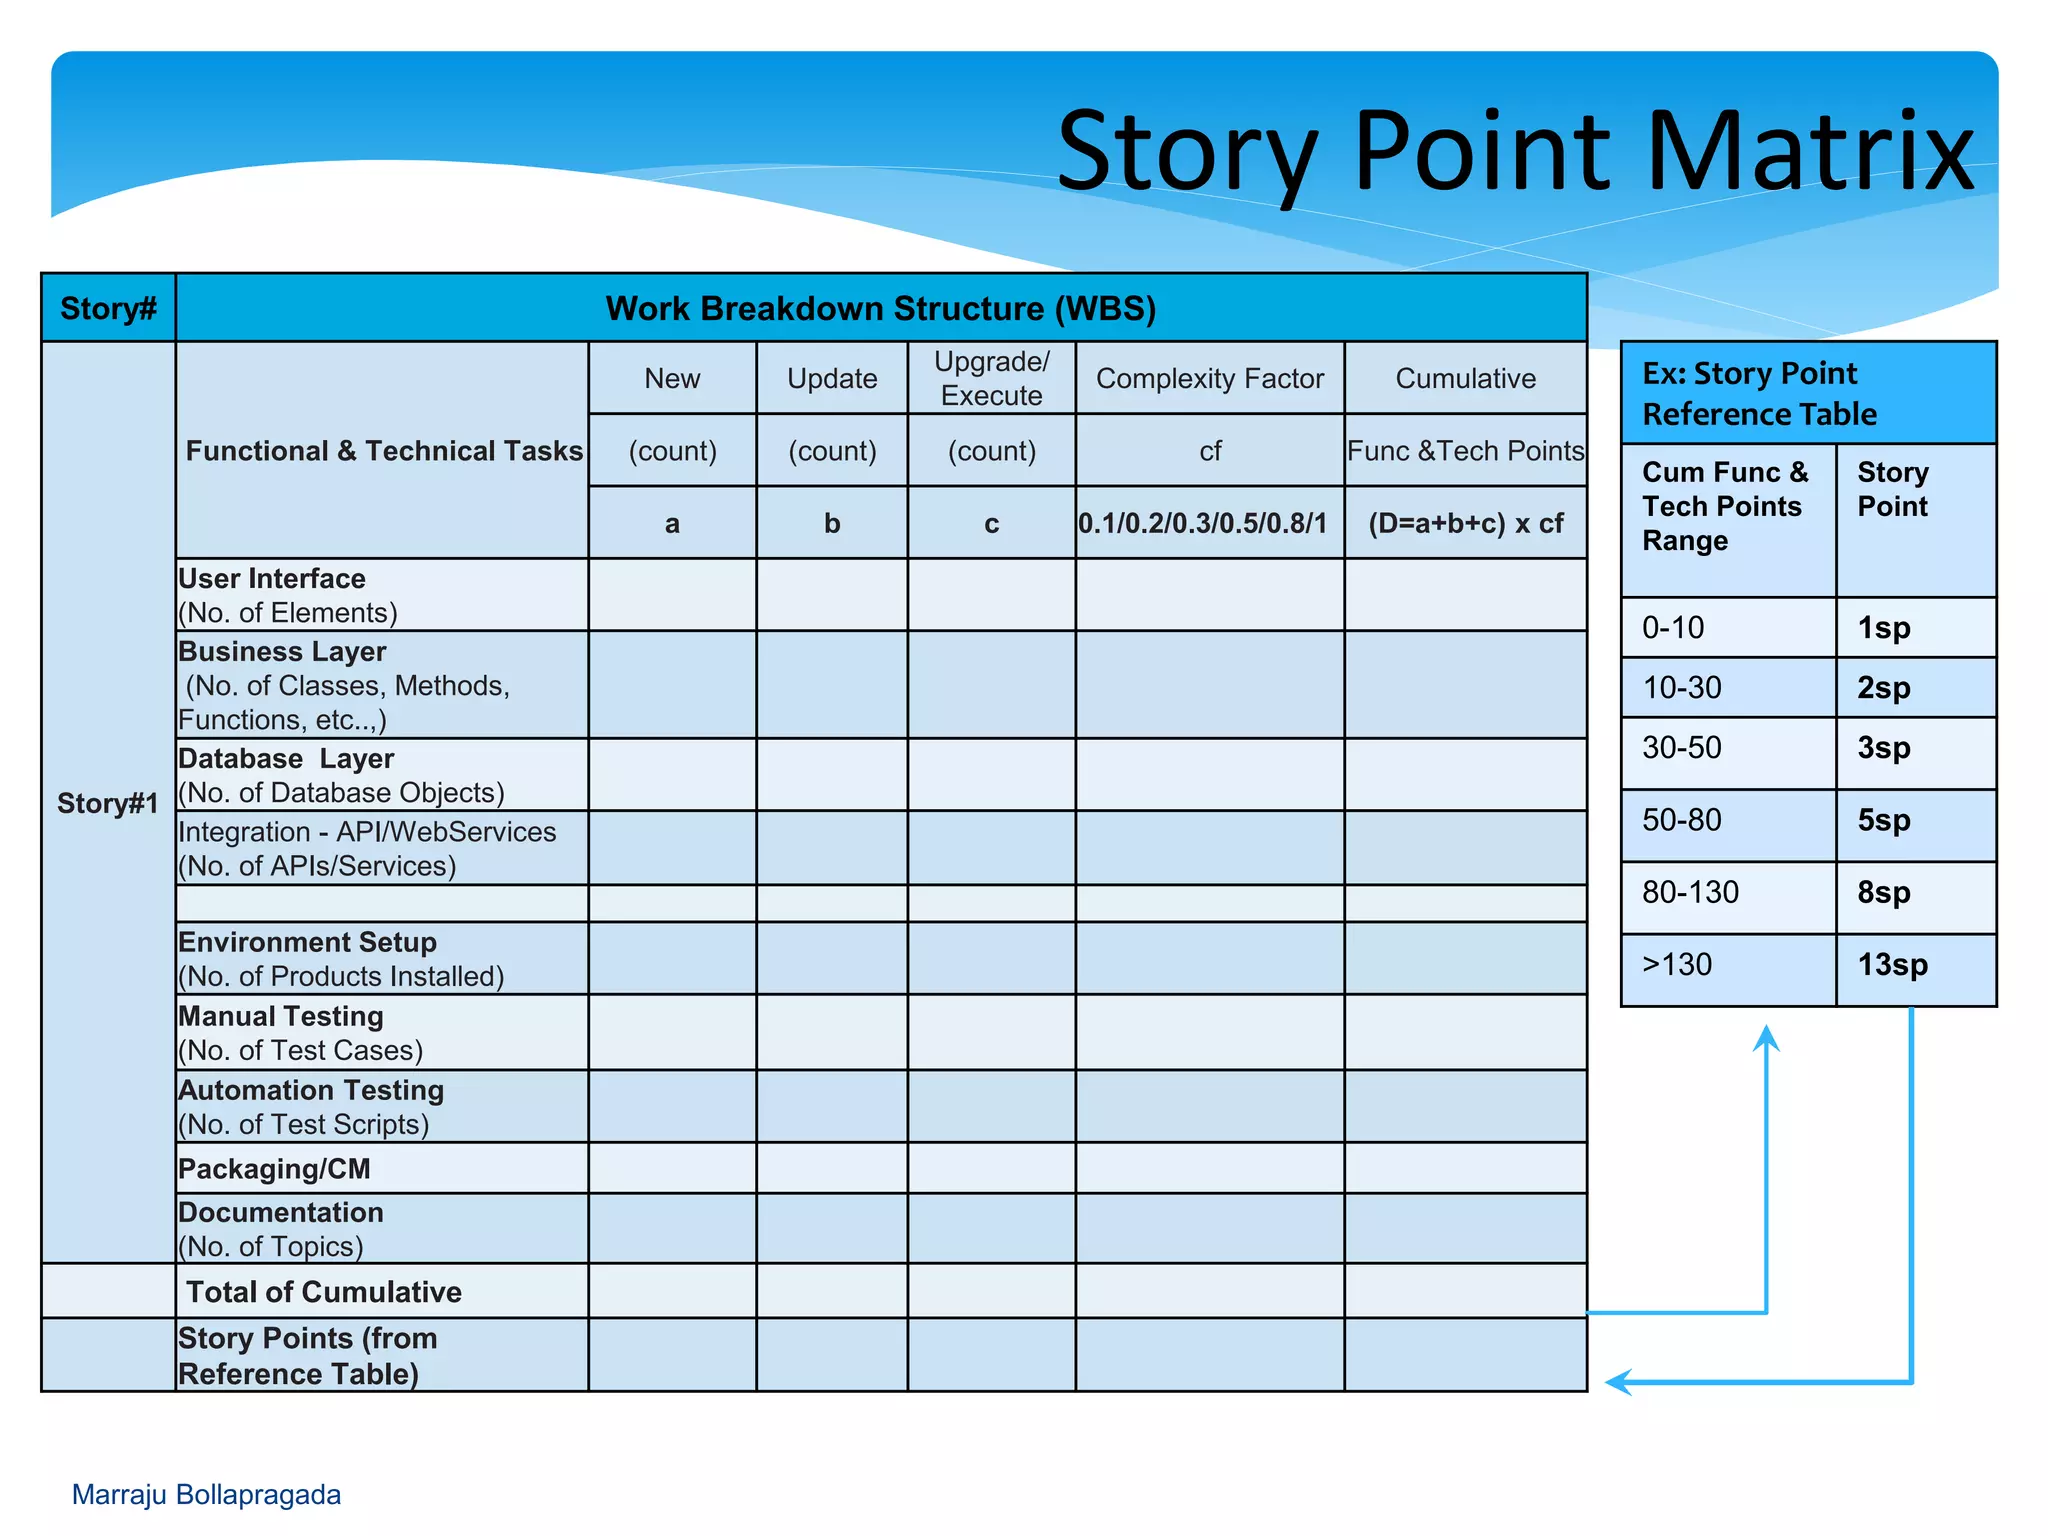
Step-by-step methodology for creating a story point matrix based on functional and technical analysis.
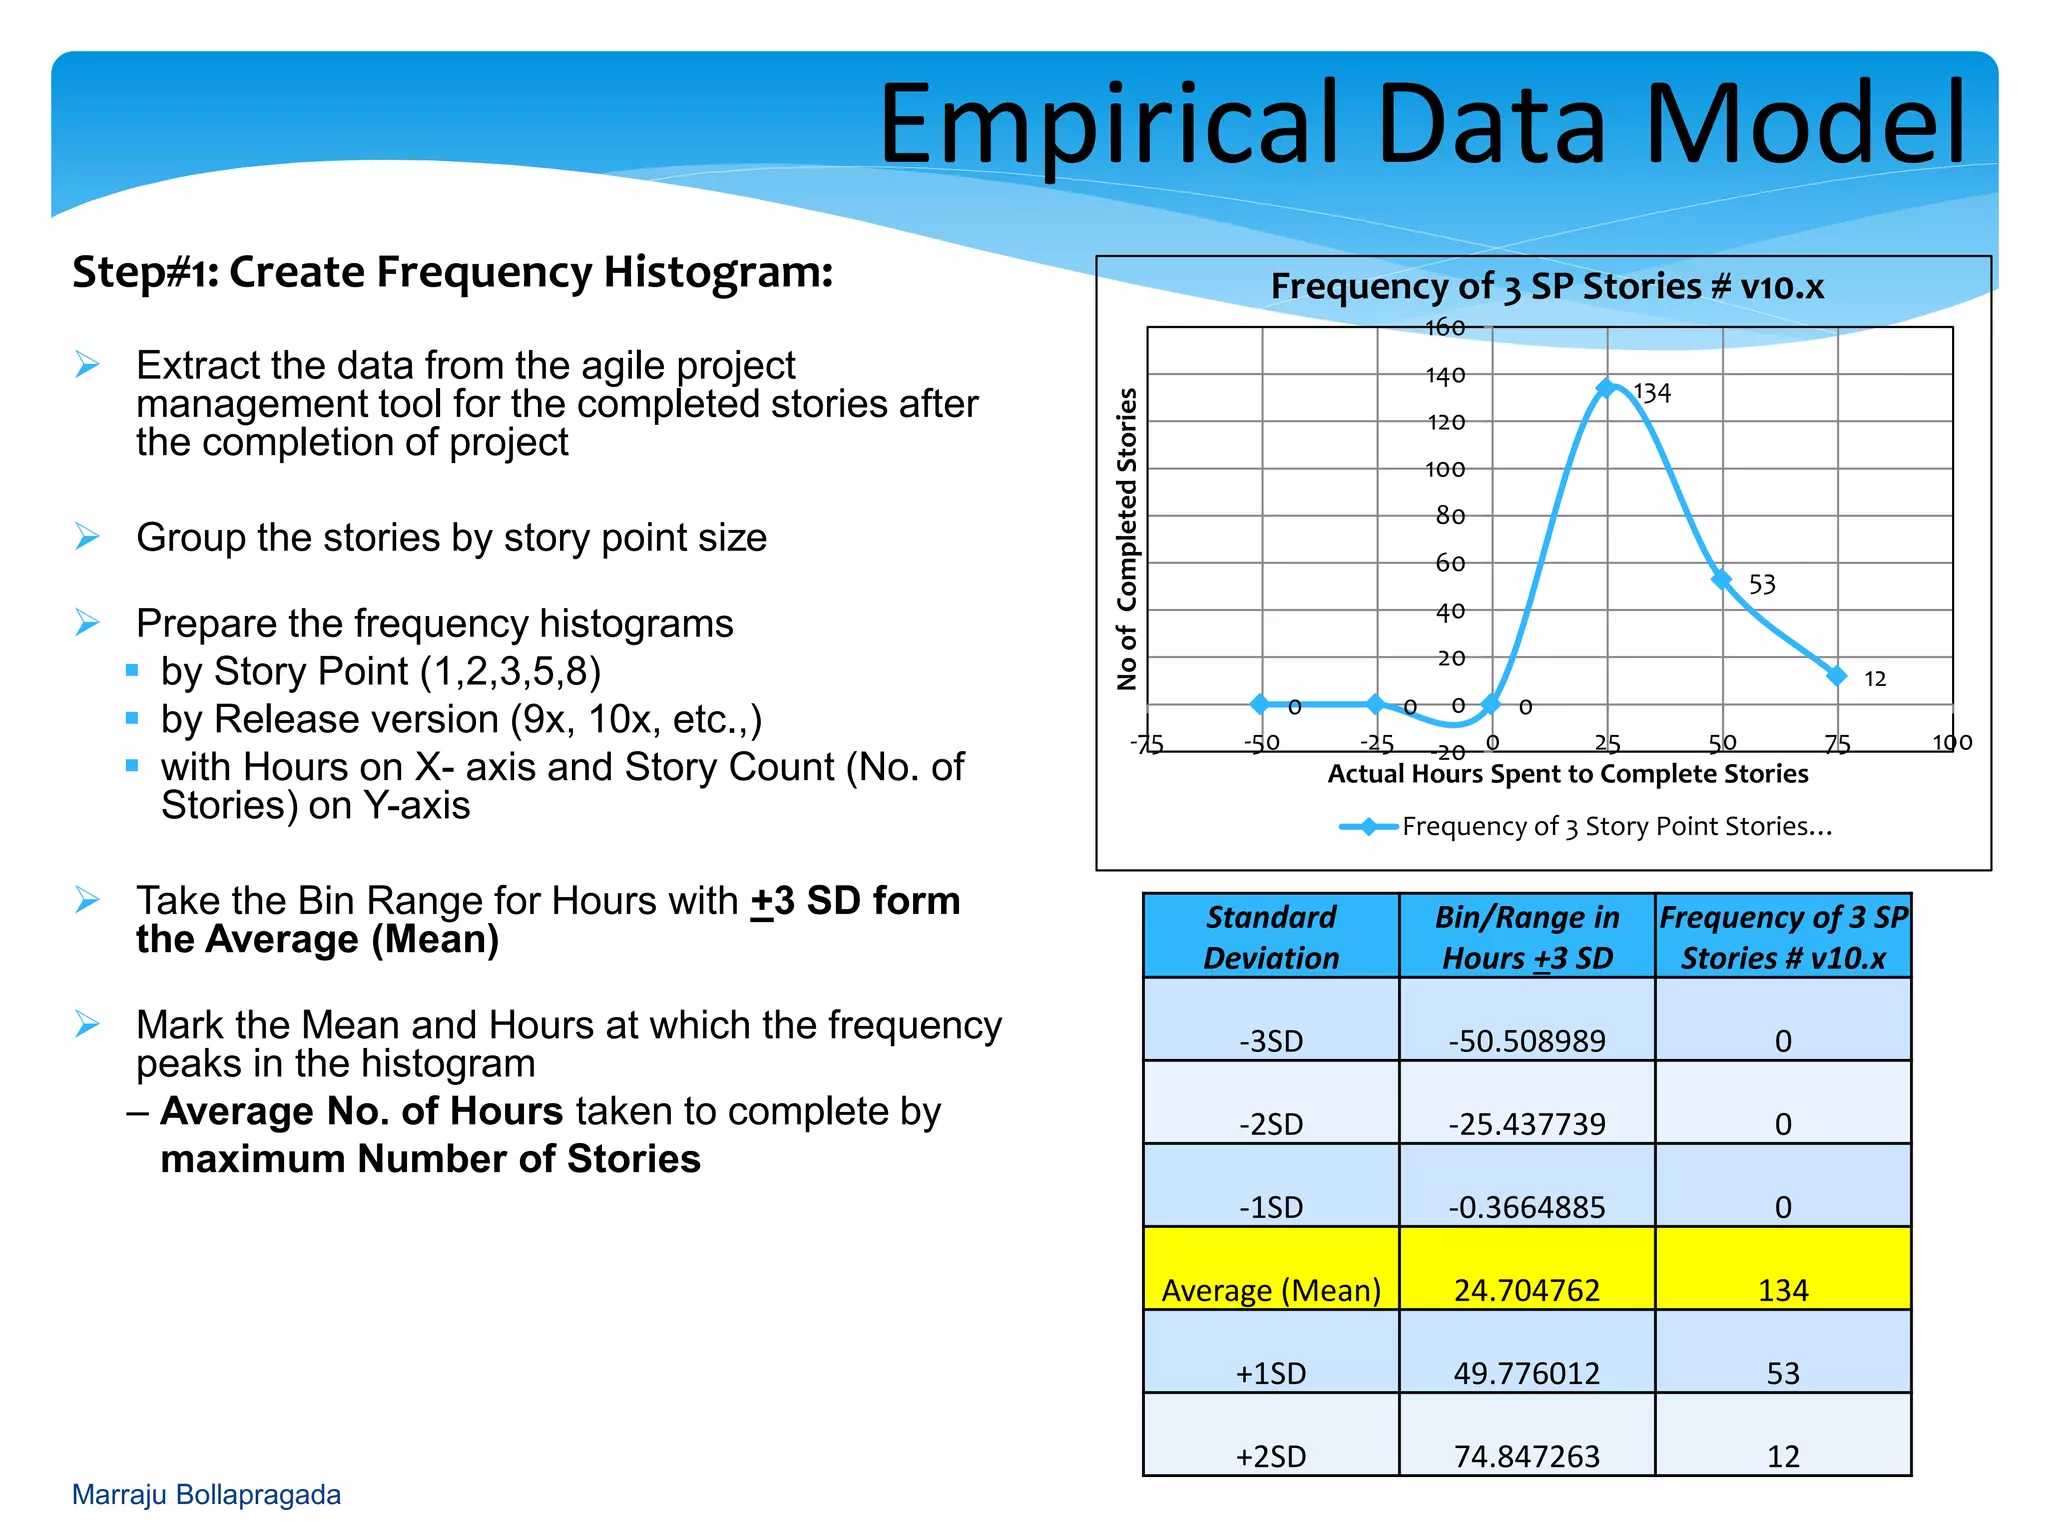
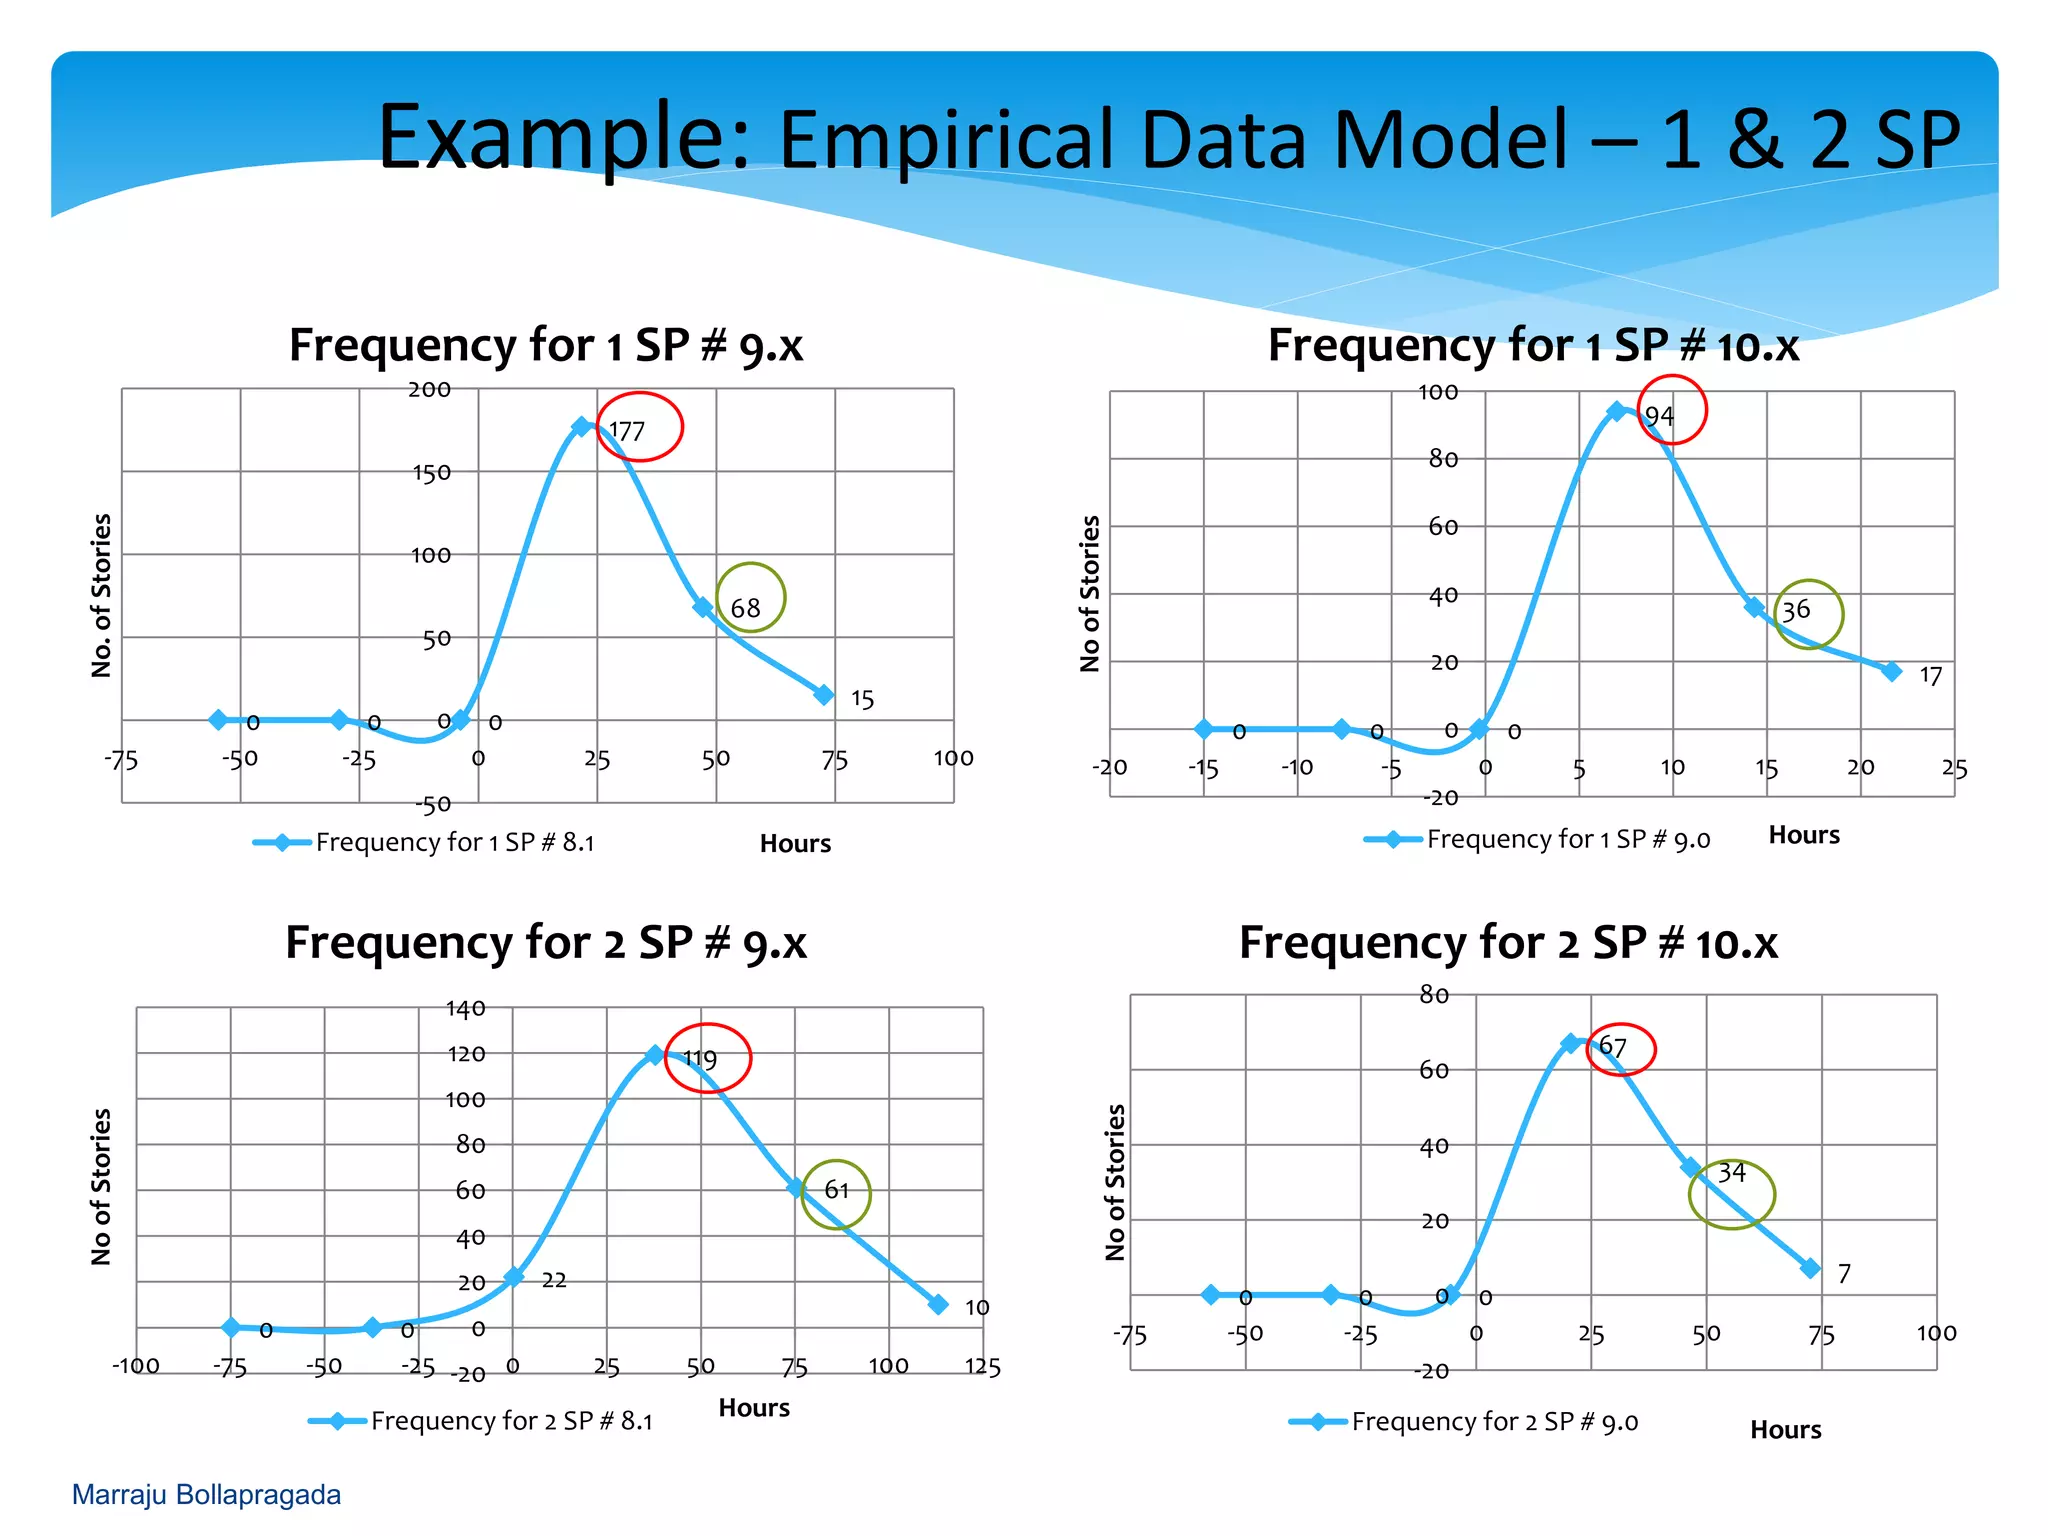
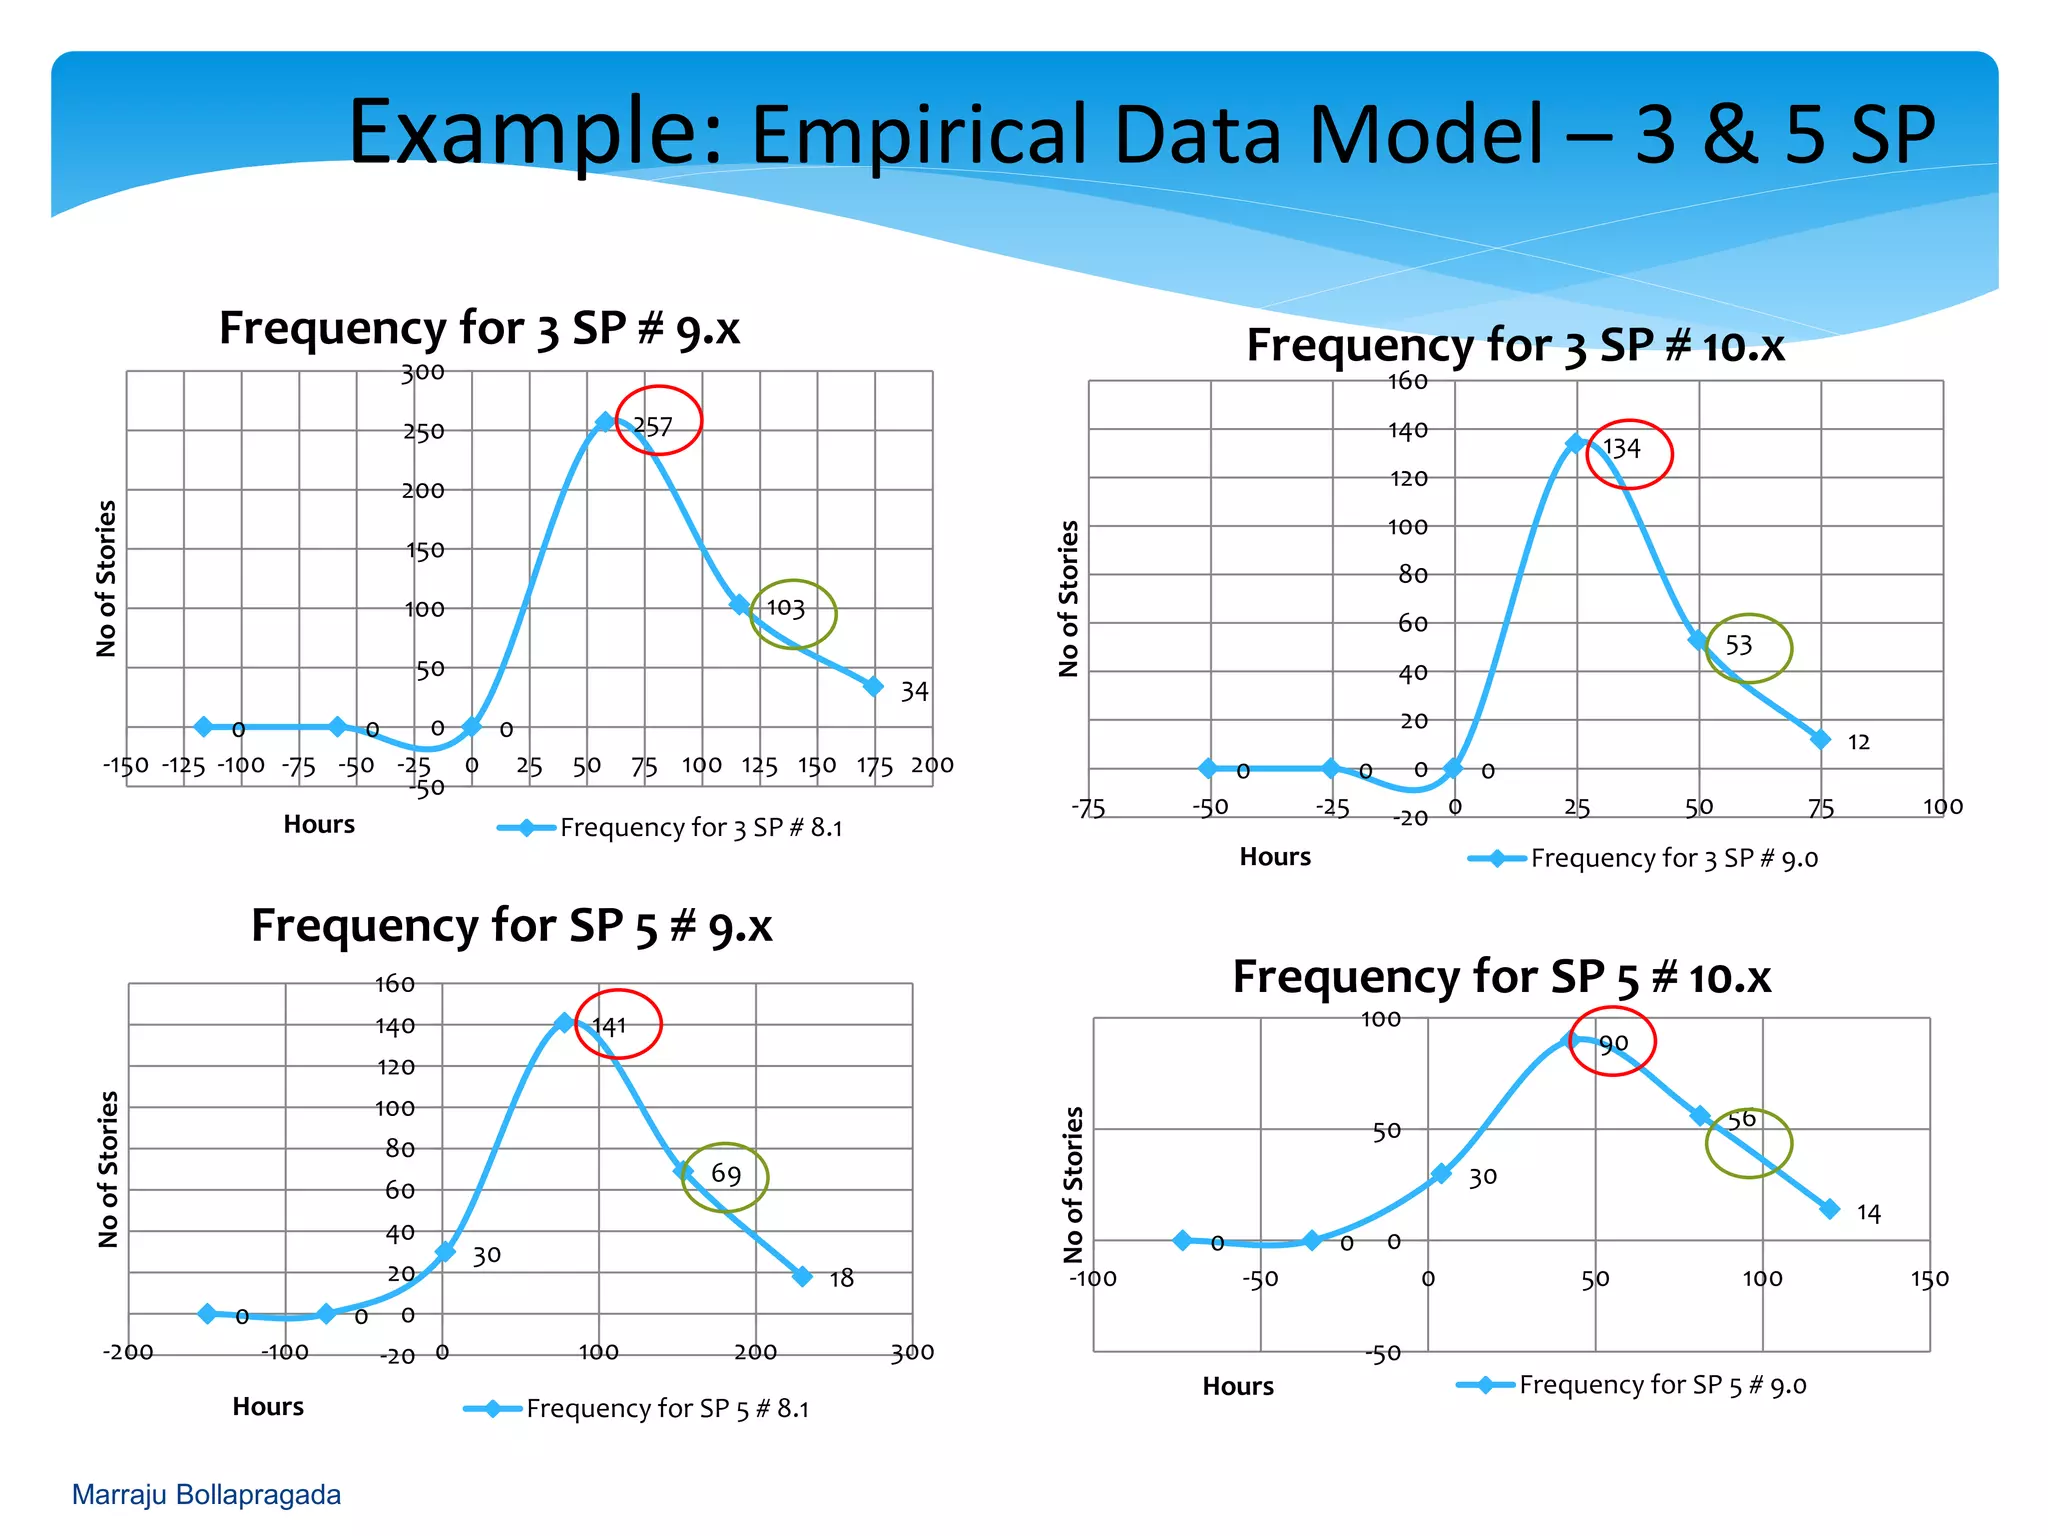
Creation of frequency histograms for completed stories to aid in mapping estimated hours.
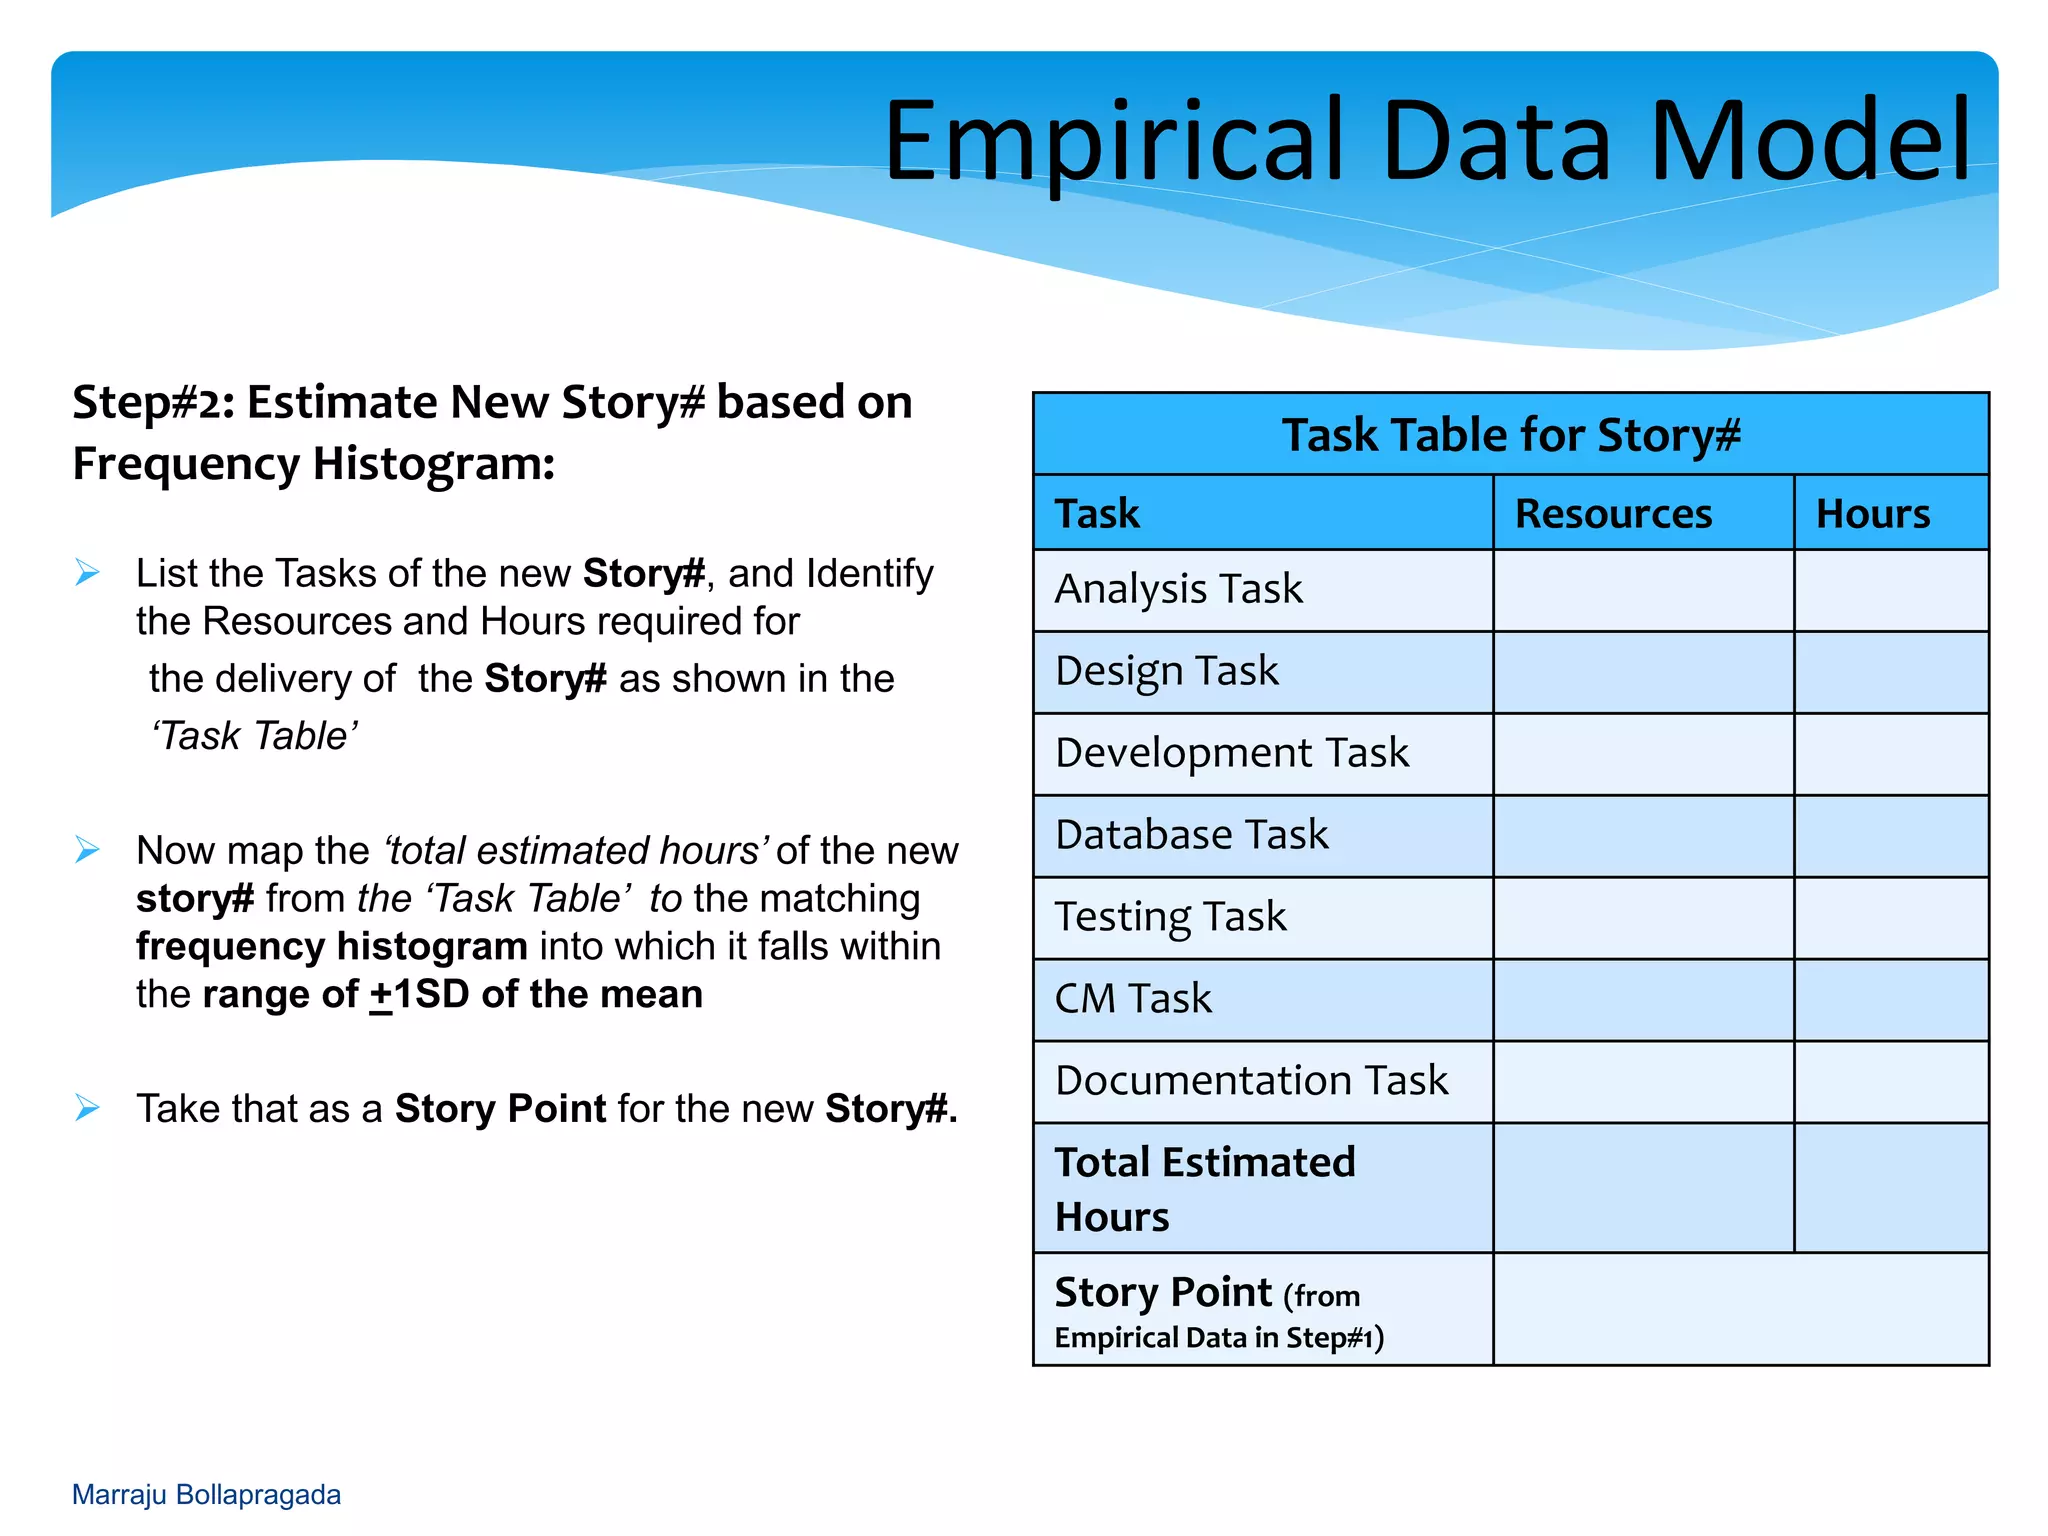
Process of estimating new stories based on mapping total estimated hours to a frequency histogram.
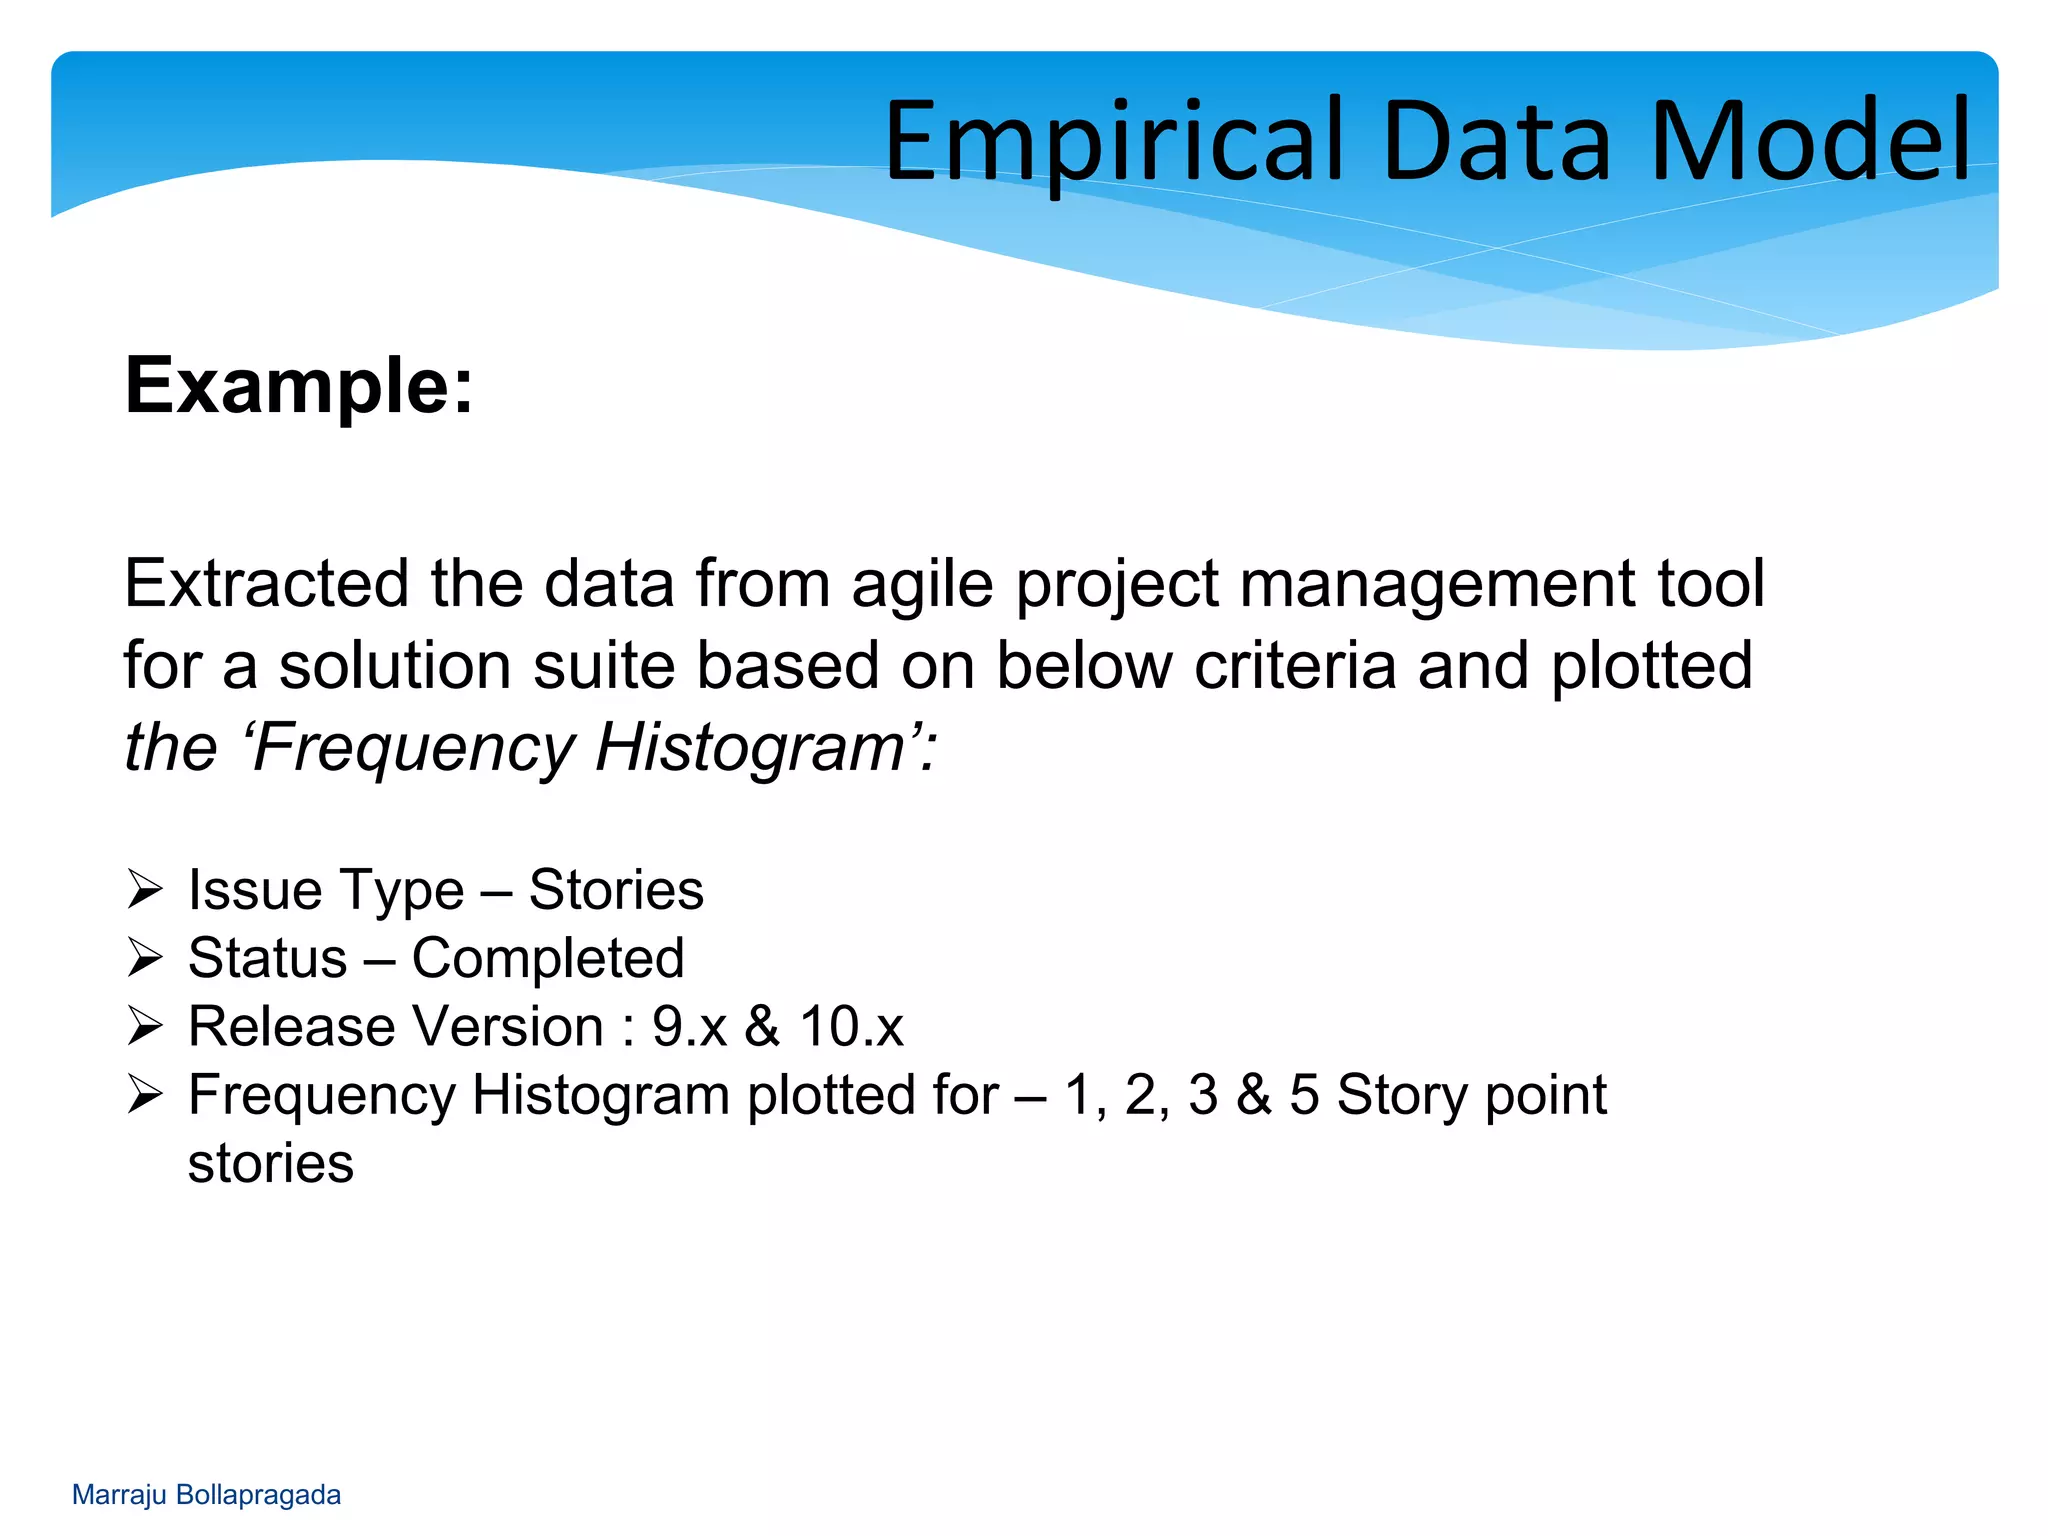
Presentation of frequency data and analysis of completed story point estimates through histograms.
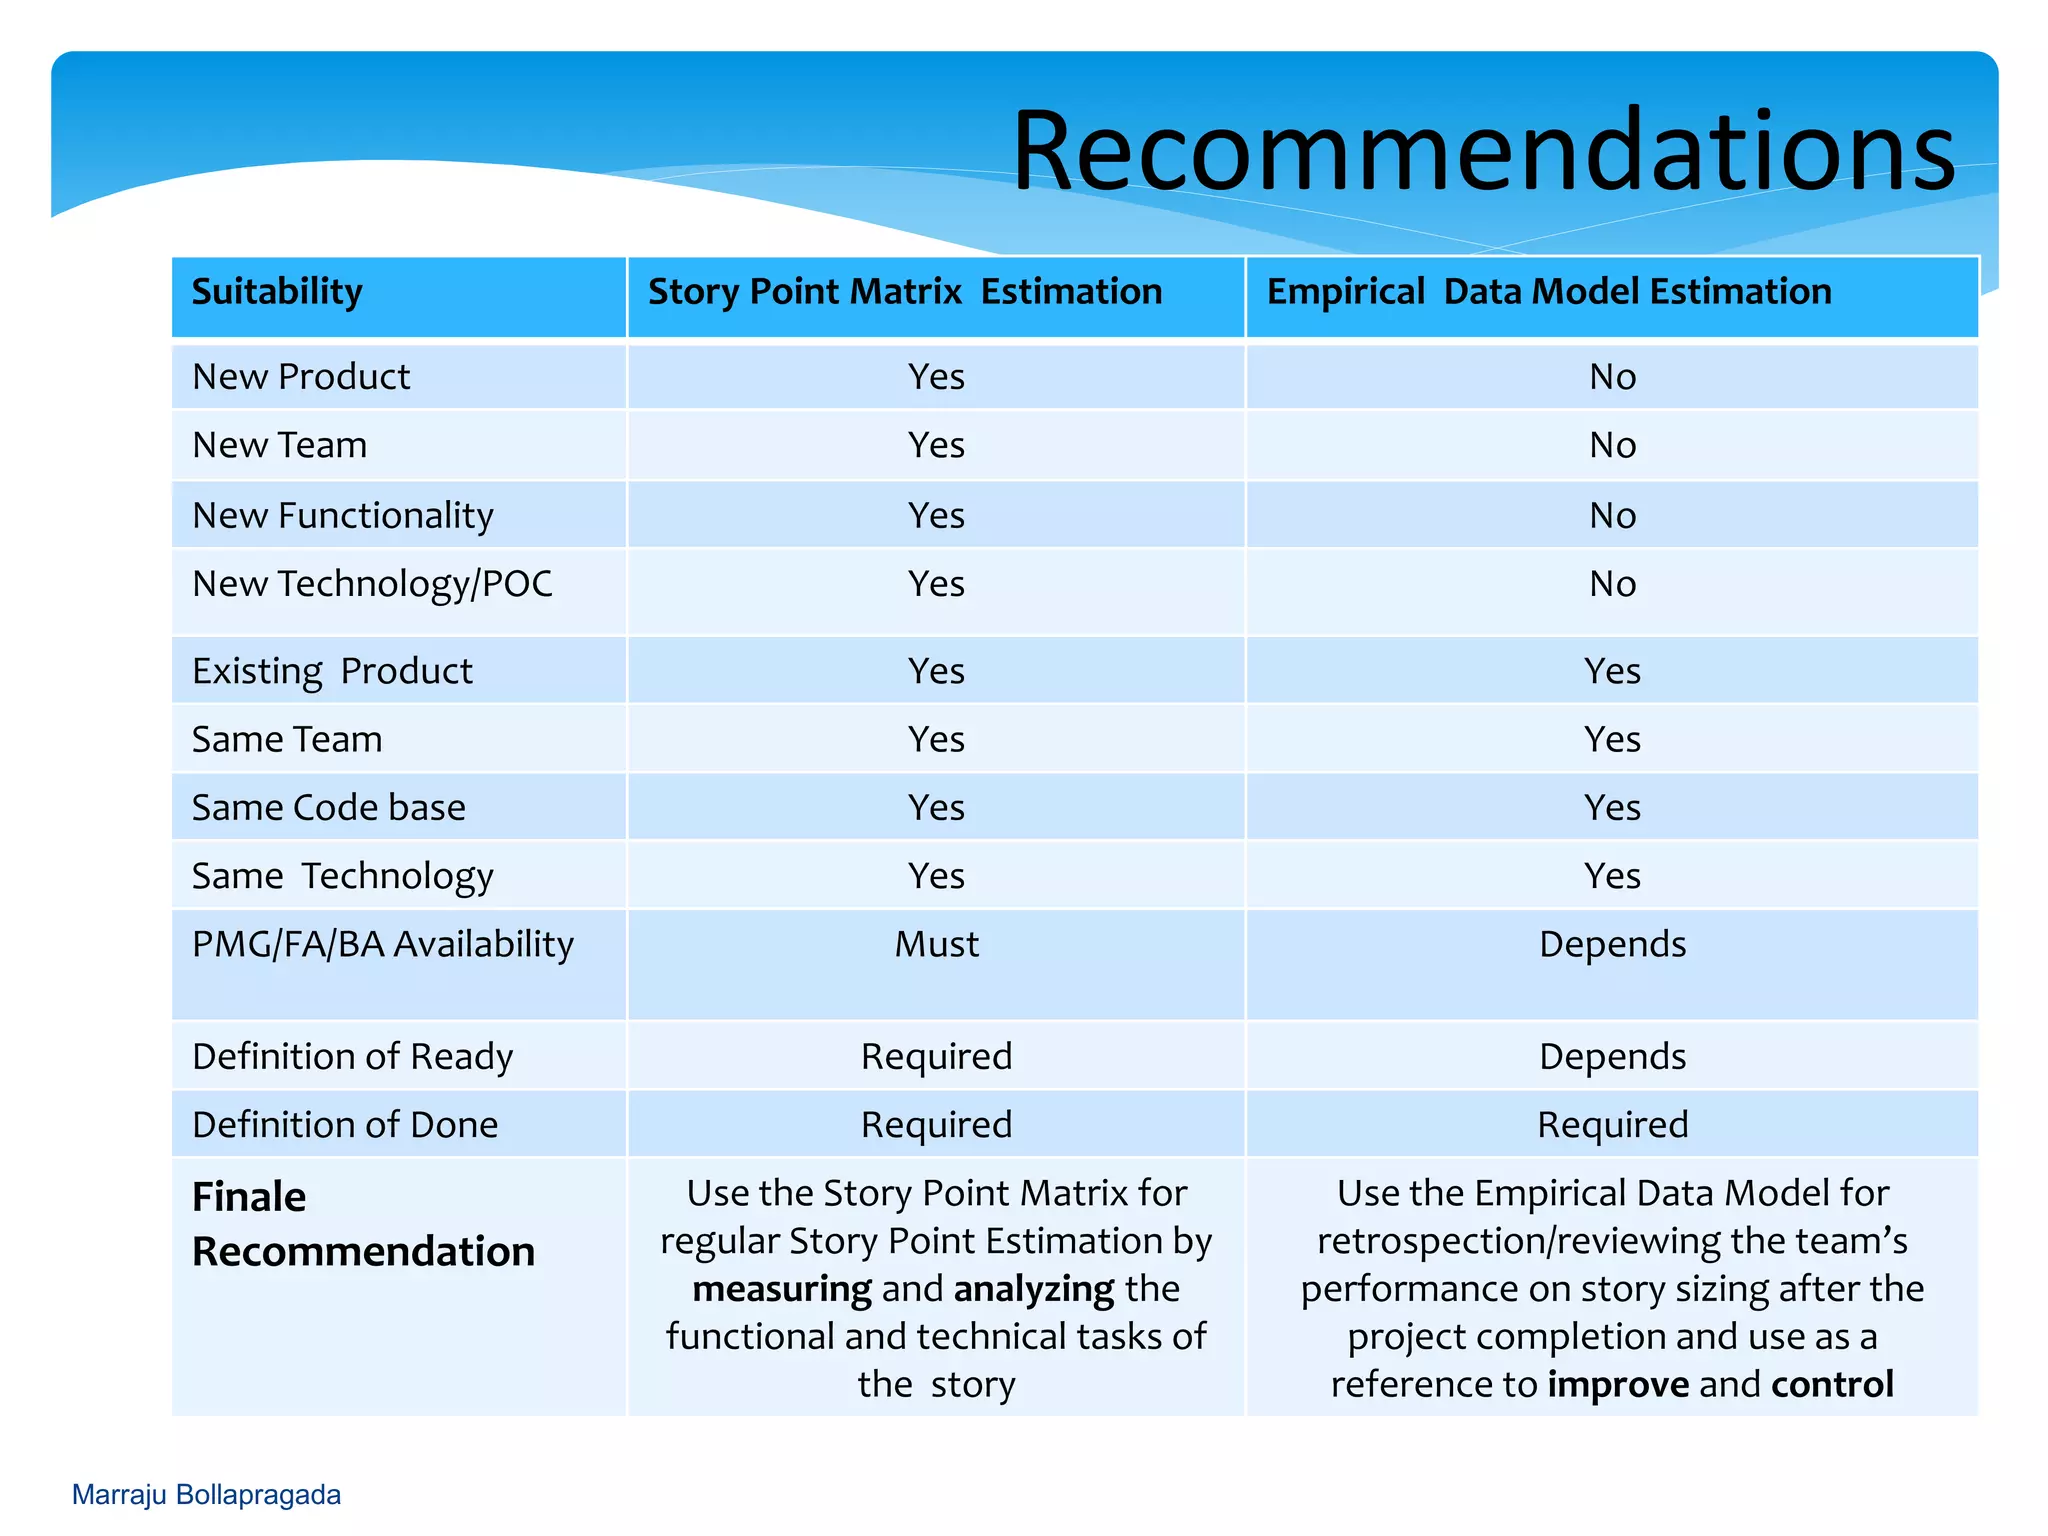
Development of a task template for estimating story points and presenting technique recommendations.
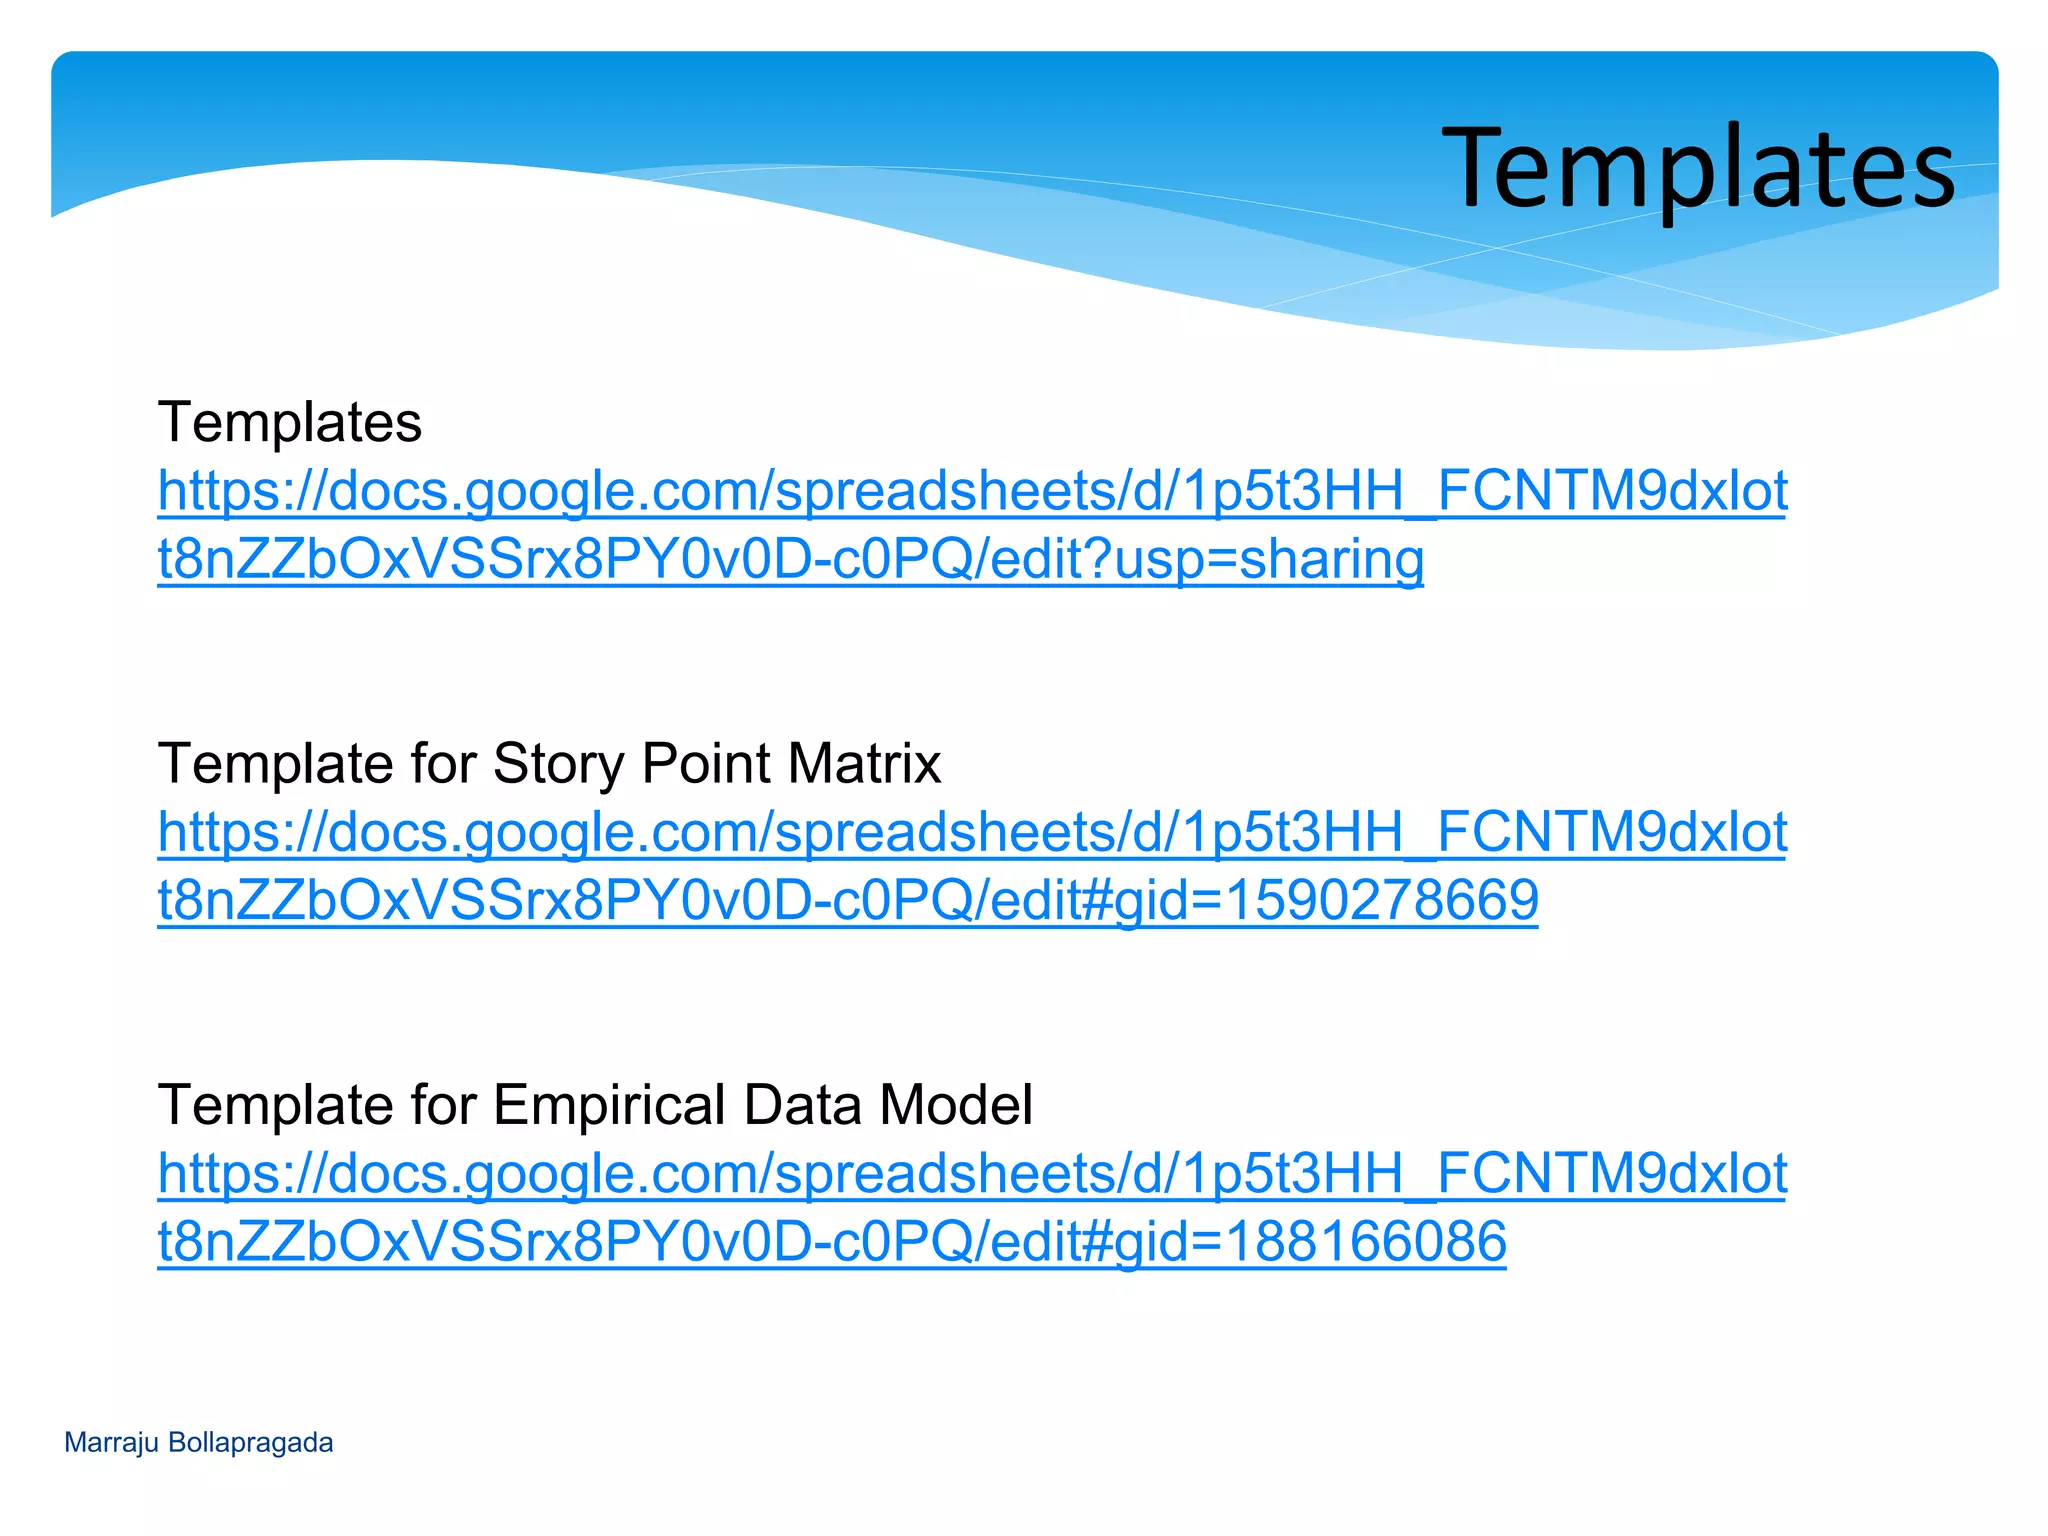
Links to templates and references for further reading on estimating story points in Agile.
Closing Q&A with contact information for follow-up.
![[HCM Scrum Breakfast] Agile estimation - Story points](https://cdn.slidesharecdn.com/ss_thumbnails/storypointsestimations-160827052054-thumbnail.jpg?width=640&height=640&fit=bounds)


