Download to read offline


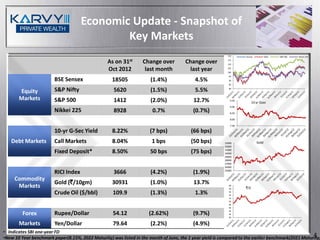
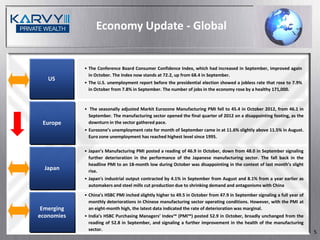
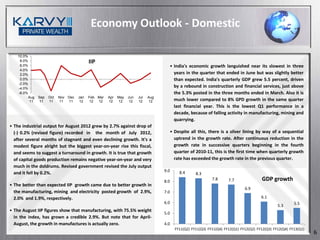
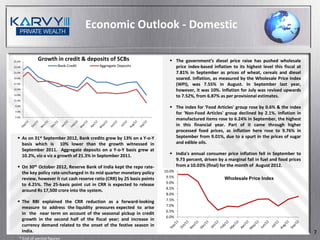


The document provides an economic and market update and outlook for November 2012. It discusses recent performance and trends in global equity markets, the Indian economy and key sectors. The overall outlook is cautiously positive. The Indian economy is seen to have bottomed out, and further monetary easing and fiscal policy actions are expected to revive growth going forward. Private sector banks are favored over public sector banks based on better Q2 results.


