
Recommended
More Related Content
What's hot
What's hot (19)
Viewers also liked
Similar to the stock market
Similar to the stock market (20)
Recently uploaded
Recently uploaded (20)
the stock market
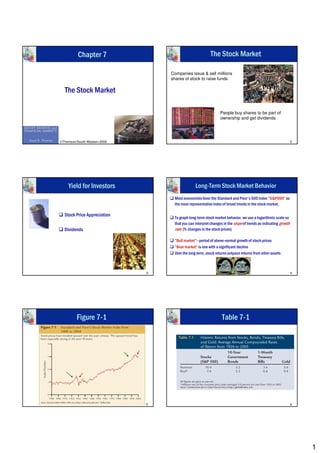
- 1. Chapter 7 The Stock Market Companies issue & sell millions shares of stock to raise funds The Stock Market People buy shares to be part of ownership and get dividends ©Thomson/South-Western 2006 1 2 Yield for Investors Long-Term Stock Market Behavior Most economists favor the Standard and Poor's 500 index “S&P500” as the most representative index of broad trends in the stock market. Stock Price Appreciation To graph long-term stock market behavior, we use a logarithmic scale so that you can interpret changes in the slope of trends as indicating growth Dividends rate (% changes in the stock prices) “Bull market”--period of above-normal growth of stock prices “Bear market” is one with a significant decline Over the long term, stock returns outpace returns from other assets 3 4 Figure 7-1 Table 7-1 5 6 1
- 2. Stock Prices as a Barometer of Economic The Connection Between Stock Prices Sentiment & Economic Activity A nation’s stock market serves as a barometer of public sentiment about the economic prospects The link between stock prices and economic performance reflects Strong performance of stock market reflects optimism about the future economy causation running in both directions (Two-Way) High public’s confidence in the Fed. Ability Low inflation, low unemployment A good economy rising stock prices: people are willing to pay higher Expectations for an economy’s performance can become detached from prices for shares of stock as companies’ sales & profits increase reality Rising stock prices good economy: boosting consumption, investment, Late 1920s and 1990s were examples of speculative “bubbles” in the U.S. stock & economic activity market Bubbles occur when stock prices are far above those warranted by economic conditions and prospects 7 8 Stock Prices & Consumption Stock Prices & Investment Higher stock prices lower cost of capital Wealth Effect Motivate companies to issue (sell) additional shares of stock Increase in stock prices increase in people’s wealth Companies get more funds make more investment People spend a portion of their increased capital gains & dividend income Investment (on new plants, equipments, technology) More Wealth Consumption/Savings Decision Capacity to produce G&S Long-term economic growth Higher Consumption Economic Expansion Employment ↑ Income ↑ Spending ↑ 9 10 Virtuous & Vicious Cycles Vicious Cycles Virtuous Cycles End of Virtuous Cycles An upward-trending stock market (increases stock prices) contributes to unforeseen shocks the capital formation process Sharp increase in oil prices Production costs ↑ Increases real economic performance Political, Military developments consumer confidence ↓ Increases capital gains people’s wealth ↑ Stock prices decline sharply Wealth ↓ Tax revenues ↑ Budget surplus ↑ , Budget deficits ↓ Spending & Investment ↓ Economic Downturn Lowers interest rates Investment & Consumption ↑ Vicious Cycles: stock prices ↓ Economy ↓ 11 12 2
- 3. Examples of Good Times Gone Bad What Determines The Price of A Share of Stock? The Present Value formula applies to stock prices, as it does to 1970s : Energy Crises any financial asset The value of a share of stock is a function of the discounted flow 1990s : Iraq’s invasion of Kuwait of payments expected PV or Price = R1 / (1 + i) + R2 / (1 + i)2 + ... + Rn / (1 + i)n 1997 : Asian Financial Crisis Where Rn = Expected payment to be received at period n For Bond, R is the coupon payments to be received by bondholders 2001 : 9/11 For Stock, R is the Dividend payments to be received by stockholders 13 14 What Determines The Price of A Share of Stock? Impact of Various Events on Stock Prices Reasons for discounting: Required rate of return Stock prices can rise based on general types of factors: Positive real interest rates (time value) those that increase the numerators (future payments expected from $ 1 today worth more in the future stocks) $ 1 to be received in the futures worth less today Investors expect co. will earn higher profits & pay more dividends Inflation those that decrease the denominators (the discount rate) Discount the $ to reflect the real purchasing power Investors expect lower inflation Risk (stocks are risky and investors are risk averse) The nation's real interest rate may decline Stocks have greater Market risk & Default risk The equity risk premium that investors require to buy stocks rather than bonds may decrease The compensation for the additional risk inherent in buying stocks rather than bonds is called the equity risk premium 15 16 Figure 7-4 3 Indicators of Stock Market Valuations 1. The price earnings ratio (P/E) : ratio of the stock share price to the current annual earnings per share Stock Price per share / Earnings per share Traditionalists believe that P/E ratios exhibit mean reversion reversion--tendency to ultimately revert to their long-term averages The 100-year average of the S&P500 stocks’ P/E is 16 Higher P/E than long-term average Stocks are overvalued 17 18 3
- 4. Figure 7-5 Indicators of Stock Market Valuations Stock Average P/E This year’s P/E (over 10 years) CPF 33.20 48.86 THAI 13.15 10.20 KBANK 14.48 12.96 PTT 9.62 11.55 19 20 Indicators of Stock Market Valuations Indicators of Stock Market Valuations 2. The dividend yield 3. The price-to-book ratio The annual dividend per share expressed as a percentage of the current The ratio of the price of a share of stock to the book value of the company price of the stock Price of a share of stock = Market Value, reflect investors DY = Dividend per share / stock price expectation/demand Low DY indicates high stock price Stocks are overvalued Book value = accounting value, residual value, value of the co. after liquidating all assets and paying all debts Higher PB indicates higher stock price Stocks are overvalued Stock 10- 10-year Average DY This year’s DY CM 5.22% 7.63% 21 22 Indicators of Stock Market Valuations Stock Price P/E P/BV Dvd Yield (%) TRUBB STA TLUXE LEE UPOIC RANCH CM CPF 23 4