- The Indian equity market rose slightly over the week, aided by falling crude oil prices and recovery in the rupee. Volatility increased due to political issues in Italy and trade war fears. Telecom and oil & gas sectors saw gains while infrastructure, realty, and pharma declined.
- The 10-year Indian government bond yield increased sharply by 11 basis points to 7.84% due to higher than expected GDP growth and inflation numbers.
- Key economic indicators included 7.7% GDP growth in Q4, 4.58% CPI inflation in April, and 12.65% growth in credit in May. The RBI's monetary policy meeting on June 6th is expected to take a h
Stock Market Technical Analysis, Stock/Share Trading.Get the latest stock technical analysis of stock/share trends, BSE/NSE technical chart, live market map and more technical stock information at Capitalheight
Benchmarks end flat on weak European cues...Bharti disappoints:
Tracking global cues, the markets started in green for third consecutive day. Better corporate earnings from U.S. instilled investor
confidence in the economy and fueled the U.S. and Asian stock rally. However profit booking, negative cues from European peers and
poor Bharti Q1 show dragged the markets towards the end from intraday high to close flat.
The World This Week - 03rd Aug to 08th Aug, 2015
As expected rates were kept unchanged in the RBI credit policy last week but the tone of the policy along with macro economic factors suggest that there could be a chance of rate cut in the next credit policy which is due on 29th September or even before that. The only concern is distribution of monsoon which is very uneven so if monsoon plays out properly then the rates may be cut. The change witnessed from previous credit policy to this one is the probability of another rate cut happening in this calendar year has increased from 50% to 75%. There would be certain consequences of a rate cut. Sectors which would benefit are stable businesses like Auto, Private Banks, and NBFC etc. Sectors like infrastructure, manufacturing, high capital intensive business which are facing problems of raising capital, inadequate profitability etc would still struggle despite a rate cut. Know
CapitalStars Award Winning,SEBI registered investment advisory company.We provide intraday & positional services in equity,derivative ,commodity & currency
equity trading is the buying and selling of company stock shares. Shares in large publicly traded companies are bought and sold through one of the major stock exchanges, such as the New York Stock Exchange and the London Stock Exchange, which serve as managed auctions for stock trades.
Nifty futures are index futures where the underlying is the S&P CNX Nifty index. In India, index futures trading commenced in 2000 on the National Stock Exchange (NSE).
CapitalStars Award Winning,SEBI registered investment advisory company.We provide intraday & positional services in equity,derivative ,commodity & currency
Equity View:
Markets are moving into earnings season and initial results of few corporate entities seem good enough,
starting with Indusind Bank followed by Infosys. The numbers of these companies were expected to come
out well thus this outcome is not surprising from sectors like Private Sector Banks, IT, FMCG and Pharma
which are expected to perform well. There are few sectors like Capital Goods, Public Sector Banks and old
Infra Companies which can show subdued results. We expect domestic factors like government policies
to drive the market in absence of global cues. IIP data is set to come out today and is expected to be flat;
Inflation is also expected to be higher due to base effect.
Real estate markets have a cycle of around 5 – 7 years thus an off-take seems distant, however buying
could initiate after 2 – 3 years. A rate cut acts as a catalyst but it cannot help in a sudden pick-up of
demand.
There is always a trend and a counter trend in the movement of an asset class. We need to see the long
term trend. In commodities there is bearish long term trend so counter trend is bullish and thus,
currently we are seeing a counter trend in this asset. Similarly, if we have a bullish long term trend for
equity markets then from time to time there would be correction which is also happening now and this is
known as counter trend. The incremental savings of the government can either be used in the form of an
investment, subsidies or 7th Pay commission arrears. This definitely leads to correction in equity markets
but it doesn’t lead to bearish phase. If everyone is hopeful about the turnaround of Indian story and
economic revival then no one exits completely from the stock markets. Larger expectations are that
investments will certainly pick up and we all are hopeful about it.
News:
DOMESTIC MACRO:
Indirect tax collection rose 35.8% to over Rs. 3.24 lakh crore in the first half of the current fiscal.
Indirect tax collection in the period from April to September in the last fiscal stood at about Rs.
2.38 lakh crore.
The International Monetary Fund (IMF) in its latest World Economic Outlook has lowered India’s
growth forecast for FY16 to 7.3% from its July forecast of 7.5%. Growth is expected to bounce back
to 7.5% in 2016-17 on the back of reforms, pick-up in investments and lower commodity prices.
The Reserve Bank of India (RBI) will be increasing the investment limit for Foreign Portfolio
Investors (FPIs) in Government Securities to Rs. 1,79,500 crore by January 1 from the existing Rs.
1,53,500 crore.
The Cabinet approves a Railway Ministry proposal to pay bonus equivalent to 78 days’ pay, with a wage
ceiling of Rs 3500 a month.
This week RBI policy will be announced expectation for the same has been muted; mostly RBI would maintain the
status quo right before onset of the monsoon. RBI would not cut rate primarily because CPI has started inching up
both ways in absolute terms and in its contribution to WPI, RBI’s decision will be impending until how monsoon
and CPI panes out . So the policy would remain flat.
Earnings have been marginally better than expectation, Certain quarters people expected good results from PSU
banks but it did not happen, apart from this results specially from IT, FMCG, Consumer durable and Auto was
surprising and expectations are that this trend would continue for some time.
We have well expert business analyst team, which provide you tips in intraday futures tips, intraday stock tips, stock futures tips with minimum investment.
http://www.capitalstars.com/intraday-stock-tips/
CapitalStars Award Winning,SEBI registered investment advisory company.We provide intraday & positional services in equity,derivative ,commodity & currency
Introduction of GST in the Rajya Sabha has significance because it could have been passed in the Lok Sabha also. However, Rajya Sabha is where the government does not have majority and since it’s a constitutional amendment that requires two thirds majority, convincing all the parties is a key milestone and to that extent, introduction and subsequent passage of the bill in the Rajya Sabha will be important.
•Earnings Data for 8 core industries including mining, infrastructure and electricity was received which indicated a growth by 5.2% which augers well. However, one needs to see if this is a onetime occurrence or will it continue. Also, since rainfall was moderate, by the end of July, rural consumption is expected to be strong. To that extent, GDP is likely to grow anywhere between 7.5-8% this year. The government’s earlier projections in the budget carry an upward bias.
Dear Investors,
The month of July has seen the heavens literally open their doors and shower their blessings on us. After a late start in June, the monsoon picked up
smartly and the country as a whole received abundant rainfall, bringing cheer to one and all and definitely a sense of relief. The same good cheer
seems to have percolated to the global equity markets as well. Having brushed off the Brexit issue, markets have continued their upward move
relentlessly through the month of July. The US benchmark index, the S&P 500 hit a new lifetime high earlier in the month on the back of good jobs
data and an optimistic view of growth in the US economy. Not wanting to be left out in any way, the Nifty set a new 52-week high and the Sensex
scaled 28,000.
The quarterly results have been a mixed bag so far. While there have been more hits than misses, the IT sector as a whole and some pharma
companies have been the major pockets of underperformance. Most of the private sector retail banks and NBFCs have shown a stellar performance,
while growth in public sector banks was stagnant due to liquidity and NPA issues. In the consumer space, lower costs have added to the profits of
several companies, but revenue growth and volume growth were disappointing. There is hope that these will see a significant pick up in the second
half of the financial year once the benefits of the 7th Pay Commission and a good monsoon kick in.
Snam 2023-27 Industrial Plan - Financial Presentation
The world this week 1st june
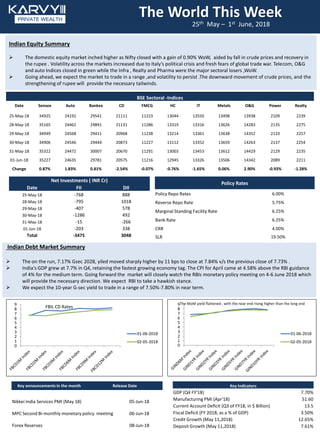
1. The World This Week
25th May – 1st June, 2018
Policy Rates
Policy Repo Rates 6.00%
Reverse Repo Rate 5.75%
Marginal Standing Facility Rate 6.25%
Bank Rate 6.25%
CRR 4.00%
SLR 19.50%
Indian Equity Summary
The domestic equity market inched higher as Nifty closed with a gain of 0.90% WoW, aided by fall in crude prices and recovery in
the rupee . Volatility across the markets increased due to Italy’s political crisis and fresh fears of global trade war. Telecom, O&G
and auto Indices closed in green while the Infra , Realty and Pharma were the major sectoral losers ,WoW.
Going ahead, we expect the market to trade in a range ,and volatility to persist .The downward movement of crude prices, and the
strengthening of rupee will provide the necessary tailwinds.
Indian Debt Market Summary
The on the run, 7.17% Gsec 2028, yiled moved sharply higher by 11 bps to close at 7.84% v/s the previous close of 7.73% .
India's GDP grew at 7.7% in Q4, retaining the fastest growing economy tag. The CPI for April came at 4.58% above the RBI guidance
of 4% for the medium term. Going forward the market will closely watch the RBIs monetary policy meeting on 4-6 June 2018 which
will provide the necessary direction. We expect RBI to take a hawkish stance.
We expect the 10-year G-sec yield to trade in a range of 7.50%-7.80% in near term.
Key announcements in the month Release Date
Nikkei India Services PMI (May 18) 05‐Jun‐18
MPC Second Bi‐monthly monetary policy meeting 06‐Jun‐18
Forex Reserves 08‐Jun‐18
BSE Sectoral -Indices
Date Sensex Auto Bankex CD FMCG HC IT Metals O&G Power Realty
25-May-18 34925 24192 29541 21111 11223 13044 13550 13498 13938 2109 2239
28-May-18 35165 24462 29891 21131 11286 13319 13316 13626 14283 2135 2275
29-May-18 34949 24568 29411 20968 11238 13214 13361 13638 14352 2133 2257
30-May-18 34906 24546 29444 20873 11227 13112 13352 13659 14263 2137 2254
31-May-18 35322 24472 30007 20670 11291 13003 13453 13612 14429 2129 2235
01-Jun-18 35227 24635 29781 20575 11216 12945 13326 13506 14342 2089 2211
Change 0.87% 1.83% 0.81% -2.54% -0.07% -0.76% -1.65% 0.06% 2.90% -0.93% -1.28%
Net Investments ( INR Cr)
Date FII DII
25-May-18 -768 888
28-May-18 -795 1018
29-May-18 -407 578
30-May-18 -1286 492
31-May-18 -15 -266
01-Jun-18 -203 338
Total -3475 3048
Key Indicators
GDP (Q4 FY'18) 7.70%
Manufacturing PMI (Apr'18) 51.60
Current Account Deficit (Q3 of FY18, in $ Billion) 13.5
Fiscal Deficit (FY 2018, as a % of GDP) 3.50%
Credit Growth (May 11,2018) 12.65%
Deposit Growth (May 11,2018) 7.61%
The MoM yield flattened , with the near end rising higher than the long end
FBIL CD Rates
0
1
2
3
4
5
6
7
8
9
01-06-2018
02-05-2018
0
1
2
3
4
5
6
7
8
9
01-06-2018
02-05-2018
2. Domestic News
The growth rate of eight core sectors, which also include fertilisers and steel, was 2.6 per cent in April 2017 . The Nikkei
manufacturing Purchasing Managers' Index, or PMI, fell to 51.2 in May from 51.6 in April.
Idea Cellular completes sale of 9,900 standalone towers to ATC for Rs .4,000cr.
Maruti Suzuki targets to sell over two lakh automatic cars in 2018-19.
Government increases its stake in IDBI Bank by 5% by acquiring 109.7 crore shares to 85.96%.
RCom settles Ericsson row prompting a halt on insolvency process.
International News
The UK manufacturing Purchasing Managers' Index rose unexpectedly to 54.4 in May from a 17-month low of 53.9 in April.
The manufacturing sector in Japan continued to expand in May with a manufacturing PMI score of 52.8, although down from 53.8 in
April
Capital spending in Japan was up 3.4 percent in the first quarter of 2018. That exceeded expectations for 3.1 percent but slowed
from 4.3 percent in the three months prior.
China's Caixin Purchasing Managers' Index remained unchanged at 51.1 in May.
Source:
Reuters, NSDL, FIMMDA, CARE,RBI, MCX SX, BSE, NSE, Bloomberg, Business Standard, Economic Times
Abbreviations:
FII (Foreign Institution Investors), PMI Purchasing Manager index WPI (Wholesale Price Index), P/E (Price/Earnings ratio), CP (Commercial Papers), G-
sec (Government Securities), MTD – Month to Date, YTD – Year to Date
Disclaimer
The information and views presented here are prepared by Karvy Private Wealth (a division of Karvy Stock Broking Limited) or other Karvy Group companies.
The information contained herein is based upon sources that we consider reliable. We, however, do not vouch for the accuracy or the completeness thereof. This
material is for personal information and we are not responsible for any loss incurred based upon it. Karvy Private Wealth is only a distributor of securities and
financial market products
Investment in securities market are subject to market risks, read all the related documents carefully before investing. The investments discussed or
recommended here may not be suitable for all investors. Investors must make their own investment decisions based on their specific investment objectives and
financial position and using such independent advice, as they believe necessary. The securities quoted are exemplary and are not recommendatory While acting
upon any information or analysis mentioned here, investors may please note that neither Karvy nor any person connected with any associated companies of
Karvy accepts any liability arising from the use of this information and views mentioned here.
The author, directors and other employees of Karvy and its affiliates may hold long or short positions in the above-mentioned companies from time to time.
Every employee of Karvy and its associated companies are required to disclose their individual stock holdings and details of trades, if any, that they undertake.
The team rendering corporate analysis and investment recommendations are restricted in purchasing/selling of shares or other securities till such a time this
recommendation has either been displayed or has been forwarded to clients of Karvy. All employees are further restricted to place orders only through Karvy
Stock Broking Ltd
Representations made about the performance or activities are not indicative of future results. The information given in this video on tax is for guidance only,
and should not be construed as tax advice. Investors are advised to consult their respective tax advisers to understand the specific tax incidence applicable to
them. We also expect significant changes in the tax laws once the new Direct Tax Code is in force – this could change the applicability and incidence of tax on
investments
Karvy Private Wealth (A division of Karvy Stock Broking Limited) operates from within India and is subject to Indian regulations.
Karvy Stock Broking Ltd. is a SEBI registered stock broker, depository participant having its offices at:
702, Hallmark Business plaza, Sant Dnyaneshwar Marg, Bandra (East), off Bandra Kurla Complex, Mumbai 400 051 .
(Registered office Address: KARVY CENTRE, 8-2-609/K, AVENUE 4, STREET NO.1, BANJARA HILLS, HYDERABAD-500034)
SEBI registration No’s:”NSE(CM):INB230770138, NSE(F&O): INF230770138, BSE: INB010770130, BSE(F&O): INF010770131,NCDEX(00236,
NSE(CDS):INE230770138, MSEI: Registration number INE 260770138NSDL and CDSL – SEBI Registration No: IN-DP-175-2015PMS Registration No.:
INP000001512,
Commodities and Currency
Date USD /INR GBP /INR EURO /INR YEN/INR
Crude Gold
(USD/ BBL) (USD/ozt)
25-May-18 67.77 90.42 79.28 0.619 76.44 1302.25
28-May-18 67.43 89.78 78.46 0.616 75.30 1299.04
29-May-18 67.87 89.92 78.33 0.623 75.39 1298.77
30-May-18 67.44 89.57 78.44 0.620 77.50 1301.38
31-May-18 67.41 89.89 78.83 0.620 77.59 1298.51
01-Jun-18 67.06 89.34 78.47 0.614 76.79 1293.40
Change -1.04% -1.19% -1.02% -0.78% 0.46% -0.68%