The portfolio manager provides a summary of market performance in 2012, an outlook for 2013, and commentary on portfolio strategy. Key points include: global markets gained over 10% in 2012 despite concerns over Europe and the US fiscal cliff; volatility is expected to continue in 2013 due to unresolved debt issues; the portfolio is diversified across regions and maintains an appropriate level of risk for clients through its asset allocation model.
It has been seven years since the last financial crisis. In that seven-year period, the total global debt has increased by even more than it did in the seven years previous (2000-2007). From the end of 2007 through to the end of the first half of last year, total global debt increased by 40%, or $US 57 TRILLION! This massive increase in debt has been a consequence of easy money in a low interest rate environment aided and abetted by programs of quantitative easing (the provision of liquidity by central banks) in order to promote economic growth and investment.
The first quarter managed to record some positive results overall, despite severe declines in some sectors.
THIRD QUARTER 2015 RETROSPECTIVE AND PROSPECTIVE We’ve Seen This Movie BeforeRobert Champion
Global markets remained in turmoil as concerns regarding the global economy persisted. While much of the international focus was centred around the slowing economy in China, there were few places that investors could hide as even cash, paying little to negative interest in some parts of the world, was a relative winner in the quarter.
“Anyone who lives within their means suffers from a lack of imagination.”- Oscar Wilde
It all seemed so easy. The elixir of low interest rates and successive rounds of quantitative easing by the central banks created an environment wherein stock and real estate prices have risen, private equity and credit deals proliferated, corporations lowered their cost of capital with low rates and sub-prime borrowers regained access to capital. Until this quarter, investors were content to drink this elixir as markets steadily climbed out of the depths from 2008. The politicians taking credit and the central bankers implementing these policies cannot be accused of a lack of imagination.
It didn’t go the way the pundits predicted. As the second quarter came to a close, people in the UK voted to exit (Brexit) the European Union by a narrow margin. Despite the narrow differences in the polls, global markets and the mainstream press indicated that the opposite outcome would prevail in the days leading up to the vote.
Investors hate uncertainty. The immediate reaction to the Brexit vote was severe and negative. However, stocks recovered to a great extent over the following week.
With various vaccinations becoming widely available, it was just a matter of when, and not if, global markets will get back on their feet. But fast forward to the middle of the year, and a lot of economies are still in doubt as to whether a full relaxation of measures will take place by the end of the year.
Orbex quarterly reports are a holy grail for traders everywhere, providing invaluable fundamental and technical insights delivered by a seasoned research team.
With investor sentiment now showing signs of improvement after a challenging period in emerging markets, our sixth edition of the CSRI Emerging Consumer Survey provides investors timely insights with which to revisit the theme of a fast developing consumer culture shaped by technological innovation. The countries that top our ECS Scorecard are India, China and Saudi Arabia with a key demographic accent on the role of the youthful consumer.
- Download the full report: http://bit.ly/1YnhtyR
- Order hard copy: http://bit.ly/1RQb79r
- Visit the website: bit.ly/18Cxa0p
The euphoria of the past year carried into the first quarter of 2014 only to be rudely interrupted by geopolitical events as Russia took over the Crimea. The hue and outcry was heard around the world and global markets were shaken by this event.
THIRD QUARTER 2016
RETROSPECTIVE AND PROSPECTIVE
And The Band Played On…
“When democratic governments create economic calamity, free markets get the blame.”-Jack Kemp
“Politicians and diapers must be changed often, and for the same reason.”- Mark Twain
Thus far, the calamities predicted by the pundits that would result from the Brexit vote to leave the European Union have not been as severe as anticipated. Perhaps this is due to the building geopolitical and economic stresses that have diverted the focus from Brexit to other issues. Furthermore, the impact of Brexit will likely take some time to discern as the trade, migration, political and other ramifications evolve over the coming months and years. Meanwhile, governments globally continue in their efforts to stimulate economic growth with what appears to be diminishing results.
2017 T. Rowe Price Global Economic OutlookT. Rowe Price
Our Chief U.S. Economist, Alan Levenson, discusses his perspective on the current global economic environment and what investors could expect to see in 2017.
Geopolitical events continued to make headlines this quarter but did little to quell investors’ enthusiasm as markets continued to advance. Russia and the Ukraine managed to agree to a temporary ceasefire just as sectarian violence in Iraq exploded driving oil prices higher. China garnered attention with its hegemonic designs on the South China Sea much to the displeasure of Japan and Vietnam as well as pushing back on any pro-democracy desires in Hong Kong. In addition, Argentina once again threatens to default on its debt after losing a Supreme Court decision to creditors in the US.
2017 Market Outlook - Emerging Markets DebtT. Rowe Price
Portfolio Manager Samy Muaddi, CFA, discusses his perspective on the current emerging markets debt environment and what investors could expect to see in 2017.
2017 Market Outlook - Global Fixed IncomeT. Rowe Price
Portfolio Manager Quentin Fitzsimmons discusses his perspective on the current global fixed income environment and what investors could expect to see in 2017.
Capital Markets Industry Insights - Q1 2016Duff & Phelps
Prospective middle-market issuers are being greeted with robust demand from both traditional private credit investors and crossover public market participants. While monetary policy concerns weighed heavily on market participants for much of the first quarter, the Fed’s more dovish posture of recent weeks has triggered an increase in risk appetite across the credit markets.
2017 Market Outlook - International Equity T. Rowe Price
Our Head of International Equity, Chris Alderson, discusses his perspective on the current global equity environment and what investors could expect to see in 2017.
Discover the power of belonging along with proven marketing strategies to promote brand awareness and improve results. Said Aghil Baaghil, a marketing expert who has promoted innovative methods throughout the Persian Gulf Region and beyond, explains how developing a personal relationship with consumers can help your brand and business.
Using real examples, you’ll fi nd out how some of the most successful companies have used the fi ve human senses to emphasize the power of
belonging.
Find out how this powerful approach can also work for you and your company. Along the way, you’ll learn how to build a sustainable brand as well as strategies that will give your product and/or service a better chance to belong.
No bubble trouble; stocks are still reasonably priced. This credit cycle has unique characteristics that continue to make high-yield bonds attractive. Interest-rate volatility poses greater risk than higher rates themselves.
Ideas:
-Get away from the U.S. bias - think tactical globally
-Keep an eye on USD / Oil / China / Earnings
-Europe is cheap and growth potential creates opportunities
-Japan: both hedged and unhedged opportunities to explore
-Global consumer markets: credit space and EM consumer markets
Through all the market traumas of recent years, the crises in Greece, slowdown scares in China, US political gridlock, the collapse in oil prices, the wars and the migrant flows, investors prepared to weather short-term volatility have seen handsome returns on developed-economy equities since the depths of the financial crisis in 2008, with EUR and USD investors seeing only one modestly down year in 2011. There has also been good performance from high yield and investment grade corporate bonds, the laggards (since 2011) being investments connected to commodities and emerging markets.
Our analysis, set out in this Outlook, suggests that 2016 may deliver a fairly similar pattern. Temporary traumas could emanate from Federal Reserve tightening, reduced bond liquidity, renewed growth scares in China or geopolitics, but behind these is an underlying picture of ongoing expansion. The global economy is neither pushed up against capacity limits nor facing severe slack (except for commodities and energy), banking systems are healthy and debt levels seem more amber than red. Rapid growth seems unlikely, given aging populations (bar Africa and India) and sharing economy technologies that do not generate much Gross Domestic Product, but sensibly-priced assets do not need a booming economy to generate reasonable returns. At the time of writing (in late 2015), high yield and investment grade credits have spreads just above their quarter-century averages, giving them scope to weather gradual Fed tightening. Developed equities have valuations somewhat above historic norms on a price-earnings basis, but not on a price-book basis, and operational leverage (especially in the Eurozone) and consolidating oil prices should allow earnings growth to move from last year's negatives into the mid- to high-single digits. In short, we think developed equities and credits are well placed for another year of reasonable returns, with the dollar likely to be strong again as the Fed leads the monetary cycle. As for emerging markets, and the commodities on which many depend, a convincing general recovery looks some time away, but there is scope for some to move ahead of the pack, as discussed in a special article.
Of course there can always be risks that are not visible and Fed tightening has a habit of teasing these out, although usually not within its first year. But, equally, there could be upside surprises, if the USA finally moves toward solutions on taxing repatriated corporate cash and infrastructure spending or, more simply, the signals of rising confidence already visible in US and European consumer surveys translate into faster spending. We trust our readers will find the Investment Outlook 2016 to be of considerable interest for the coming year.
Pacific Asset Management is sub-advisor to the AdvisorShares Pacific Asset Enhanced Floating Rate ETF (FLRT)*
2014 has seen the consensus of higher Treasury yields and economic activity fail to materialize. Lower rates and risk premiums have led to strong returns year-to-date. In this commentary, Portfolio Managers David Weismiller, Michael Marzouk, and Bob Boyd discuss the current market environment, outlook, and portfolio positioning.
*Effective but not available for sale at this time. Go to www.advisorshares.com for more information.
Similar to Brent woyat q4 2012 pimg commentary jan2013 (20)
1. OceanForest Investment Partners
Portfolio Managers Commentary – Q2 2012
Q4
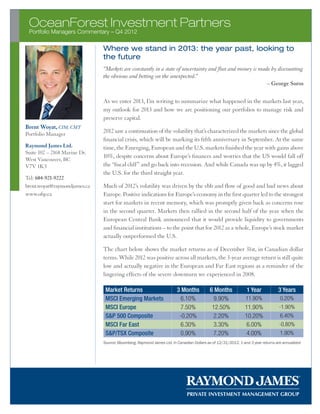
Where we stand in 2013: the year past, looking to
the future
“Markets are constantly in a state of uncertainty and flux and money is made by discounting
the obvious and betting on the unexpected.”
– George Soros
As we enter 2013, I’m writing to summarize what happened in the markets last year,
my outlook for 2013 and how we are positioning our portfolios to manage risk and
preserve capital.
Brent Woyat, CIM, CMT
Portfolio Manager
2012 saw a continuation of the volatility that’s characterized the markets since the global
financial crisis, which will be marking its fifth anniversary in September. At the same
Raymond James Ltd. time, the Emerging, European and the U.S. markets finished the year with gains above
Suite 102 – 2168 Marine Dr.
10%, despite concerns about Europe’s finances and worries that the US would fall off
West Vancouver, BC
V7V 1K3 the “fiscal cliff” and go back into recession. And while Canada was up by 4%, it lagged
the U.S. for the third straight year.
Tel: 604-921-9222
brent.woyat@raymondjames.ca Much of 2012’s volatility was driven by the ebb and flow of good and bad news about
www.ofip.ca Europe. Positive indications for Europe’s economy in the first quarter led to the strongest
start for markets in recent memory, which was promptly given back as concerns rose
in the second quarter. Markets then rallied in the second half of the year when the
European Central Bank announced that it would provide liquidity to governments
and financial institutions – to the point that for 2012 as a whole, Europe’s stock market
actually outperformed the U.S.
The chart below shows the market returns as of December 31st, in Canadian dollar
terms. While 2012 was positive across all markets, the 3-year average return is still quite
low and actually negative in the European and Far East regions as a reminder of the
lingering effects of the severe downturn we experienced in 2008.
Market Returns 3 Months 6 Months 1 Year 3 Years
MSCI Emerging Markets 6.10% 9.90% 11.90% 0.20%
MSCI Europe 7.50% 12.50% 11.90% -1.90%
S&P 500 Composite -0.20% 2.20% 10.20% 6.40%
MSCI Far East 6.30% 3.30% 6.00% -0.80%
S&P/TSX Composite 0.90% 7.20% 4.00% 1.90%
Source: Bloomberg, Raymond James Ltd. In Canadian Dollars as of 12/31/2012. 1 and 3 year returns are annualized
2. OceanForest Investment Partners
Portfolio Managers Commentary – Q2 2012
Q4
Outlook for 2013
As we enter the new-year, there’s no doubt that there will be no easy resolution to the developed world’s debt woes,
unemployment or slow economic growth; there is a growing feeling that it will take years to work through these challenges.
The reality is that we are currently in the middle of a Sovereign Debt Crisis that appears to be spreading from the
European region to the west. The outcome of the recent “fiscal cliff” debacle in the U.S. suggests that the debt issues
south of the border are not going to be resolved anytime soon.
While President Obama wants to tax the rich and redistribute wealth to the middle class, he fails to understand that
they have a spending problem. Until they address their entitlement programs such as Social Security and Medicare/
Medicaid plus Defense Spending the problems will only grow worse. In addition, the estimated interest expense on
the public debt for FY2013 is $445 billion, and that’s in a record low interest rate environment! The total of these four
line items accounts for 77% of the spending of the total annual budget for the coming year.
Years of fiscal and monetary mismanagement will not end well, resulting in another economic crisis in the not too
distant future. Eventually the government will have no choice but to finally make the tough decisions instead of kicking
the can down the road one more time. The political battles over next few months will definitely be interesting.
While the government is in complete disarray it’s not to say that all is not well in the corporate sector. Around the
world companies are generally in very good condition, with strong operating margins and solid balance sheets. An
October interview in Barron’s magazine was a good example of the positive mood on stocks, in which 45-year industry
veteran and former Morgan Stanley strategist Byron Wien explained the reasons for his positive forecast for the U.S.
In summary:
• The US housing market has hit bottom and will be a positive force in 2013.
• Growth in the middle class in emerging markets will continue to provide opportunities for investors and
for companies selling into those markets (Wien is especially positive about agricultural commodities.)
• Dramatic new oil discoveries will put a cap on the price of oil and help buoy the US economy.
• Large multinational stocks offer predictable growth, solid balance sheets, and attractive yields
at reasonable valuations.
The other hot topic in the markets these days is the future direction of bond prices. There is a growing concern among
many leading strategists about the prospects for bonds based on current record low interest rates, despite their “flight
to safety” appeal; indeed, a recent New York Times article titled “Bond craze could run its course in new year” pointed
to research from Morningstar that bonds have grown from 14% of US investor portfolios five years ago to 26% today.
Of note, this is at a time when Warren Buffett in his annual letter to investors last spring said that due to today’s low
rates and inflation “bonds are among the most dangerous of assets.”
3. OceanForest Investment Partners
Portfolio Managers Commentary – Q2 2012
Q4
Bond funds on both sides of the border have seen massive inflows from investors seeking refuge from the volatility
and uncertainty of the equity markets. However this investment strategy will likely backfire sooner than later as the
majority of investors tend to do the wrong thing at the wrong time due to the herd mentality, leading to irrational
decision making.
As an example of how this strategy can go bad very quickly, if we use the Government of Canada 30-year benchmark
bond as an example, a one percent rise in interest rates would result in a price decline of over 19% on this particular
bond. A two percent increase from the current yield of 2.5% up to 4.5% would mean a price decline of 38%. This is
almost equivalent to the 50% decline in Canadian equities we saw during the 2008/2009 bear market. Once rates begin
to creep back up bond investors really need to pay attention and thoroughly understand the terms of their individual
bond holdings or the holdings within their bond funds.
Technically the price charts are already indicating that bonds in the U.S. and Canada are peaking with the upside
momentum waning in the past few months. A key level to watch for an upside trend reversal in rates is when the
Canada 10-year yield rises above 2% from the current 1.9% level.
Turning to the equity markets, there’s a good chance that the leaders and laggards of the past year will switch positions
in 2013. While the U.S. market has been the strongest of the developed markets for the past couple of years, Canada
has been an underperformer as illustrated in the performance table on page 1 in terms of the 1 and 3 year returns. The
Canadian market has been a laggard due to the weakness in commodity prices since 2011, particularly the price of crude
oil, gold, silver and the base metals.
However our feeling is that the massive amount of central bank stimulus around the globe has now worked its way
into the financial system and will begin creating inflationary pressures within the commodity sector. In addition,
the relentless drought in the U.S. mid-west will likely create another significant rally in agricultural commodities.
For these reasons, we expect Canada to begin showing better strength relative to the U.S. market due to its heavy
weighting in resource stocks.
A shift in inflation expectations will lead to a rise in interest rates creating a major headwind for the U.S. equity
markets. Add in the government disarray ahead of us and there’s a good chance that we could see another bear market
begin in U.S. equities by the end of 2013.
One chart we are closely watching is the yearly chart of the S&P 500 Index. The key level to monitor for a change in
trend is the previous year’s low as an important support level. Since 2009 the market never traded below the previous
year’s low as the market recovered from the 2008/2009 bear market decline.
From 1982 to 2000 the S&P 500 Index never traded below the previous year’s low for 18 years in a row while the same
pattern persisted from 2003 to 2007. The key level to watch on the S&P 500 Index in 2013 is the 2012 low of 1,258.
A break below this level will indicate lower prices and a new bear market as indicated on the following chart by the
red arrow.
4. OceanForest Investment Partners
Portfolio Managers Commentary – Q2 2012
Q4
Source: Stockcharts.com
The very long-term picture still suggests that we are in the middle of a long-term secular, sideways market. There
may be a couple of large swings in the next few years but we don’t really expect the “great sideways market” to put in
a final bottom until 2016 or 2018.
In post-election years going back to 1897, the seasonal pattern tends to indicate some weakness from January into
March followed by a rally into August then a decline into October with a bit a strength at the end of the year. We will
be watching this pattern closely to see how it correlates with today’s market.
Portfolio Strategy
Each month we reference our Tactical Asset Allocation model which provides us with long term timing signals for the
Canadian and U.S. equity markets. The model is similar to a “Hurricane Warning System”; when it turns defensive
it may indicate trouble brewing on the horizon while an aggressive signal suggests that the storm has passed. We have
been using this model for the past few years now to help guide our asset allocation decisions in terms of how much
equity exposure we want in our portfolios.
Within our Investment Policy Statement (IPS) we outline an asset allocation range for cash, fixed income and equities.
Depending on whether our model indicates an aggressive or defensive posture will dictate the level of equity exposure
to either the upper or lower end of the range in the IPS in order to help manage risk and preserve capital.
Currently both the U.S. and Canadian equity markets are providing us with an Aggressive signal. At the end of each
month we monitor conditions for a change in trend in order to make the appropriate changes within our client portfolios.
5. OceanForest Investment Partners
Portfolio Managers Commentary – Q2 2012
Q4
What this means for your portfolio
In my commentary at the end of last year, I outlined some guiding principles in my approach to managing our client
portfolios, four of which I repeat here.
1. Taking the right level of risk
My starting point with clients is to identify the rate of return they need in order to achieve their retirement goals and
then to construct a portfolio based on that return objective. My goal is to take the prudent level of risk for each client
- enough that we can be fairly confident that over time you’ll achieve your objectives, without taking more risk than
is necessary.
2. Adhering to your plan
Regardless of what happens to markets in the short term, barring a significant change in your circumstances, we
should stick to the investment parameters we’ve agreed to in the Investment Policy Statement (IPS). Some of you may
recall my advice in early 2009, as we faced what appeared to be an end-of-the-world scenario and some stocks hit
lows they hadn’t seen in 20 years. At that time, I urged clients to maintain a core level of equity exposure, something
that ended up working out well.
3. Diversifying portfolios
When building equity portfolios I’ve always advocated strong diversification. In general we will hold 20 – 25 stock
positions across various sectors and industry groups. For balanced accounts we actively manage a selection of good
quality bonds in order to protect against the risk of rising interest rates while always on the lookout for the best return
for the level of risk taken.
Since Canada represents less than 5% of the investing opportunities around the world we are also seeking geographic
diversification within our stock portfolios. Because the Canadian market is resource focused it will tend to be more
volatile over time than those of the U.S. and yes, even Europe.
4. Focus on cash flow
The final principle relates to the role of cash flow from investments. In an uncertain environment for immediate
economic growth and equity returns, I continue to place priority on the cash yield from investments.
In our view the returns on investment grade corporate bonds, preferred shares and dividend stocks in selective sectors
continue to be attractive areas for investment. When it comes to equities we are becoming increasingly selective however
as some stocks that pay steady dividends now look expensive by historical standards and show signs of stretched
valuations - this is because investor appetite for yield has bid up prices of many dividend paying stocks.
6. OceanForest Investment Partners
Portfolio Managers Commentary – Q2 2012
Q4
The following performance table shows the returns of our investment mandates at the end of 2012. Ranked by the
1-year return, our all equity Dividend Growth portfolio posted the strongest return with a gain of 10.10%. The next
best performer was our more conservative $USD Global Leaders – Balanced portfolio, gaining 7.88% the past year.
Next up was our $USD Global Market Leaders portfolio which returned 7.84% year over year. Our more conservative
Global Growth & Income portfolio gained 7.16% in the past twelve months followed by our most conservative Enhanced
Income portfolio returning 4.77% in the past twelve months. Note that the returns are net of all fees and expenses.
Portfolio Models 3 Months 6 Months 1 Year 3 Years
Dividend Growth 0.97% 3.37% 10.10% 6.58%
Global Leaders - Balanced (USD) 1.41% 4.58% 7.88% 6.22%
Global Market Leaders (USD) 2.83% 6.52% 7.84% 4.00%
Global Growth & Income 2.44% 4.70% 7.16% 5.90%
Enhanced Income 0.99% 2.71% 4.77% 6.62%
Source: Dataphile, Raymond James Ltd. 1 and 3 year returns are annualized
I hope you found this overview helpful. Should you have questions about anything in this note or about any other
issue, please feel free to give me or one of the members of my team a call.
And as always, thank you for the opportunity to serve as your investment manager.
Best regards,
Brent Woyat, CIM, CMT
Portfolio Manager
OceanForest Investment Partners
P.S. - I don’t often ask for referrals, but during these unsettling times you might have a friend, relative, or co-worker who
is in need of level-headed counsel on investing. Give me a call if you think I can help. Please note that privacy legislation
requires that anyone you are referring consents to having his/her information provided to me.
The model account performance reflects returns, net of fees, and it is historical, including compounding and reinvestment of distributions. The performance calculation for the
models may be different than that of the index/markets used as a reference point for comparison. Individual client account performance is likely not to be exactly the same as
the model account due to several factors, including timing of contributions, date invested in the model and redemptions, etc. Performance data represents past performance
and is not necessarily indicative of future performance; that there is no guarantee of performance. The index rates of return do not take into account sales, redemptions,
distributions or optional charges or income taxes payable; whereas the model performance takes into account the respective charges and fees. Investors should read the
available disclosure documents before investing.
The information contained in this report was obtained from sources believed to be reliable, however, we cannot represent that it is accurate or complete. This report is provided
as a general source of information and should not be considered personal investment advice or solicitation to buy or sell securities. The views expressed are those of the
author and not necessarily those of Raymond James Ltd. The performance numbers are based on the underlying “model” client account in Dataphile, and that the source of the
performance is Dataphile, which generates on “dollar weighted” returns. Raymond James Ltd., is a Member-Canadian Investor Protection Fund.
Market indices return data in this table is from sources believed to be reliable, but accuracy cannot be guaranteed. The index returns represent only the price gains (excluding dividends).