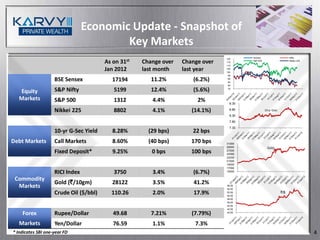
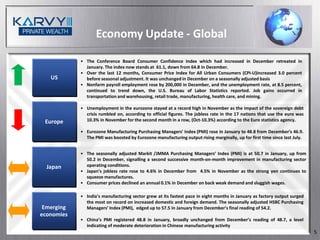
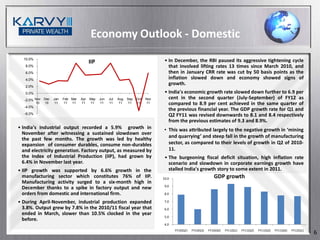
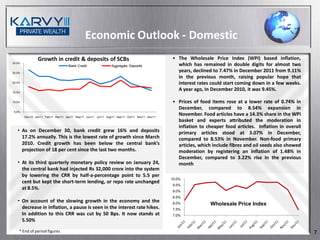
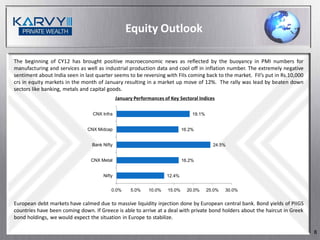
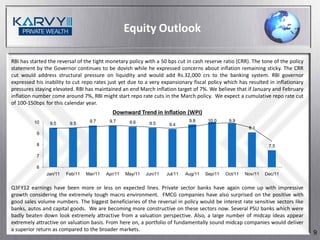
The document provides an economic and market outlook for February 2012. It notes that while recent increases in risk asset prices globally may be due to a turnaround in sentiment rather than fundamentals, several domestic avenues like long term debt, mid cap equities and infrastructure companies could provide returns with a genuine long term investment horizon. India's GDP growth slowed in the second quarter of FY12, but industrial output grew 5.9% in November. Inflation declined to 7.47% in December raising hopes that interest rates may start to fall. The equity market rallied in January led by banking, metals and capital goods sectors.
Global economic developments remained in a sort of suspended animation through last month–especially coming on the back of the recent months of significant turbulence.
Our ‘Advice for the Wise’ monthly newsletter gives you an outlook across sectors along with economic updates both from a global and domestic perspective.
October turned out to be a rather positive and optimism inducing month - with most positive global news coming in along with the adaptation of dovish stance by RBI.
Advise for the wise is monthly journal which gives you a highlight of the current market analysis in terms of gold, equity, debt and forex market. Get the overview of the entire financial market in dew slides.
The turm oil in financial markets across the globe caused by the rating downgrade of US Government debt by S&P will continue to haunt the Indian markets also for quite sometime to come.
February was a significant and on the balance positive month for all Indian markets as well as the Indian economy. Here's a sneak peek at the markets and other facts required for the upcoming month.
Options Strategy Monthly - 2006 - Low Volatility in the 7th Inning? Housing M...RYAN RENICKER
Actionable trade ideas for stock market investors and traders seeking alpha by overlaying their portfolios with options, other derivatives, ETFs, and disciplined and applied Game Theory for hedge fund managers and other active fund managers worldwide. Ryan Renicker, CFA
Stock Market Indices Trading in a Very Narrow Trading RangeRYAN RENICKER
Actionable trade ideas for stock market investors and traders seeking alpha by overlaying their portfolios with options, other derivatives, ETFs, and disciplined and applied Game Theory for hedge fund managers and other active fund managers worldwide. Ryan Renicker, CFA
We expect transactions to fall and prices to ease in 2009, in line with the projected 3%
real GDP contraction. Transactions could fall 20-30% or as much as 35-50% in the
worst-case scenario, matching the performance during the 1997/8 Asian financial
crisis. However, most major developers have pushed out innovative financing
schemes to lure buyers. Response has been mixed, with good response garnered by
the likes of SP Setia (RM500m sales) and Mah Sing (RM170m sales) but lacklustre
sales for many other developers
A welcome respite in softening of commodity prices provided some much- needed positive sentiment to the Indian equity markets last month.Most benchmarks recovered quite well from their early lows and are showing definite signs of positive near term movement.
‘Advice for the Wise’ newsletter for the month of October is out; it would give you a detailed outlook across sectors along with economic updates both from a global and domestic perspective, do take a look.
Our ‘Advice for the Wise’ is monthly newsletter which gives you an outlook across sectors along with economic updates both from a global and domestic perspective.
An in-depth research of the market enables us to give you some of the recommendations on Top Equity Mutual Funds, Top Debt Mutual Funds, Top Life Insurance policies and Top Health Insurance policies.
Be realistic, be selective. We believe this market rally has pushed
valuations to the point where growth expectations have reached
implausible levels. In fact, profits have just begun to turn down. We are
not overly bearish – our Buy list is longer than our Sell list – but we
caution that optimism over growth can disappear as quickly as it
appeared. Domestic factors, particularly political developments, may
be a positive catalyst.
Profit recession has just begun. Industrial production peaked in
January 2008, but profits only began a broad-based decline in 1Q09.
Within our coverage, 63% of the companies that have released 1Q
earnings reported lower sequential quarterly net profits. In seven
sectors, our entire coverage list suffered profit contractions. This
suggests the recession in profits has just begun.
Market valuation implies an optimistic view of growth. The market
currently trades at 15.2x 2009 earnings, up from 12x earlier this year.
This is only 10% below the previous cycle’s mid-cycle value, but today,
we face growth of -7.7% (2009) and +9.7% (2010), taking market
earnings only 1% higher by the end of 2010 from its end-2008 level.
Market growth expectations seem to be running ahead of reality.
History tells us the bear market isn’t over. Two previous bear
markets over 1981-86 and 1993-98 lasted 57 and 58 months
respectively. It has now been 17 months from the January 2008
collapse. Those bear markets had 22-38 trend reversals of 5% or more;
we have now seen 12 since January 2008. These comparisons suggest
we are, at best, half way through this bear market.
Bet on Prime Minister Najib, but Sell hope. Our top stock picks are
in the construction sector. We expect PM Najib will deliver on the fiscal
spending promises, reinvigorating the construction and building
materials sectors. Our top Sells are stocks where high hopes and
expectations have been built in; where current prices have run well
ahead of both our and consensus target prices.
Politics a positive wildcard. Beyond rapidly executed fiscal packages,
the country’s new leadership could make further changes to longstanding
policies to attract foreign investment and win back broader
support from all Malaysians. These initiatives should be positive for
equity market at least in the short-term.
how to swap pi coins to foreign currency withdrawable.DOT TECH
As of my last update, Pi is still in the testing phase and is not tradable on any exchanges.
However, Pi Network has announced plans to launch its Testnet and Mainnet in the future, which may include listing Pi on exchanges.
The current method for selling pi coins involves exchanging them with a pi vendor who purchases pi coins for investment reasons.
If you want to sell your pi coins, reach out to a pi vendor and sell them to anyone looking to sell pi coins from any country around the globe.
Below is the contact information for my personal pi vendor.
Telegram: @Pi_vendor_247
Empowering the Unbanked: The Vital Role of NBFCs in Promoting Financial Inclu...Vighnesh Shashtri
In India, financial inclusion remains a critical challenge, with a significant portion of the population still unbanked. Non-Banking Financial Companies (NBFCs) have emerged as key players in bridging this gap by providing financial services to those often overlooked by traditional banking institutions. This article delves into how NBFCs are fostering financial inclusion and empowering the unbanked.
USDA Loans in California: A Comprehensive Overview.pptxmarketing367770
USDA Loans in California: A Comprehensive Overview
If you're dreaming of owning a home in California's rural or suburban areas, a USDA loan might be the perfect solution. The U.S. Department of Agriculture (USDA) offers these loans to help low-to-moderate-income individuals and families achieve homeownership.
Key Features of USDA Loans:
Zero Down Payment: USDA loans require no down payment, making homeownership more accessible.
Competitive Interest Rates: These loans often come with lower interest rates compared to conventional loans.
Flexible Credit Requirements: USDA loans have more lenient credit score requirements, helping those with less-than-perfect credit.
Guaranteed Loan Program: The USDA guarantees a portion of the loan, reducing risk for lenders and expanding borrowing options.
Eligibility Criteria:
Location: The property must be located in a USDA-designated rural or suburban area. Many areas in California qualify.
Income Limits: Applicants must meet income guidelines, which vary by region and household size.
Primary Residence: The home must be used as the borrower's primary residence.
Application Process:
Find a USDA-Approved Lender: Not all lenders offer USDA loans, so it's essential to choose one approved by the USDA.
Pre-Qualification: Determine your eligibility and the amount you can borrow.
Property Search: Look for properties in eligible rural or suburban areas.
Loan Application: Submit your application, including financial and personal information.
Processing and Approval: The lender and USDA will review your application. If approved, you can proceed to closing.
USDA loans are an excellent option for those looking to buy a home in California's rural and suburban areas. With no down payment and flexible requirements, these loans make homeownership more attainable for many families. Explore your eligibility today and take the first step toward owning your dream home.
how can I sell pi coins after successfully completing KYCDOT TECH
Pi coins is not launched yet in any exchange 💱 this means it's not swappable, the current pi displaying on coin market cap is the iou version of pi. And you can learn all about that on my previous post.
RIGHT NOW THE ONLY WAY you can sell pi coins is through verified pi merchants. A pi merchant is someone who buys pi coins and resell them to exchanges and crypto whales. Looking forward to hold massive quantities of pi coins before the mainnet launch.
This is because pi network is not doing any pre-sale or ico offerings, the only way to get my coins is from buying from miners. So a merchant facilitates the transactions between the miners and these exchanges holding pi.
I and my friends has sold more than 6000 pi coins successfully with this method. I will be happy to share the contact of my personal pi merchant. The one i trade with, if you have your own merchant you can trade with them. For those who are new.
Message: @Pi_vendor_247 on telegram.
I wouldn't advise you selling all percentage of the pi coins. Leave at least a before so its a win win during open mainnet. Have a nice day pioneers ♥️
#kyc #mainnet #picoins #pi #sellpi #piwallet
#pinetwork
how to sell pi coins in all Africa Countries.DOT TECH
Yes. You can sell your pi network for other cryptocurrencies like Bitcoin, usdt , Ethereum and other currencies And this is done easily with the help from a pi merchant.
What is a pi merchant ?
Since pi is not launched yet in any exchange. The only way you can sell right now is through merchants.
A verified Pi merchant is someone who buys pi network coins from miners and resell them to investors looking forward to hold massive quantities of pi coins before mainnet launch in 2026.
I will leave the telegram contact of my personal pi merchant to trade with.
@Pi_vendor_247
The secret way to sell pi coins effortlessly.DOT TECH
Well as we all know pi isn't launched yet. But you can still sell your pi coins effortlessly because some whales in China are interested in holding massive pi coins. And they are willing to pay good money for it. If you are interested in selling I will leave a contact for you. Just telegram this number below. I sold about 3000 pi coins to him and he paid me immediately.
Telegram: @Pi_vendor_247
what is the best method to sell pi coins in 2024DOT TECH
The best way to sell your pi coins safely is trading with an exchange..but since pi is not launched in any exchange, and second option is through a VERIFIED pi merchant.
Who is a pi merchant?
A pi merchant is someone who buys pi coins from miners and pioneers and resell them to Investors looking forward to hold massive amounts before mainnet launch in 2026.
I will leave the telegram contact of my personal pi merchant to trade pi coins with.
@Pi_vendor_247
how to sell pi coins at high rate quickly.DOT TECH
Where can I sell my pi coins at a high rate.
Pi is not launched yet on any exchange. But one can easily sell his or her pi coins to investors who want to hold pi till mainnet launch.
This means crypto whales want to hold pi. And you can get a good rate for selling pi to them. I will leave the telegram contact of my personal pi vendor below.
A vendor is someone who buys from a miner and resell it to a holder or crypto whale.
Here is the telegram contact of my vendor:
@Pi_vendor_247
Currently pi network is not tradable on binance or any other exchange because we are still in the enclosed mainnet.
Right now the only way to sell pi coins is by trading with a verified merchant.
What is a pi merchant?
A pi merchant is someone verified by pi network team and allowed to barter pi coins for goods and services.
Since pi network is not doing any pre-sale The only way exchanges like binance/huobi or crypto whales can get pi is by buying from miners. And a merchant stands in between the exchanges and the miners.
I will leave the telegram contact of my personal pi merchant. I and my friends has traded more than 6000pi coins successfully
Tele-gram
@Pi_vendor_247
when will pi network coin be available on crypto exchange.DOT TECH
There is no set date for when Pi coins will enter the market.
However, the developers are working hard to get them released as soon as possible.
Once they are available, users will be able to exchange other cryptocurrencies for Pi coins on designated exchanges.
But for now the only way to sell your pi coins is through verified pi vendor.
Here is the telegram contact of my personal pi vendor
@Pi_vendor_247
2. Contents
Index Page No.
Economic Update 4
Equity Outlook 8
Debt Outlook 12
Forex 14
Commodities 15
Real Estate 16
2
3. From the Desk of the CIO…
Dear Investor,
The month of January was marked by an unusual return of risk appetite In the current market scenario, there are several avenues to make
amongst investors globally. While we consider this to be a welcome break money provided the investment horizon is genuinely adhered to. Long
from the excessive risk aversion towards the end of 2011, a word of term debt, mid cap equities and infrastructure companies are the
caution is due. The fundamentals underlying the global economy as well as obvious candidates for the same right now. The long term debt strategy
the Indian economy have not changed much through the last month. is already yielding good results with 10 year bond prices rising by over
3%. Depending on inflation data and RBI stance going forward the
Hence the recent increase in the risk asset prices globally might be subject
appreciation is likely to continue. The horizons about 1 to 1.5 years. In
to a sharp reversal if even a minor macroeconomic hiccup were to occur in
the shorter term the yields may fluctuate in unexpected direction as
either Europe or the US. The recent rise in the asset prices seems based well.
more on a sharp turnaround in sentiment rather than actual
developments on the ground. Owing to this, the recent rally is highly Mid cap equities are looking attractive since the recent rally has
sensitive to even small change in sentiments – potentially leading to a indicated a bottom of sorts to the broad market level. Even if the
rapid selloff. markets were to correct from the current levels, midcap equities have
not rallied as much already and hence remain attractive buys. A good
Timing the markets has long been advised against by investment gurus bottom up strategy to select well-run mid cap companies is likely to be
and academics alike. We do subscribe to the broad philosophy of ill effects quite sound in the present market conditions. The horizon for these
ideas is 2 years – during which risk appetite should return sufficiently to
of trying to catch the falling market or being excessively swayed by the
transcend the now relatively cheaply available large cap equities.
rising one. However, the crucial element of execution while practicing long
term investing is disciplined review. The downside of declaring a three Infrastructure has long been taking a sustained beating in terms of
year horizon in principle but tracking portfolio value every day or every valuations as a sector. Since the earlier high prices of the infrastructure
week is that through the pressures of too low or too high levels of stocks implicitly had in them continued infrastructure development in
markets, one is likely to commit some error or other in investing hastily or India which did not fully materialize, some fall there was imminent.
divesting too soon or too little. The right approach then is to decide the However owing to high interest rates through 2011, these stocks went
horizon of each investment to oneself a priori and stick to the same unless down much more than expected. While some of these have staged a
something utterly unexpected happens. Unlike the conventional wisdom sharp recovery in January, the sector warrants more attention going
of three years as the default horizon for any risky investment, we believe forward as the interest rates go down and infrastructure development
picks up again. Our expected horizon for infrastructure turnaround is 1
there are multiple different horizons possible for an investment idea.
year. 3
“Advisory services are provided through Karvy Stock Broking Ltd. (PMS) having SEBI Registration No: INP000001512. Investments are subject to market risks. Please read the disclaimer on slide no.19”
5. Economy Update - Global
• The Conference Board Consumer Confidence Index which had increased in December retreated in
January. The index now stands at 61.1, down from 64.8 in December.
• Over the last 12 months, Consumer Price Index for All Urban Consumers (CPI-U)increased 3.0 percent
US before seasonal adjustment. It was unchanged in December on a seasonally adjusted basis
• Nonfarm payroll employment rose by 200,000 in December, and the unemployment rate, at 8.5 percent,
continued to trend down, the U.S. Bureau of Labor Statistics reported. Job gains occurred in
transportation and warehousing, retail trade, manufacturing, health care, and mining.
• Unemployment in the eurozone stayed at a record high in November as the impact of the sovereign debt
crisis rumbled on, according to official figures. The jobless rate in the 17 nations that use the euro was
Europe 10.3% in November for the second month in a row, (Oct-10.3%) according to the Euro statistics agency.
• Eurozone Manufacturing Purchasing Managers' Index (PMI) rose in January to 48.8 from December's 46.9.
The PMI was boosted by Eurozone manufacturing output rising marginally, up for first time since last July.
• The seasonally adjusted Markit /JMMA Purchasing Managers’ Index (PMI) is at 50.7 in January, up from
50.2 in December, signalling a second successive month-on-month improvement in manufacturing sector
Japan operating conditions.
• Japan's jobless rate rose to 4.6% in December from 4.5% in November as the strong yen continues to
squeeze manufactures.
• Consumer prices declined an annual 0.1% in December on back weak demand and sluggish wages.
• India's manufacturing sector grew at its fastest pace in eight months in January as factory output surged
the most on record on increased domestic and foreign demand. The seasonally adjusted HSBC Purchasing
Emerging Managers’ Index (PMI), edged up to 57.5 in January from December's final reading of 54.2.
economies
• China’s PMI registered 48.8 in January, broadly unchanged from December’s reading of 48.7, a level
indicating of moderate deterioration in Chinese manufacturing activity
5
6. Economy Outlook - Domestic
10.0% • In December, the RBI paused its aggressive tightening cycle
IIP
8.0% that involved lifting rates 13 times since March 2010, and
6.0% then in January CRR rate was cut by 50 basis points as the
4.0% inflation slowed down and economy showed signs of
2.0%
growth.
0.0% • India's economic growth rate slowed down further to 6.9 per
-2.0% Nov Dec Jan Feb Mar Apr May Jun Jul Aug Sep Oct Nov cent in the second quarter (July-September) of FY12 as
10 10 11 11 11 11 11 11 11 11 11 11 11 compared to 8.9 per cent achieved in the same quarter of
-4.0%
the previous financial year. The GDP growth rate for Q1 and
-6.0% Q2 FY11 was revised downwards to 8.1 and 8.4 respectively
from the previous estimates of 9.3 and 8.9%.
• India's industrial output recorded a 5.9% growth in • This was attributed largely to the negative growth in ‘mining
November after witnessing a sustained slowdown over
and quarrying’ and steep fall in the growth of manufacturing
the past few months. The growth was led by healthy
expansion of consumer durables, consume non-durables sector, as compared to their levels of growth in Q2 of 2010-
and electricity generation. Factory output, as measured by 11.
the Index of Industrial Production (IIP), had grown by • The burgeoning fiscal deficit situation, high inflation rate
6.4% in November last year. scenario and slowdown in corporate earnings growth have
• IIP growth was supported by 6.6% growth in the stalled India's growth story to some extent in 2011.
manufacturing sector which constitutes 76% of IIP. 10.0 GDP growth
Manufacturing activity surged to a six-month high in
9.0
December thanks to a spike in factory output and new
orders from domestic and international firm. 8.0
• During April-November, industrial production expanded 7.0
3.8%. Output grew by 7.8% in the 2010/11 fiscal year that 6.0
ended in March, slower than 10.5% clocked in the year
5.0
before.
4.0
FY10(Q2) FY10(Q3) FY10(Q4) FY11(Q1) FY11(Q2) FY11(Q3) FY11(Q4) FY12(Q1)
6
7. Economic Outlook - Domestic
Growth in credit & deposits of SCBs • The Wholesale Price Index (WPI) based inflation,
30.0%
Bank Credit Aggregate Deposits which has remained in double digits for almost two
25.0%
years, declined to 7.47% in December 2011 from 9.11%
in the previous month, raising popular hope that
20.0% interest rates could start coming down in a few weeks.
15.0%
A year ago, In December 2010, it was 9.45%.
10.0% • Prices of food items rose at a lower rate of 0.74% in
December, compared to 8.54% expansion in
5.0%
Dec/10 Jan/11 Feb/11 Mar/11 Apr/11 May/11 Jun/11 Jul/11 Aug/11 Sep/11 Oct/11 Nov/11 Dec/11
November. Food articles have a 14.3% share in the WPI
basket and experts attributed the moderation in
inflation to cheaper food articles. Inflation in overall
• As on December 30, bank credit grew 16% and deposits primary articles stood at 3.07% in December,
17.2% annually. This is the lowest rate of growth since March compared to 8.53% in November. Non-food primary
2010. Credit growth has been below the central bank’s articles, which include fibres and oil seeds also showed
projection of 18 per cent since the last two months. moderation by registering an inflation of 1.48% in
December, compared to 3.22% rise in the previous
• At its third quarterly monetary policy review on January 24, month
the central bank had injected Rs 32,000 crore into the system
by lowering the CRR by half-a-percentage point to 5.5 per
10.0%
cent but kept the short-term lending, or repo rate unchanged
9.5%
at 8.5%.
9.0%
8.5%
• On account of the slowing growth in the economy and the 8.0% Wholesale Price Index
decrease in inflation, a pause is seen in the interest rate hikes. 7.5%
In addition to this CRR was cut by 50 Bps. It now stands at 7.0%
5.50%
* End of period figures 7
8. Equity Outlook
The beginning of CY12 has brought positive macroeconomic news as reflected by the buoyancy in PMI numbers for
manufacturing and services as well as industrial production data and cool off in inflation number. The extremely negative
sentiment about India seen in last quarter seems to be reversing with FIIs coming back to the market. FII’s put in Rs.10,000
crs in equity markets in the month of January resulting in a market up move of 12%. The rally was lead by beaten down
sectors like banking, metals and capital goods.
January Performances of Key Sectoral Indices
CNX Infra 19.1%
CNX Midcap 16.2%
Bank Nifty 24.5%
CNX Metal 16.2%
Nifty 12.4%
0.0% 5.0% 10.0% 15.0% 20.0% 25.0% 30.0%
European debt markets have calmed due to massive liquidity injection done by European central bank. Bond yields of PIIGS
countries have been coming down. If Greece is able to arrive at a deal with private bond holders about the haircut in Greek
bond holdings, we would expect the situation in Europe to stabilize.
8
9. Equity Outlook
RBI has started the reversal of the tight monetary policy with a 50 bps cut in cash reserve ratio (CRR). The tone of the policy
statement by the Governor continues to be dovish while he expressed concerns about inflation remaining sticky. The CRR
cut would address structural pressure on liquidity and would add Rs.32,000 crs to the banking system. RBI governor
expressed his inability to cut repo rates just yet due to a very expansionary fiscal policy which has resulted in inflationary
pressures staying elevated. RBI has maintained an end March inflation target of 7%. We believe that if January and February
inflation number come around 7%, RBI might start repo rate cuts in the March policy. We expect a cumulative repo rate cut
of 100-150bps for this calendar year.
Downward Trend in Inflation (WPI)
10 9.7 9.7 9.6 9.8 10.0 9.9
9.5 9.5 9.5 9.4
9.1
9
8 7.5
7
6
Jan/11 Feb/11 Mar/11 Apr/11 May/11 Jun/11 Jul/11 Aug/11 Sep/11 Oct/11 Nov/11 Dec/11
Q3FY12 earnings have been more or less on expected lines. Private sector banks have again come up with impressive
growth considering the extremely tough macro environment. FMCG companies have also surprised on the positive with
good sales volume numbers. The biggest beneficiaries of the reversal in policy would be interest rate sensitive sectors like
banks, autos and capital goods. We are becoming more constructive on these sectors now. Several PSU banks which were
badly beaten down look extremely attractive from a valuation perspective. Also, a large number of midcap ideas appear
extremely attractive on valuation basis. From here on, a portfolio of fundamentally sound midcap companies would deliver
a superior return as compared to the broader markets.
9
10. Sector View
Sector Stance Remarks
Financial sector is undeniably the lubricant for economic growth. Whether the growth comes
from consumption or investments, credit growth is inevitable. Being a well regulated sector, BFSI
BFSI Overweight
in India has good asset quality and capital adequacy ratios. The reversal of the interest rate cycle
will assist in managing asset quality better and would lead to increase in credit growth
We prefer “discretionary consumption” beneficiaries such as Cigarettes and branded garments,
FMCG Overweight as the growth in this segment will be disproportionately higher vis-à-vis the increase in
disposable incomes.
We believe in the large sized opportunity presented by Pharma sector in India. India’s strength in
generics is difficult to replicate due to quality and quantity of available skilled manpower. With
Healthcare Neutral the developed world keen to cut healthcare costs, and a vast pipeline of drugs going off-patent,
Indian Pharma players are at the cusp of rapid growth. We would bet on the opportunity in
Generics and CRAMS space
The USD 1 trillion Infra opportunity is hard to ignore. However, The significant slowdown in
E&C Neutral order inflow activity combined with high interest rates has hurt the sector. Now since the
interest rate cycle has started to reverse, we have turned more constructive on this space
The regulatory hurdles, competitive pressures and leverage prevent any return to high
Telecom Neutral profitability levels in the short to medium term. However, incumbents have started to increase
tariffs slowly and we believe that consolidation will happen sooner than expected.
10
11. Sector View
Sector Stance Remarks
While US and European customers of Indian IT companies are in good health, Order inflows
IT/ITES Neutral might slow down in near term. However, in the next few quarters big rupee depreciation
will provide cushion to IT companies earnings .
Demand outlook remains robust with strong earnings growth. Raw material prices have
Automobiles Neutral started coming down which would boost margins. We are more bullish on two-wheeler and
agricultural vehicles segment due to lesser competition and higher pricing power.
Commodity prices have corrected significantly over the last few months due to concerns
Metals Neutral about growth in developed parts of the world. We believe the commodity prices will
bounce back once growth recovers and hence would be positive on industrial metals space.
We like the regulated return characteristics of this space. This space provides steady growth
Power Utilities Neutral
in earnings and decent return on capital.
Cement demand will certainly grow over the next three years. But the issue is on the supply
Cement Underweight
side. We do see an oversupply situation for the next 3-4 quarters.
We would stay away from oil PSUs, due to issues of cross subsidization distorting the
Energy Underweight
underlying economics of oil exploration and refinery businesses.
11
12. Debt Outlook
9.30
9.0 Yield curve
8.9 8.80
10-yr G-sec yield
8.8
8.7
8.30
8.6
(%)
8.5
7.80
8.4
8.3
7.30
8.2
8.1
6.80
8.0
7.9
11.1
14.7
10.1
12.0
12.9
13.8
15.7
16.6
17.5
18.4
19.4
0.9
4.6
0.0
1.9
2.8
3.7
5.5
6.5
7.4
8.3
9.2
• The 10 year benchmark G–Sec yield decreased by 19 bps in December to close at 8.54%.
• The inflation figures have come down with a reverse trend to be seen in the tight monetary policy.
• The AAA rated corporate bonds are giving an yield of around 9.3%.
12
13. Debt Strategy
Category Outlook Details
With the pause by RBI and the expected trend reversal of the
interest rates, we would not recommend investment in Shorter
Short Tenure term debt funds unless money necessarily needs to be parked for
Debt the shorter term by the investor. The ST funds still have high YTMs
(9.5% – 10%) providing interesting investment opportunities to
clients for the shorter term.
Some AA and select A rated securities are very attractive at the
current yields. A similar trend can be seen in the Fixed Deposits
Credit also. Tight liquidity in the system has also contributed to widening
of the spreads making entry at current levels attractive.
With the expected trend reversal in the interest rates, we would
strongly recommend investment in Longer term papers. These, while
Long Tenure being available at attractive yields, also provide an opportunity for
Capital appreciation due to a decrease in interest rates. Hence, these
Debt
would be suitable for both - investors who may want to stay invested
for the medium term (exiting when prices appreciate) and those who
would want to lock in high yields for the longer term.
13
14. Forex
Rupee movement vis-à-vis other currencies (M-o-M) 100 Trade balance and export-import data 0
Export Import Trade Balance (mn $)
8.00% 80 -5000
7.21%
60
7.00% -10000
40
6.00% 5.17% 5.37% -15000
5.03% 20
5.00% 0 -20000
4.00% -20 -25000
3.00%
2.00%
• India’s exports grew 6.71% to $25.01 billion in December,
2011, compared to $23.44 billion in the same year-ago
1.00%
month, while imports were up 19.81% at $37.75 billion
0.00%
translating into a trade deficit of $12.73 billion. In
USD GBP EURO YEN November, 2010, imports aggregated $31.51 billion.
• In January, the rupee has appreciated 7%, after being the 140000
Capital Account Balance
worst performing Asian currency in 2011. The gain can be
90000
attributed to the recent diversion of foreign funds towards
Indian debt and equity investments. 40000
• Besides active Forex intervention, RBI also took a number of -10000
FY 10 (Q2) FY 10 (Q3) FY 10 (Q4) FY 11 (Q1) FY 11 (Q2) FY 11 (Q3) FY 11 (Q4) FY 12 (Q1)
steps like relaxing external borrowings norms, cuts in
interbank net open positions and higher interest rates on • Capital account balance was positive throughout FY11 and
deposits for non-resident Indians to stimulate capital inflows stood at `273133 Cr. at the end of the year. For FY 12, the
and curb speculation. capital account is at `93,621Cr. for Q1.
• We expect factors as higher interest rates to attract more
• However, renewed concerns from the debt-ridden euro zone investments to India. Increased limits for investment by
may lead to another round of depreciation in the current FIIs would also help in bringing in more funds though
quarter, though there may not be any sharp downward uncertainty in the global markets could prove to be a
movement. dampener.
14
15. Commodities
After gaining for the 11th consecutive years, gold continued its uptrend 31000
in 2012. Rupee denominated gold gained 3.7% YTD. The sheen on the 29000 Gold
domestic rupee gold was taken away by the rupee appreciation despite 27000
gold in dollar denomination generating an YTD return of 12%. 25000
As the Fed holds the interest rates at the current levels until end of
Precious 2014, smart money will move into assets that would generate income
23000
21000
and outperform dollar deposit. This was clearly vindicated by the sharp
Metals 19000
up move in gold on the back of short covering and fresh long positions.
17000
The current gold holdings of 2,384.8 tons in bullion-backed exchange-
15000
traded products are within 0.4 percent of December’s all-time high,
indicating added bullishness to this counter.
Technically, gold broke its consolidating triangle and poised to set a
fresh all time high this year. With Greece and its creditors are
struggling to reach an agreement on a debt swap and market buzzing
that creditors might take a bigger hit than earlier planned, gold should
in all probability shine this quarter.
135.0
Crude
With uncertainties looming on the Greece front and tension on the 125.0
Iran disruption suicides, oil has started to show signs up cooling. Oil 115.0
trajectory should now be largely determined by the uptick in US and
Oil & Gas Europe economies. As the Fed indicated that US is on a slower
105.0
95.0
growth pace, it is logically to see crude oil softening. Expect oil to
trade in a range. 85.0
75.0
16. Real Estate Outlook - I
Asset Classes Outlook
In the residential space, low sales volumes have led to a sharp decline in the absorption rate from 21.4% in Q1
2011 to 11.5% in Q3 2011. However, strong pre-launch sales have kept the developers far from any correction.
Though sales have gone down to almost 35% as compared to last year, no correction has been witnessed in the
prices. The over-supplied locations remain stagnant and are expected to remain so for the next two quarters. In
cities like Pune, NCR, Hyderabad, Chennai and Bangalore entry points in the range of Rs. 3000 – Rs. 4600 per
Residential
Sqft are still valued by first time home -buyers. Infrastructure development and the new airports in these cities
have supported the residential development. On an average, prices in this segment still remain affordable.
Mumbai stands tall with prices at the peak in an over-supplied market also. Corrections are being reported by
media, however not being witnessed on ground level. The retail investors (second home buyers) and HNI
investors are postponing their decision due to expectations of price correction.
Average q-o-q rental growth in 3Q11 was recorded at 2.5%. Mumbai SBD BKC was among the most expensive
markets and Bangalore and Chennai among the least expensive in Asia Pacific, on the basis of Net Effective
Rents. Among the fastest growing office market in the world, India is constructing 100 million Sqft every 7-10
quarters. Office stock is expected to become 500 million Sqft by 2015. The Net Absorption is expected to grow
from 30.5 million Sqft in 2010 to 39.1 million Sqft in 2013. Absorption rate has been recorded at 13.3% in
3Q11. 8.5 million Sqft of office space was absorbed in 3Q11 compared to 10.5 million sq ft in 2Q11.
Commercial/IT Still in the shadows of over-supply and cautious expansion approach by corporates, this segment has gone
through a correction. Rates per Sqft have seen almost 30% down-trend and is expected to be stagnant for the
coming 2-3 quarters. After this correction we believe the segment is bottoming out and is the best time to buy
for companies looking at long term holding of real estate office space. With signs of recovery in the global
economy, the Indian office markets are expected to be nearing the end of the downturn. Despite improving
demand conditions, vacancies are rising in the short term due to massive infusion of office space. Markets of
Bangalore, Mumbai and NCR-Delhi are leading the property cycle as rentals have started to increase in these
markets.
16
17. Real Estate Outlook - II
Asset Classes Outlook
The FDI allowance has given lot of impetus to this sector. Since 2009 retail has seen a major transformation in
all its business aspects and has been built to suit Indian way of consumerism. Low cost, wide reach, more
variety, less innovation, close existence with competition, maximizing bottom line than top-line approach have
been making the retailers smarter. In the retail space, unorganized markets are still a preferred choice. Most
high-street locations are still expensive. Investors prefer Hi-street locations than malls since they would always
have capital appreciation due to dearth of available space.
Retail
Of 9.9 mn sq ft forecasted for absorption in 2011, 7.1 mn sq ft has already been absorbed till 3Q11 and another
1.3 mn sq ft is pre-committed. The northern regions of India rate high on propensity to consume followed by
the western, eastern and southern regions. Industrial towns are similar to each other in consumer preferences
and socio-economic & demographic profiles. Most of them remain equally under-served despite recent mall
developments in the last couple of years.
The trend of investment in land is still nascent since lack of transparency and unclear national land acquisition
policy/rules makes it tough for the organized players/investors to transact. However this seems to be a very
interesting time to buy land which is being traded more as a commodity now. It is getting absorbed fast. Land
Land sees immense opportunity since it can be used as a tangible asset and is the most credible pledge against
business. With the growing commitment of the Government in improving infrastructure (roads, bridges,
airports, rail metros), in the last 5 years many far flung areas now have very good connectivity to the CBD
locations.
The IC note is proposed to be presented every quarter
17
18. Why Karvy Private Wealth?
Open Architecture – Widest array of products
We are an open-architecture firm at two levels – asset class level and product level :
• Offering COMPREHENSIVE choice of investing across all asset classes
• Offering EXTENSIVE choice of multiple products from different product providers under each asset class
Intensive Research
We closely track the historical performance across asset classes, sub-asset classes and product providers to identify, evaluate and
recommend investment products (KPW’s or third-party). We have our own proprietary methodology for evaluating products; for
product providers, we also note the investment style and risk management philosophy. Our comprehensive analysis determines
truly exceptional performers to be added to your portfolio
Honest, unbiased advise
Group-wide, we have no Mutual Fund or Insurance products of our own unlike most of the financial services groups (banks or
broking houses), who are doing wealth management. Neither do we have exclusive tie-up with any single insurance company like
all banks do.
The KPW 3-S Service promise:
When you become a Client of KPW, besides getting intelligent & practicable Investment Advice, you get the benefit of “The KPW 3-
S Service Promise” :
• Smooth and Hassle Free – Attention, Service & Convenience
• Sharp and proactive – Portfolio monitoring and tracking
• Smart –Incisive insights on markets and Investment products
Pedigreed Senior Management Team
A talented team of leaders with global and Indian experience, having a unique blend of backgrounds of wealth management,
private equity, strategy consulting and building businesses powers Karvy Private Wealth and its operations.
18
19. Disclaimer
The information and views presented here are prepared by Karvy Private Wealth or other Karvy Group companies. The information contained
herein is based on our analysis and upon sources that we consider reliable. We, however, do not vouch for the accuracy or the completeness
thereof. This material is for personal information and we are not responsible for any loss incurred based upon it.
The investments discussed or recommended here may not be suitable for all investors. Investors must make their own investment decisions
based on their specific investment objectives and financial position and using such independent advice, as they believe necessary. While acting
upon any information or analysis mentioned here, investors may please note that neither Karvy nor any person connected with any associated
companies of Karvy accepts any liability arising from the use of this information and views mentioned here.
The author, directors and other employees of Karvy and its affiliates may hold long or short positions in the above-mentioned companies from
time to time. Every employee of Karvy and its associated companies are required to disclose their individual stock holdings and details of trades,
if any, that they undertake. The team rendering corporate analysis and investment recommendations are restricted in purchasing/selling of
shares or other securities till such a time this recommendation has either been displayed or has been forwarded to clients of Karvy. All
employees are further restricted to place orders only through Karvy Stock Broking Ltd.
The information given in this document on tax are for guidance only, and should not be construed as tax advice. Investors are advised to consult
their respective tax advisers to understand the specific tax incidence applicable to them. We also expect significant changes in the tax laws once
the new Direct Tax Code is in force – this could change the applicability and incidence of tax on investments
Karvy Private Wealth (A division of Karvy Stock Broking Limited): Operates from within India and is subject to Indian regulations.
Mumbai office Address: 702, Hallmark Business plaza, Sant Dnyaneshwar Marg, Bandra (East), off Bandra Kurla Complex, Mumbai 400 051
(Registered office Address: Karvy Stock Broking Limited, “KARVY HOUSE”, 46, Avenue 4, Street No.1, Banjara Hills, Hyderabad 500 034)
SEBI registration No’s:”NSE(CM):INB230770138, NSE(F&O): INF230770138, BSE: INB010770130, BSE(F&O): INF010770131,NCDEX(00236,
NSE(CDS):INE230770138, NSDL – SEBI Registration No: IN-DP-NSDL-247-2005, CSDL-SEBI Registration No:IN-DP-CSDL-305-2005, PMS Registration
No.: INP000001512”
19
20. Contact Us
Bangalore 080-26606126
Chennai 044-45925923
Delhi 011-43533941
Kochi 0484-2322152
Gurgaon 0124-4780228
Hyderabad 040-44507282
Kolkata 033-40515100
Mumbai 022-33055000
Coimbatore 0422-4291018
Pune 020-30116238
Email: wealth@karvy.com SMS: ‘HNI’ to 56767 Website: www.karvywealth.com
Corporate Office : 702, Hallmark Business Plaza, Off Bandra Kurla Complex, Bandra (East), Mumbai – 400 051
20