Download as PDF, PPTX


![Landing page rating: Low, Average or High
landing
pages quality score q
…
L H
L and H are customisable:
e.g., LOW=[0,25%), AVG=[25%,75%], HIGH=(75%,100%]
2 cut-off points (L, H) that
divide distribution of quality
scores q into 3 regions:
- LOW: q < L
- AVG: L <= q <= H
- HIGH: q > H
(L, H)
ad ratingq LOW](https://image.slidesharecdn.com/big2017-170403130243/75/Advertising-Quality-Science-20-2048.jpg)

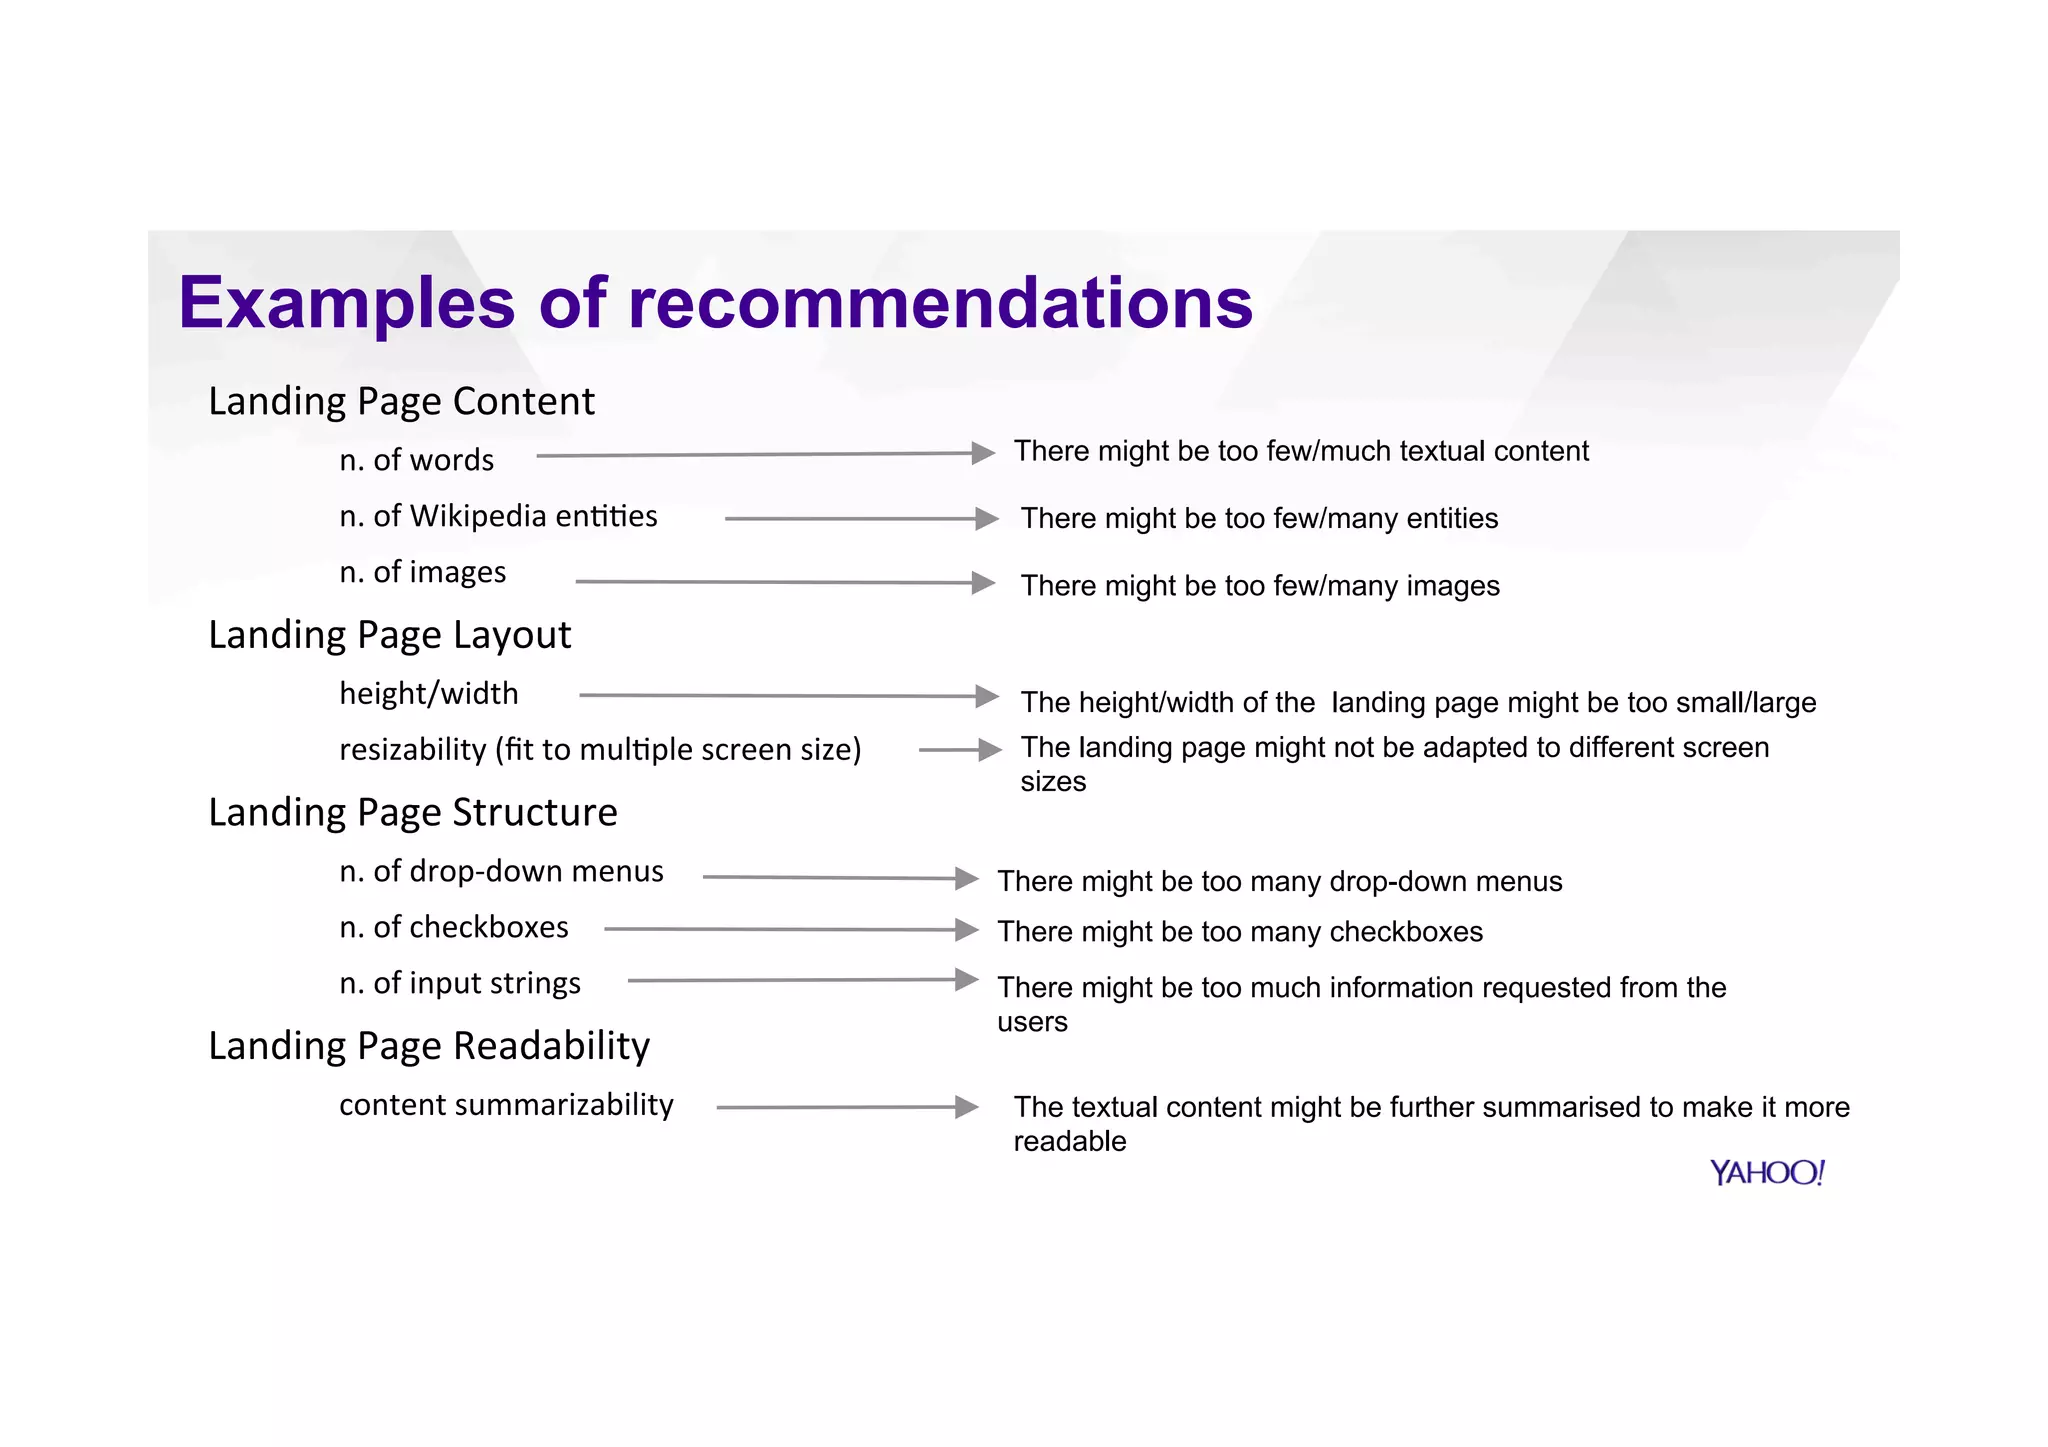
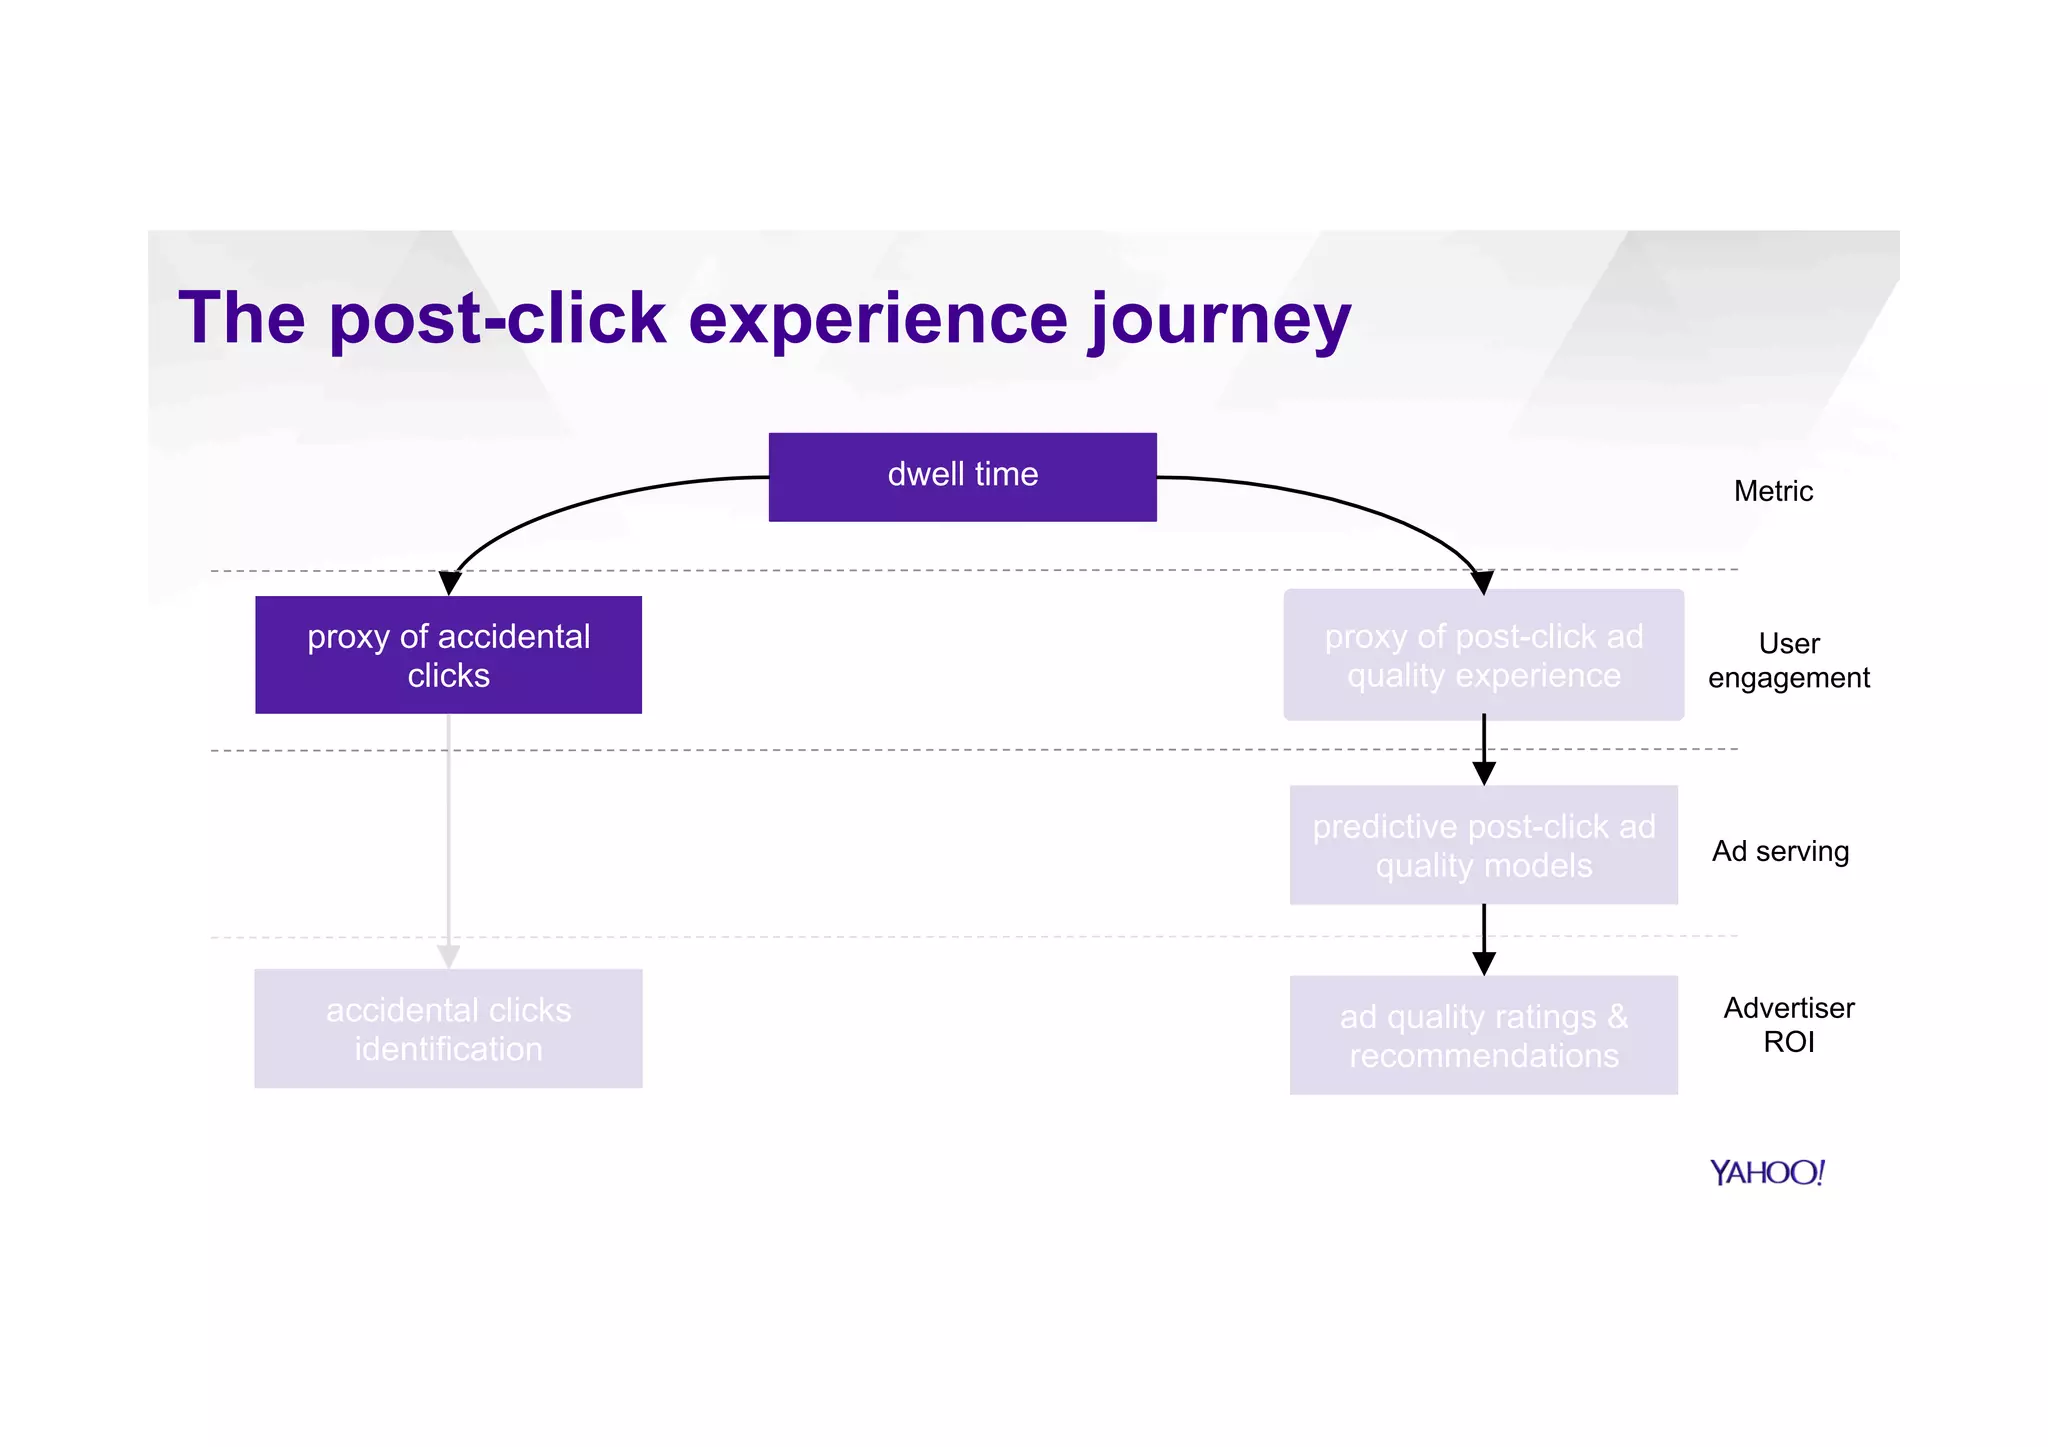

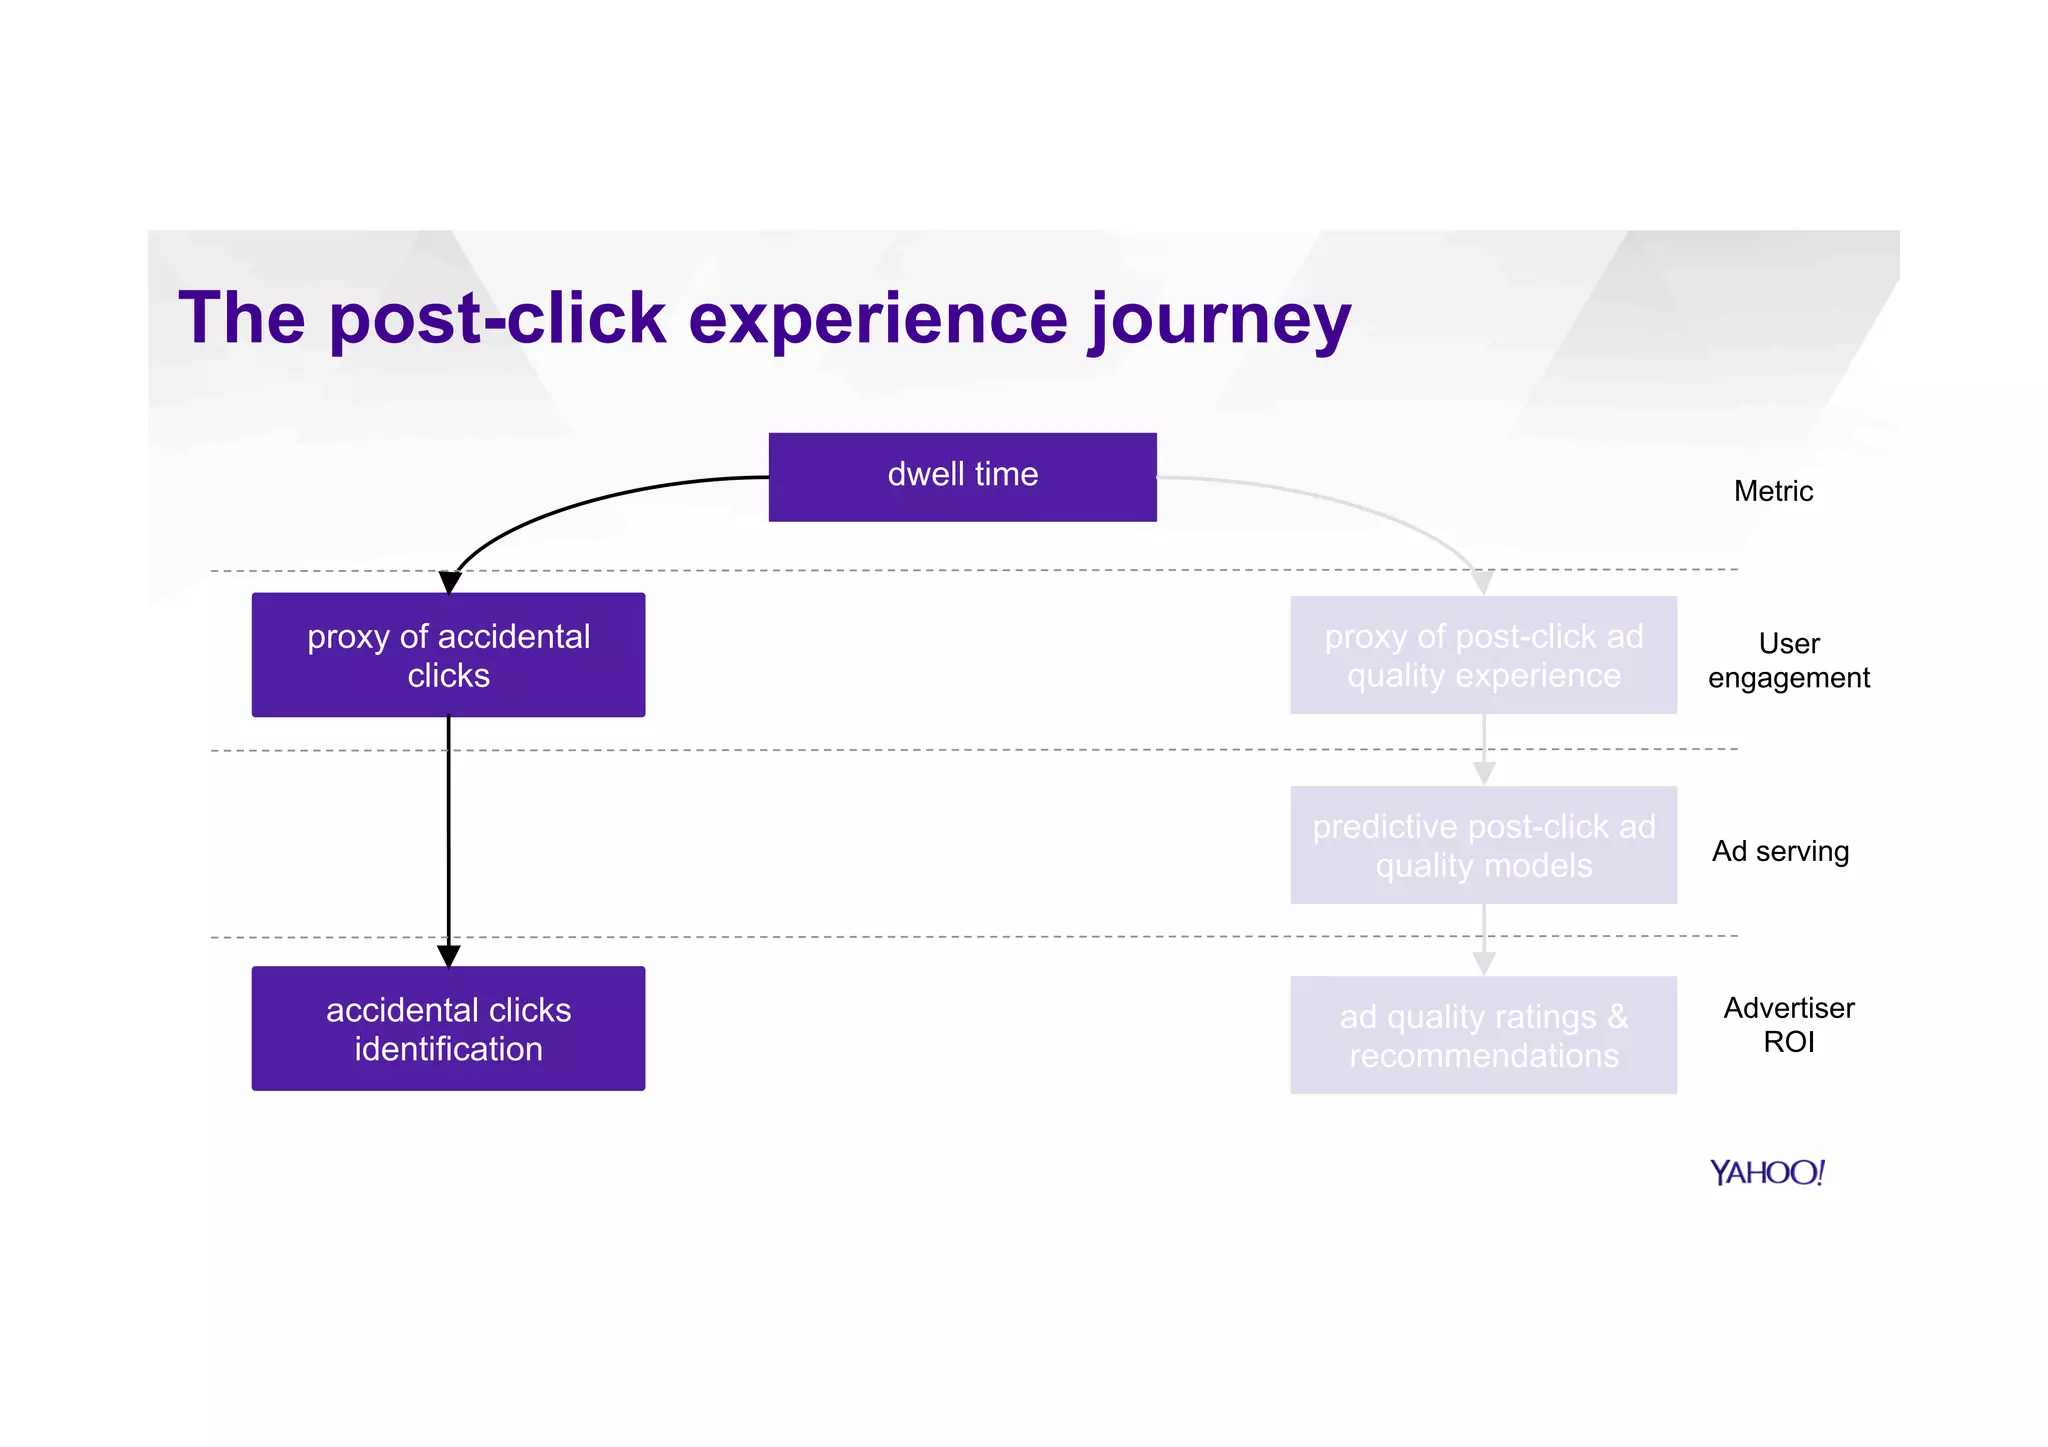


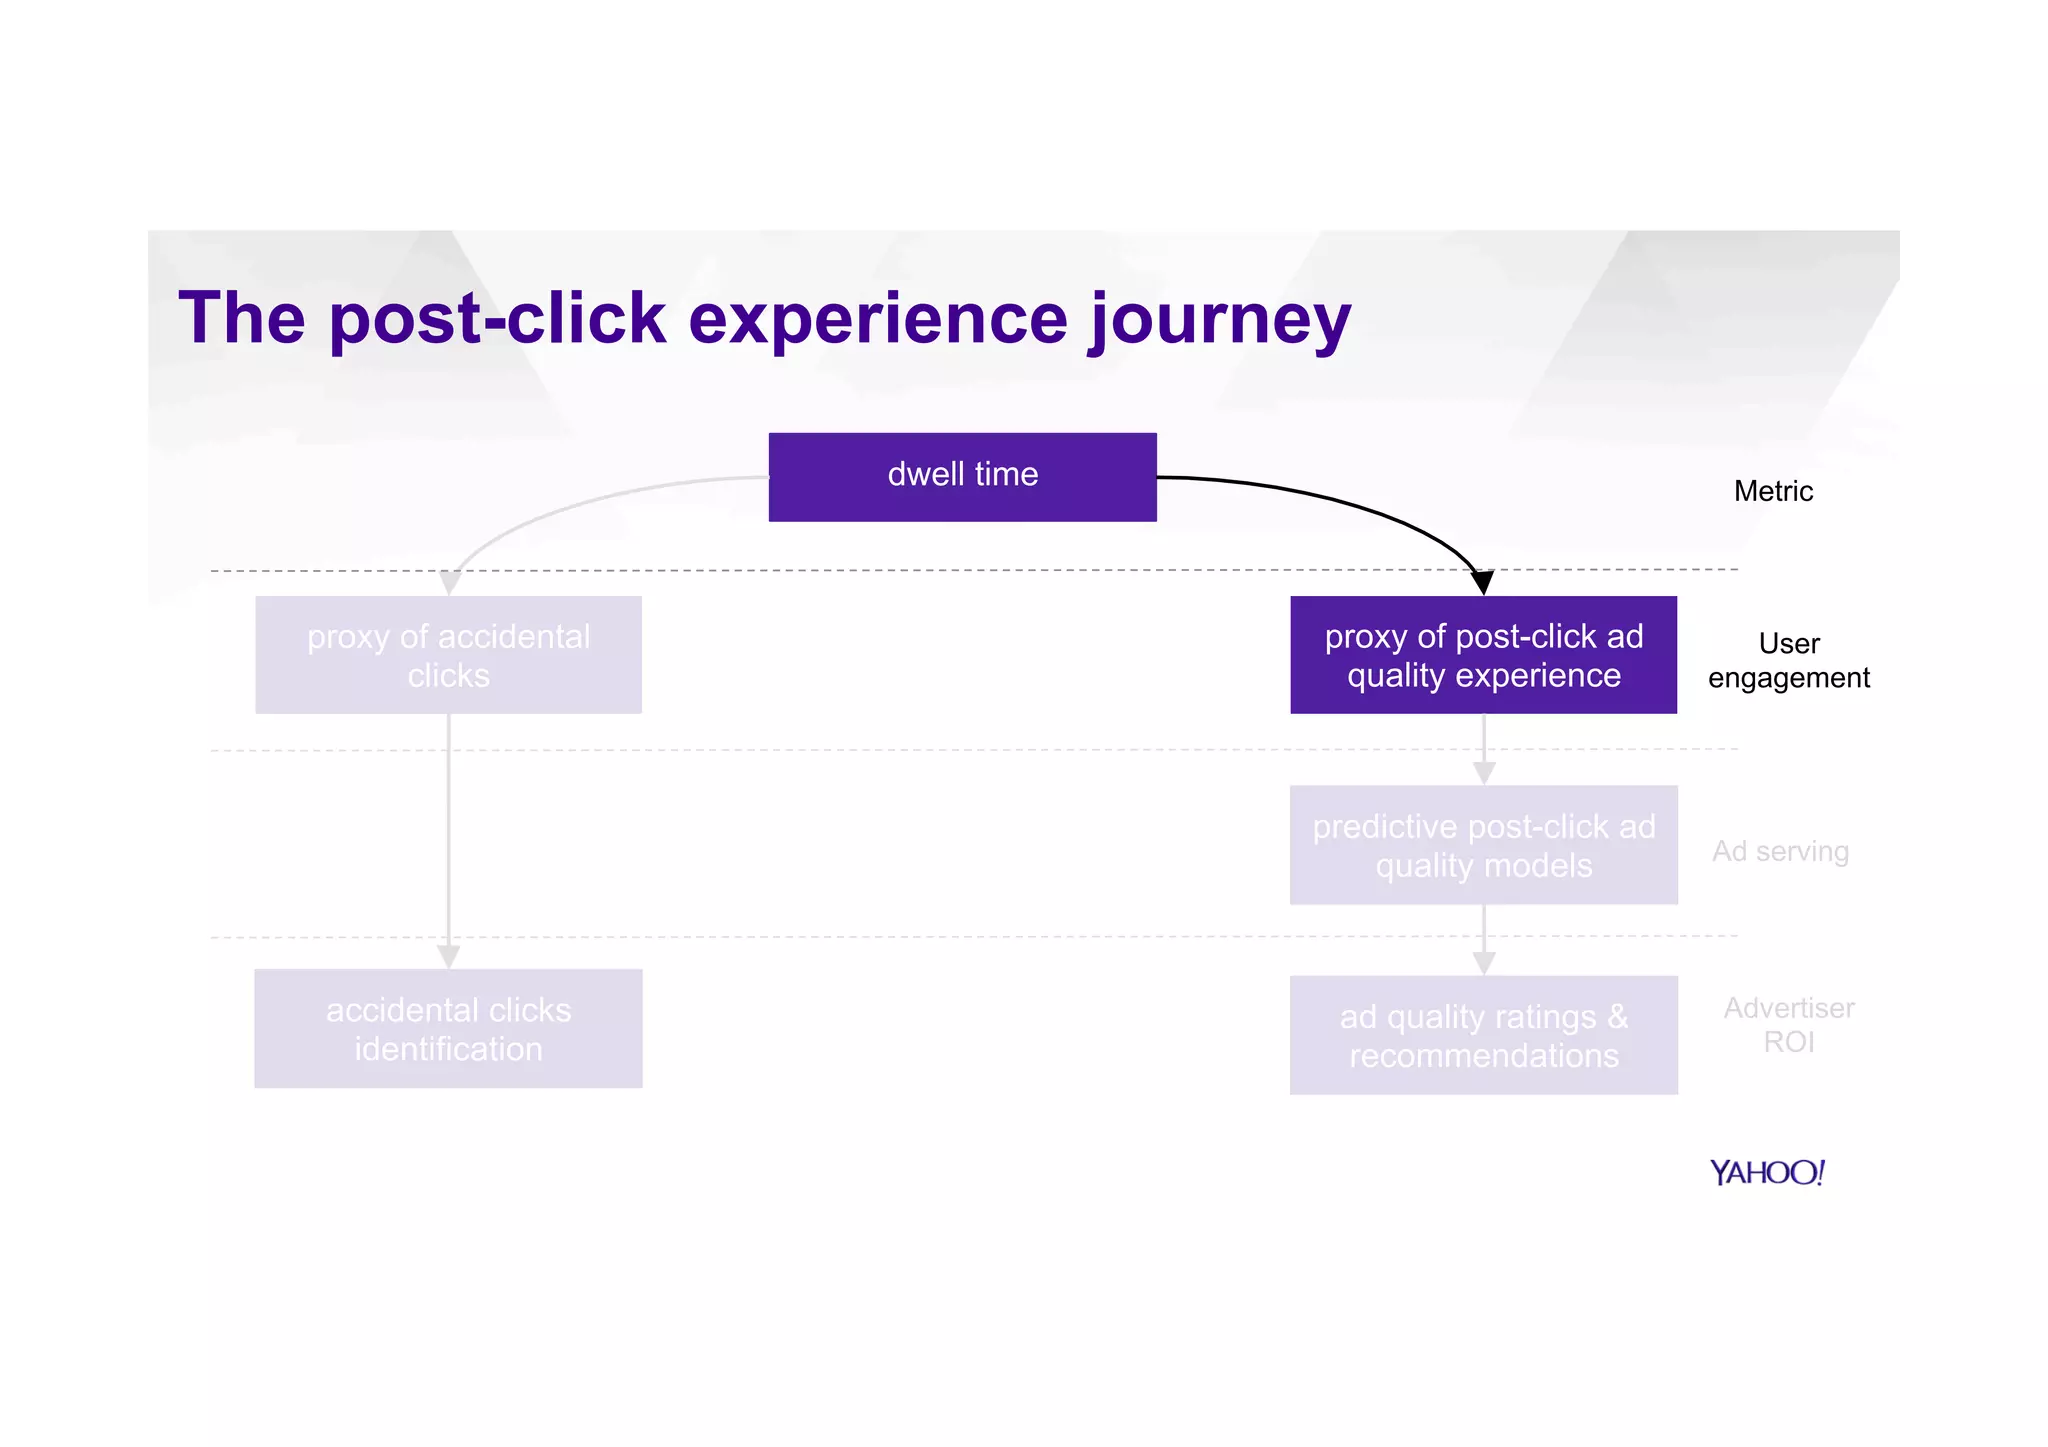
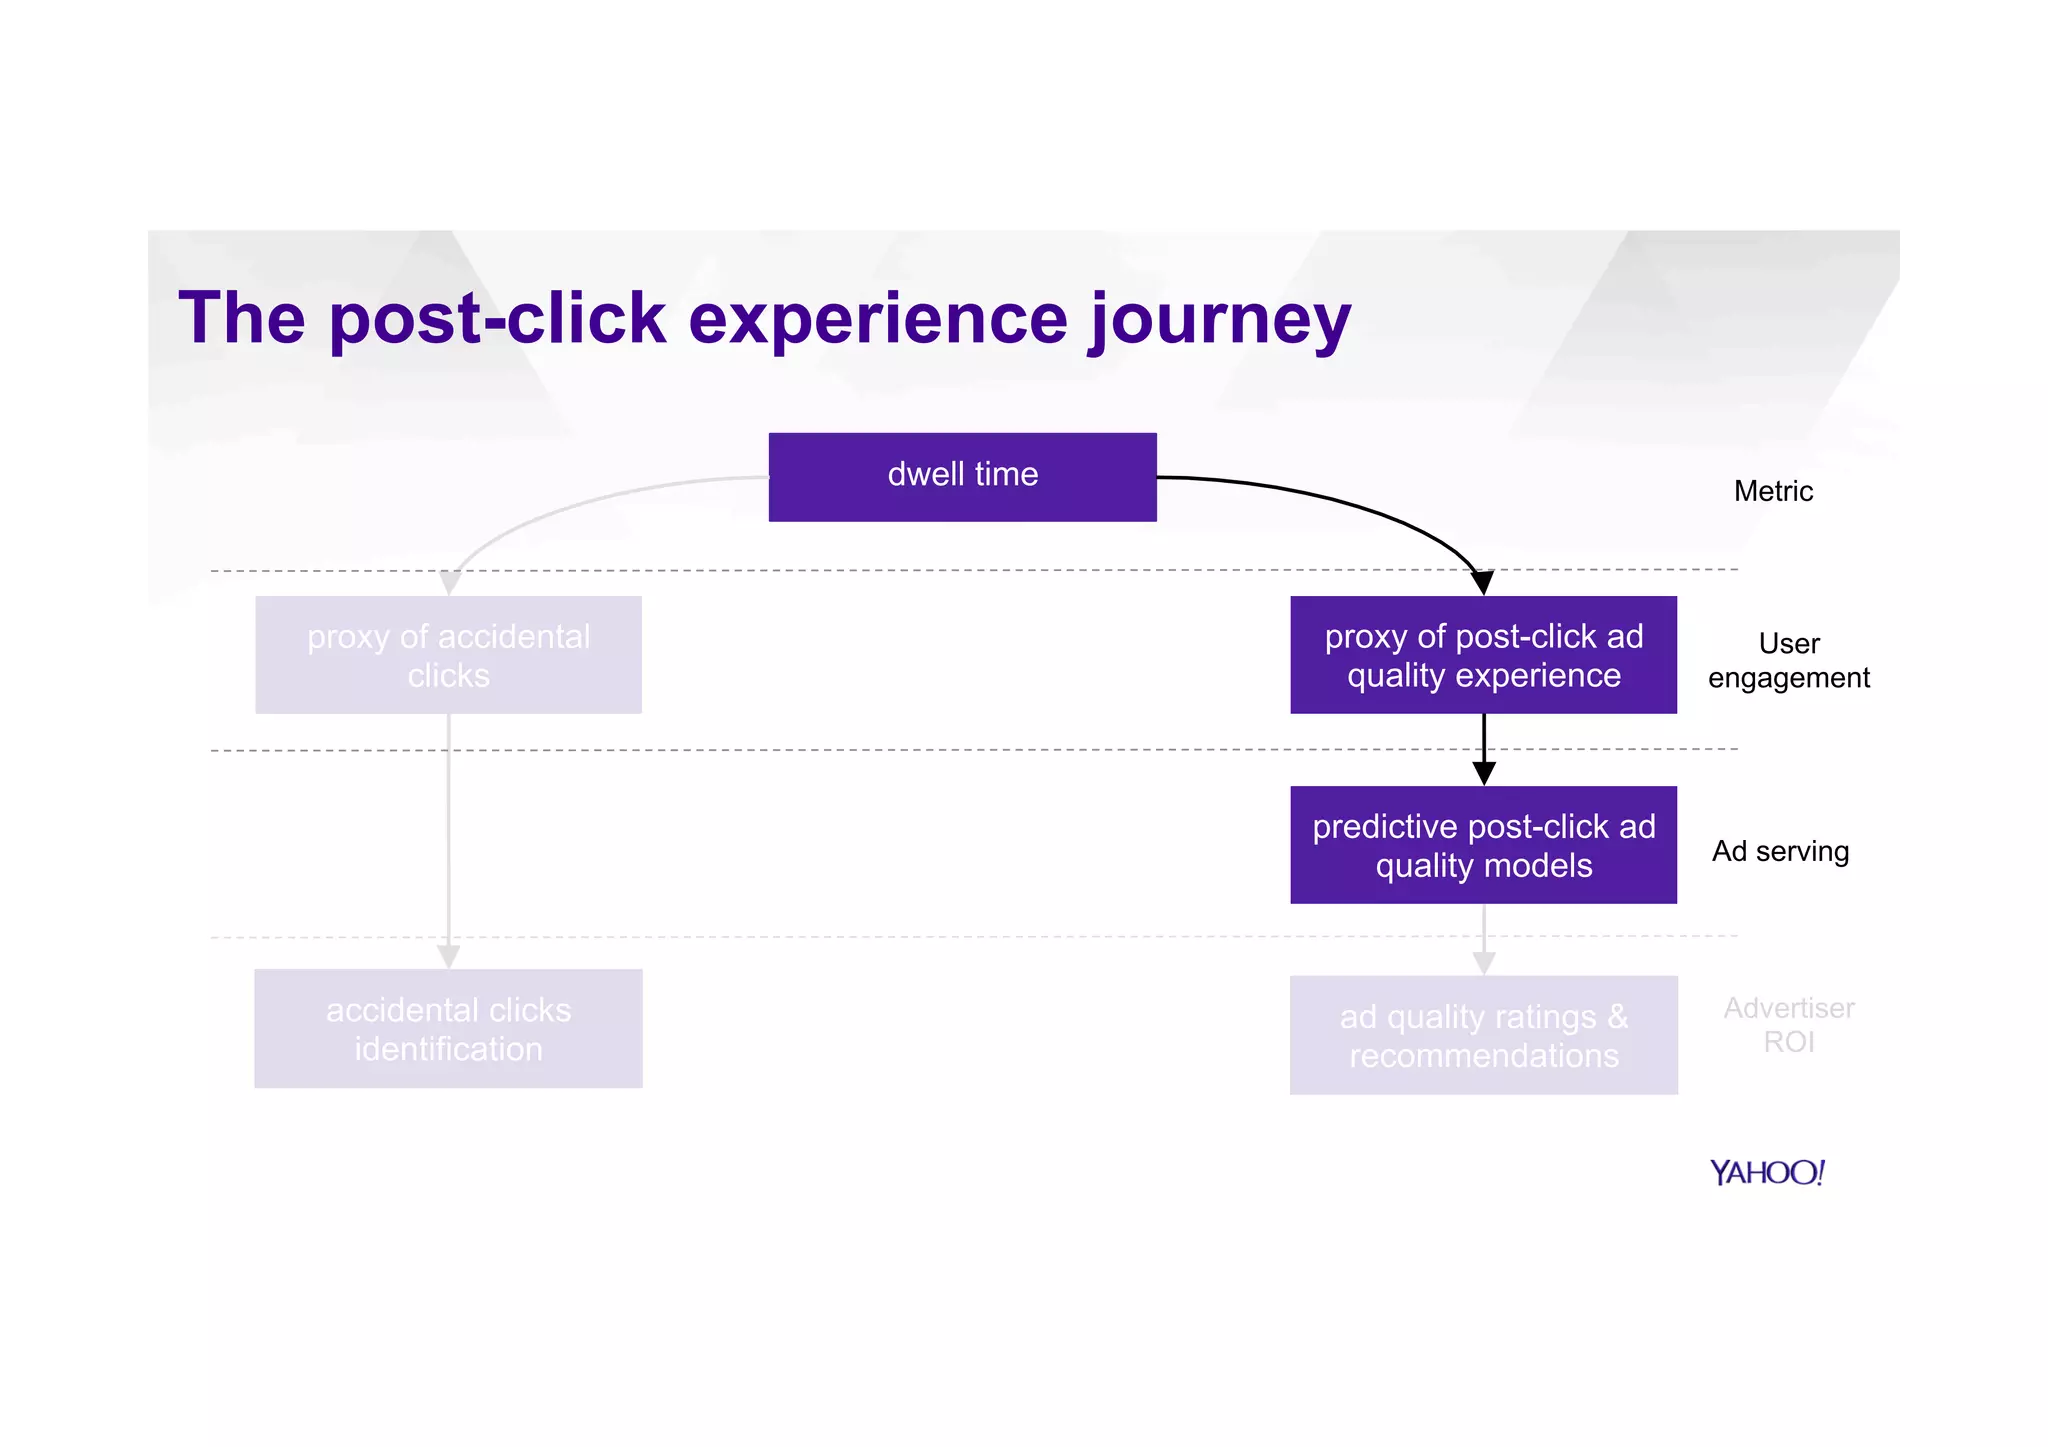
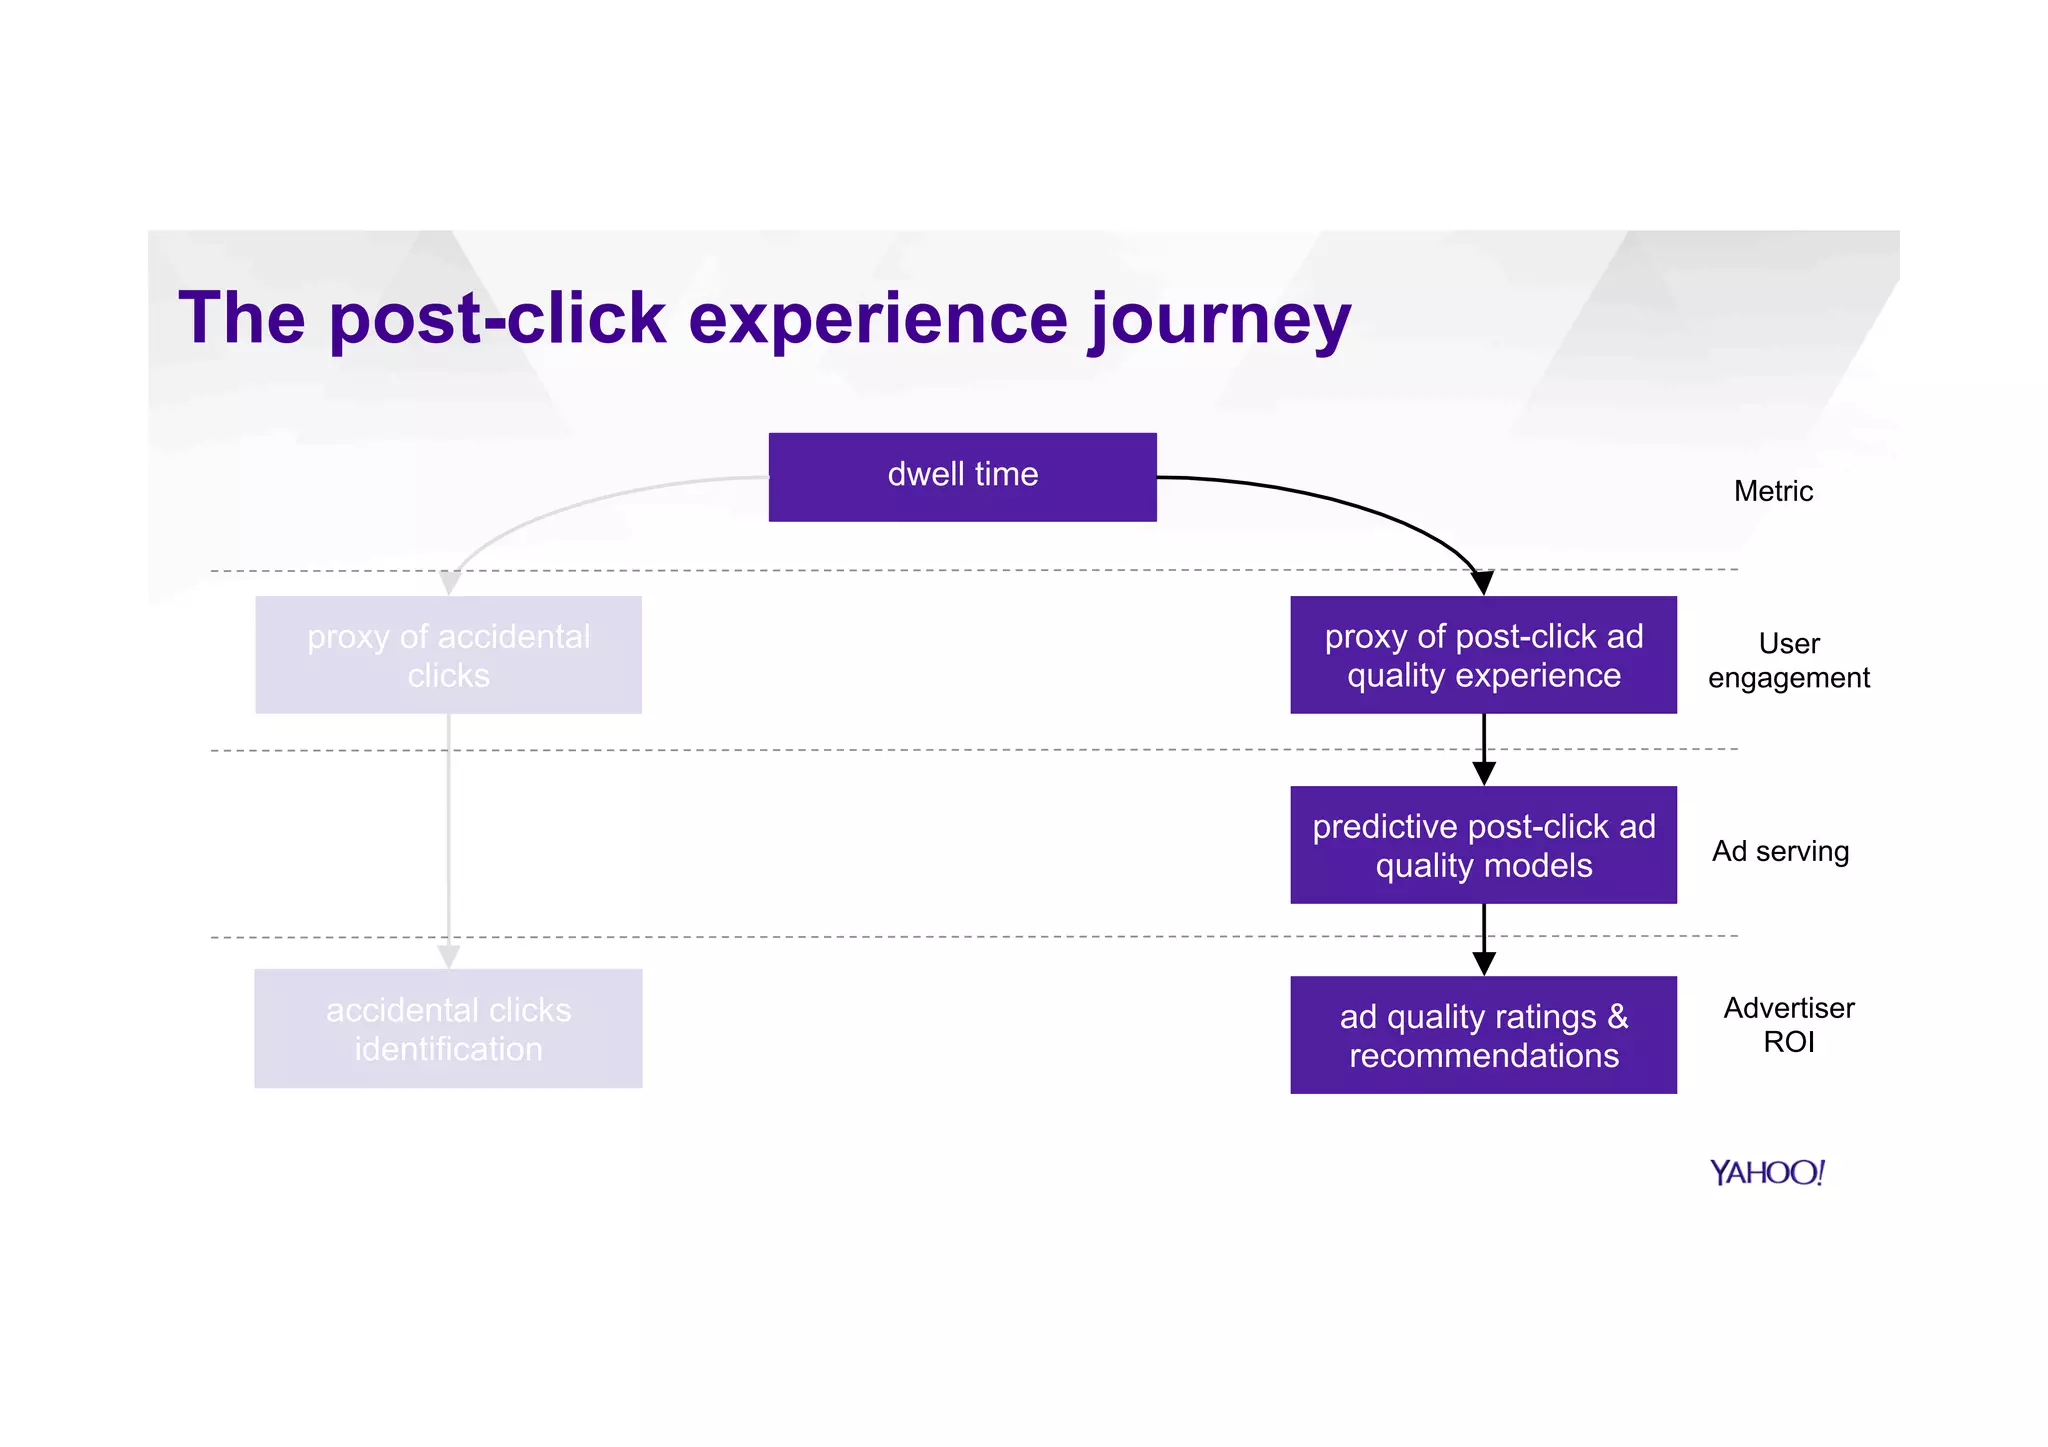
The document discusses a four-year effort at Yahoo focused on enhancing the quality of ads within its native advertising network, Gemini, using large-scale predictive analytics instead of deep learning. It emphasizes the importance of the post-click experience, particularly the quality of landing pages, dwell time, and user engagement which are critical for maximizing revenue and ensuring a positive return on investment for advertisers. The work includes developing predictive models for assessing ad quality, recommending improvements for landing pages, and identifying accidental clicks to better understand user interactions with ads.


![Computer Networks 01[1 using all terms].pptx](https://cdn.slidesharecdn.com/ss_thumbnails/computernetworks011-251214040533-327dd9f8-thumbnail.jpg?width=640&height=640&fit=bounds)


