Downloaded 51 times
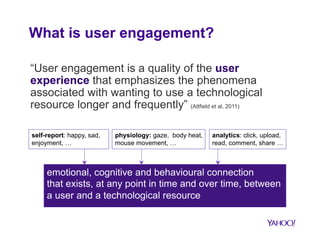
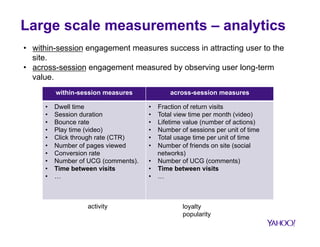
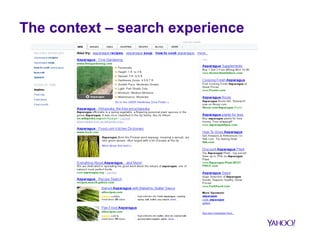
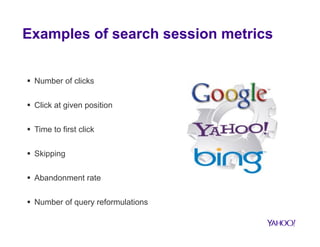
![Time spent between each visit
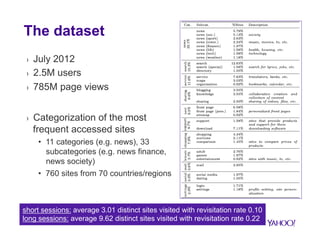
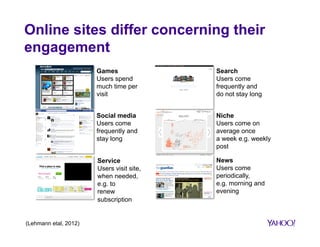
• 50% of sites are revisited after
less than 1min
interruption of a task?
• There are revisits after a long
break
returning to a site to perform a
new task?
1.00
0.75
0.50
0.25
0.00
news (finance)
news (tech)
social media
mail
10ï2 10ï1 100 101 102
Cumulative probability
Absence time [min]
2nd
1st 3rd
… visit
absence time
Metric:
1. CumAct: increases with time spent between visits](https://image.slidesharecdn.com/strata-141117165425-conversion-gate02/85/How-Big-Data-is-Changing-User-Engagement-15-320.jpg)
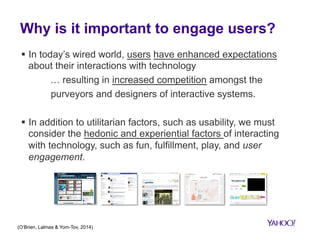
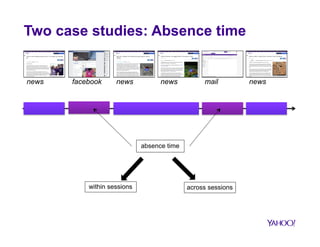
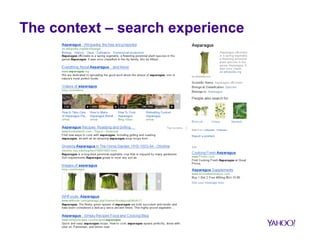
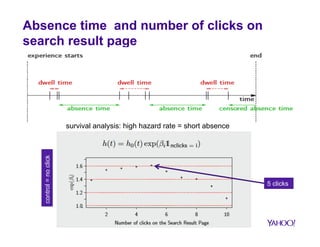
![Models of online multitasking
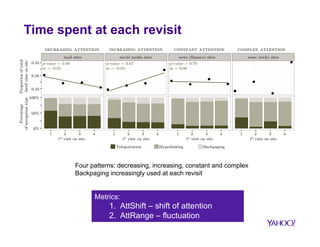
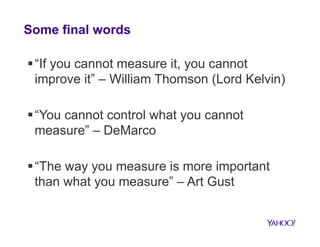
§ Clustering of sites using multitasking and standard engagement
metrics:
› CumAct, AttShift, AttRange
› Visit, Session
§ Five models
C4: 74 sites
0.75
0.25
-0.25
-0.75
C5: 166 sites
0.75
0.25
-0.25
-0.75
C3: 156 sites
0.75
0.25
-0.25
-0.75
C2: 108 sites
0.75
0.25
-0.25
-0.75
C1: 172 sites
0.75
0.25
-0.25
-0.75
Visitdt [min] CumActdt,3 AttShiftdt,4 AttRangedt,4 Sessiondt [min]](https://image.slidesharecdn.com/strata-141117165425-conversion-gate02/85/How-Big-Data-is-Changing-User-Engagement-16-320.jpg)
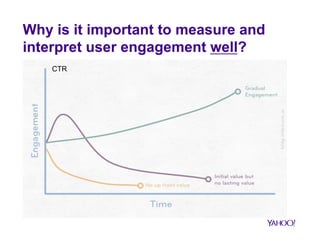
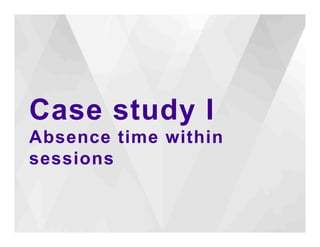
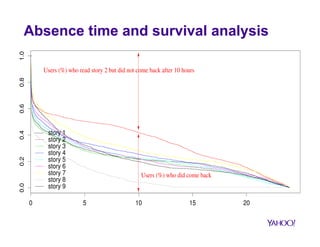
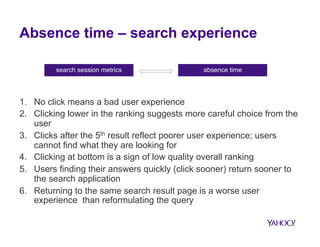
![One task during a session
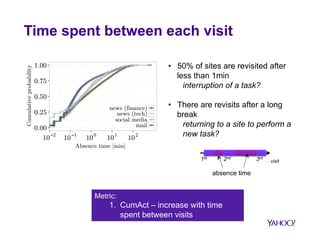
C2: 108 sites
auctions, front page,
shopping, dating
0.75
0.25
-0.25
-0.75
C1: 172 sites
mail, maps, news,
Visitdt [min] CumActdt,3 AttShiftdt,4 AttRangedt,4 Sessiondt [min]
news (soc.)
0.75
0.25
-0.25
-0.75
§ High dwell time per visit and during
entire session
§ Users return to continue a task
(short absence time)
§ C1: attention is shifting to another
site
§ C2: attention is shifting slowly
towards the site](https://image.slidesharecdn.com/strata-141117165425-conversion-gate02/85/How-Big-Data-is-Changing-User-Engagement-17-320.jpg)
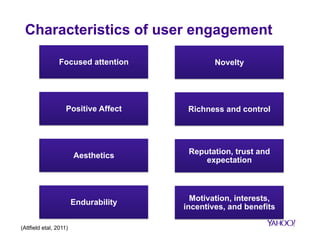
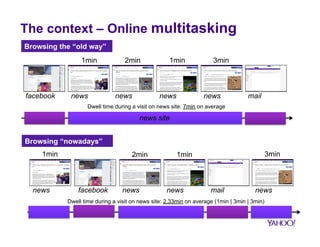
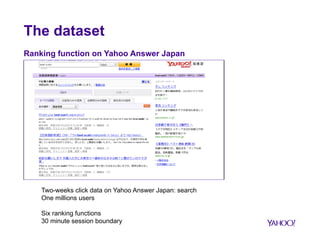
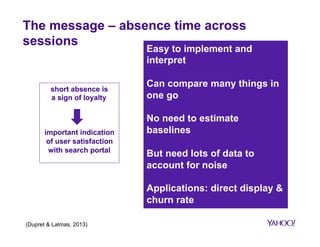
![Several tasks during a session
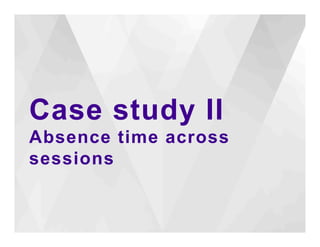
C4: 74 sites
front page, search,
download
C3: 156 sites
auctions, search,
front page, shopping
0.75
0.25
-0.25
-0.75
0.75
0.25
-0.25
-0.75
§ Users perform several tasks during
a session
§ No simple activity pattern
§ C3: Dwell time per visit is low, but
dwell time per session is high
Visitdt [min] CumActdt,3 AttShiftdt,4 AttRangedt,4 Sessiondt [min]](https://image.slidesharecdn.com/strata-141117165425-conversion-gate02/85/How-Big-Data-is-Changing-User-Engagement-18-320.jpg)
![Sites with low activity
C5: 166 sites
service, download,
blogging, news (soc.)
0.75
0.25
-0.25
-0.75
§ Users do not spend a lot of time on
these sites
§ Time between visits is short
§ Attention is shifting towards the site
Visitdt [min] CumActdt,3 AttShiftdt,4 AttRangedt,4 Sessiondt [min]](https://image.slidesharecdn.com/strata-141117165425-conversion-gate02/85/How-Big-Data-is-Changing-User-Engagement-19-320.jpg)
![Browsing behavior can differ between
sites of the same category
C2: 108 sites
auctions, front page,
shopping, dating
0.75
0.25
-0.25
-0.75
C3: 156 sites
auctions, search,
front page, shopping
0.75
0.25
-0.25
-0.75
§ C2: users visit site once to perform
their task
§ C3: users visit site several times to
perform task(s)
Visitdt [min] CumActdt,3 AttShiftdt,4 AttRangedt,4 Sessiondt [min]](https://image.slidesharecdn.com/strata-141117165425-conversion-gate02/85/How-Big-Data-is-Changing-User-Engagement-20-320.jpg)


The document discusses how big data is transforming user engagement by examining definitions, metrics, and case studies associated with user interactions across different online platforms. It highlights the significance of understanding user engagement patterns—both within and across sessions—through various analysis metrics and emphasizes the role of user satisfaction and loyalty. The findings underscore the necessity for accurate measurement to improve the design and functionality of technological resources.