Download as PDF, PPTX

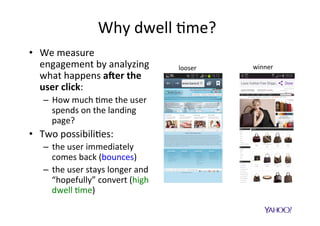
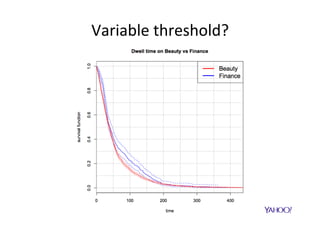
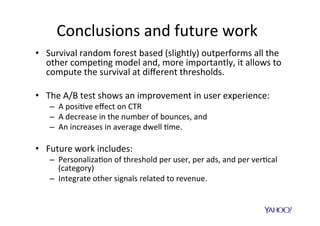

The document discusses improving user engagement on mobile native ads by using survival analysis to estimate post-click engagement metrics such as dwell time. It describes how to select ads based on predicted performance and introduces a survival random forest model, which assesses user retention and engagement. The results demonstrate improved user experience metrics, such as increased click-through rates and reduced bounce rates, highlighting potential for personalized advertising strategies in the future.


