DATA ANALYSIS VERSUSDATA ANALYTICS
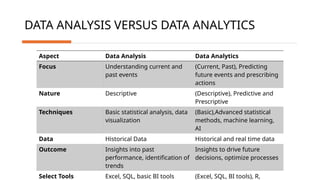
Aspect Data Analysis Data Analytics
Focus Understanding current and
past events
(Current, Past), Predicting
future events and prescribing
actions
Nature Descriptive (Descriptive), Predictive and
Prescriptive
Techniques Basic statistical analysis, data
visualization
(Basic),Advanced statistical
methods, machine learning,
AI
Data Historical Data Historical and real time data
Outcome Insights into past
performance, identification of
trends
Insights to drive future
decisions, optimize processes
Select Tools Excel, SQL, basic BI tools (Excel, SQL, BI tools), R,
4.
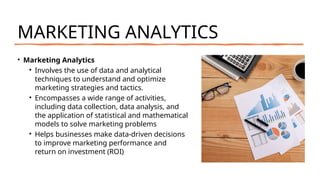
MARKETING ANALYTICS
• MarketingAnalytics
• Involves the use of data and analytical
techniques to understand and optimize
marketing strategies and tactics.
• Encompasses a wide range of activities,
including data collection, data analysis, and
the application of statistical and mathematical
models to solve marketing problems
• Helps businesses make data-driven decisions
to improve marketing performance and
return on investment (ROI)
5.
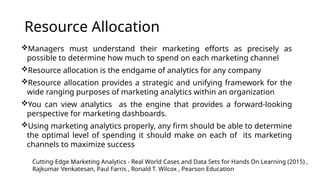
Resource Allocation
Managers mustunderstand their marketing efforts as precisely as
possible to determine how much to spend on each marketing channel
Resource allocation is the endgame of analytics for any company
Resource allocation provides a strategic and unifying framework for the
wide ranging purposes of marketing analytics within an organization
You can view analytics as the engine that provides a forward-looking
perspective for marketing dashboards.
Using marketing analytics properly, any firm should be able to determine
the optimal level of spending it should make on each of its marketing
channels to maximize success
Cutting-Edge Marketing Analytics - Real World Cases and Data Sets for Hands On Learning (2015) ,
Rajkumar Venkatesan, Paul Farris , Ronald T. Wilcox , Pearson Education
6.
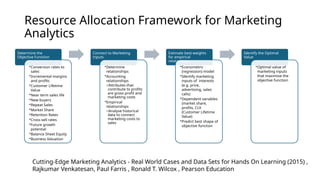
Resource Allocation Frameworkfor Marketing
Analytics
Determine the
Objective Function
•Conversion rates to
sales
•Incremental margins
and profits
•Customer Lifetime
Value
•Near term sales life
•New buyers
•Repeat Sales
•Market Share
•Retention Rates
•Cross-sell rates
•Future growth
potential
•Balance Sheet Equity
•Business Valuation
Connect to Marketing
inputs
•Determine
relationships
•Accounting
relationships
oAttributes that
contribute to profits
are gross profit and
marketing costs
•Empirical
relationships
oAnalyse historical
data to connect
marketing costs to
sales
Estimate best weights
for empirical
relatonships
•Econometric
(regression) model
•Identify marketing
inputs of interests
(e.g. price,
advertising, sales
calls)
•Dependent variables
(market share,
profits, CLV
(Customer Lifetime
Value)
•Predict best shape of
objective function
Identify the Optimal
Value
•Optimal value of
marketing inputs
that maximise the
objective function
Cutting-Edge Marketing Analytics - Real World Cases and Data Sets for Hands On Learning (2015) ,
Rajkumar Venkatesan, Paul Farris , Ronald T. Wilcox , Pearson Education
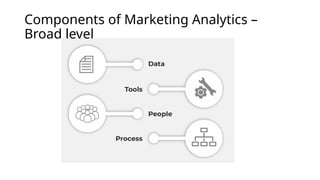
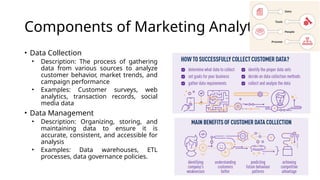
Components of MarketingAnalytics
• Data Collection
• Description: The process of gathering
data from various sources to analyze
customer behavior, market trends, and
campaign performance
• Examples: Customer surveys, web
analytics, transaction records, social
media data
• Data Management
• Description: Organizing, storing, and
maintaining data to ensure it is
accurate, consistent, and accessible for
analysis
• Examples: Data warehouses, ETL
processes, data governance policies.
9.
Components of MarketingAnalytics
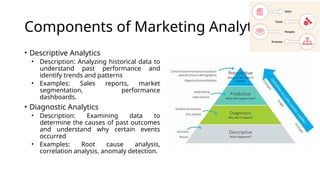
• Descriptive Analytics
• Description: Analyzing historical data to
understand past performance and
identify trends and patterns
• Examples: Sales reports, market
segmentation, performance
dashboards.
• Diagnostic Analytics
• Description: Examining data to
determine the causes of past outcomes
and understand why certain events
occurred
• Examples: Root cause analysis,
correlation analysis, anomaly detection.
10.
Components of MarketingAnalytics
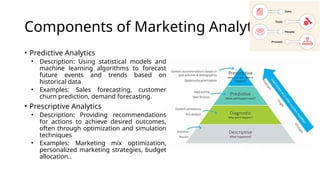
• Predictive Analytics
• Description: Using statistical models and
machine learning algorithms to forecast
future events and trends based on
historical data
• Examples: Sales forecasting, customer
churn prediction, demand forecasting.
• Prescriptive Analytics
• Description: Providing recommendations
for actions to achieve desired outcomes,
often through optimization and simulation
techniques
• Examples: Marketing mix optimization,
personalized marketing strategies, budget
allocation..
11.
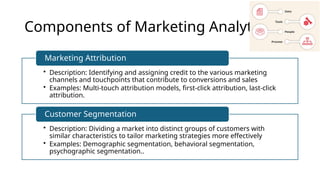
Components of MarketingAnalytics
• Description: Identifying and assigning credit to the various marketing
channels and touchpoints that contribute to conversions and sales
• Examples: Multi-touch attribution models, first-click attribution, last-click
attribution.
Marketing Attribution
• Description: Dividing a market into distinct groups of customers with
similar characteristics to tailor marketing strategies more effectively
• Examples: Demographic segmentation, behavioral segmentation,
psychographic segmentation..
Customer Segmentation
12.
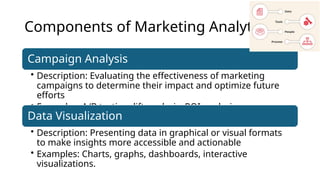
Components of MarketingAnalytics
Campaign Analysis
• Description: Evaluating the effectiveness of marketing
campaigns to determine their impact and optimize future
efforts
• Examples: A/B testing, lift analysis, ROI analysis.
Data Visualization
• Description: Presenting data in graphical or visual formats
to make insights more accessible and actionable
• Examples: Charts, graphs, dashboards, interactive
visualizations.
13.
Components of MarketingAnalytics
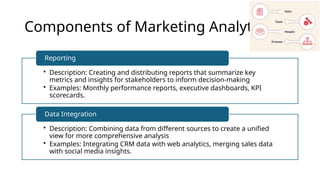
• Description: Creating and distributing reports that summarize key
metrics and insights for stakeholders to inform decision-making
• Examples: Monthly performance reports, executive dashboards, KPI
scorecards.
Reporting
• Description: Combining data from different sources to create a unified
view for more comprehensive analysis
• Examples: Integrating CRM data with web analytics, merging sales data
with social media insights.
Data Integration
14.
Applications of
Marketing
Analytics
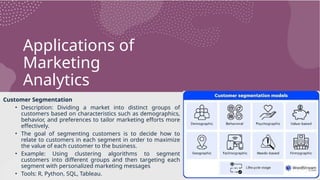
Customer Segmentation
•Description: Dividing a market into distinct groups of
customers based on characteristics such as demographics,
behavior, and preferences to tailor marketing efforts more
effectively.
• The goal of segmenting customers is to decide how to
relate to customers in each segment in order to maximize
the value of each customer to the business.
• Example: Using clustering algorithms to segment
customers into different groups and then targeting each
segment with personalized marketing messages
• Tools: R, Python, SQL, Tableau.
15.
Applications of
Marketing
Analytics
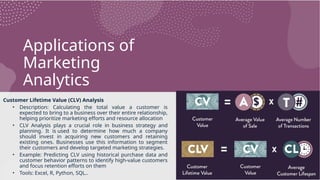
Customer LifetimeValue (CLV) Analysis
• Description: Calculating the total value a customer is
expected to bring to a business over their entire relationship,
helping prioritize marketing efforts and resource allocation
• CLV Analysis plays a crucial role in business strategy and
planning. It is used to determine how much a company
should invest in acquiring new customers and retaining
existing ones. Businesses use this information to segment
their customers and develop targeted marketing strategies.
• Example: Predicting CLV using historical purchase data and
customer behavior patterns to identify high-value customers
and focus retention efforts on them
• Tools: Excel, R, Python, SQL..
16.
Applications of
Marketing
Analytics
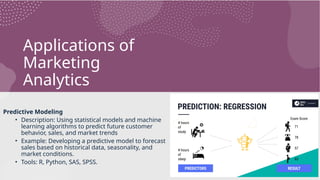
Predictive Modeling
•Description: Using statistical models and machine
learning algorithms to predict future customer
behavior, sales, and market trends
• Example: Developing a predictive model to forecast
sales based on historical data, seasonality, and
market conditions.
• Tools: R, Python, SAS, SPSS.
17.
Applications of
Marketing
Analytics
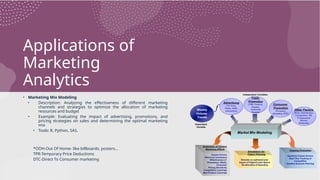
• MarketingMix Modeling
• Description: Analyzing the effectiveness of different marketing
channels and strategies to optimize the allocation of marketing
resources and budget
• Example: Evaluating the impact of advertising, promotions, and
pricing strategies on sales and determining the optimal marketing
mix
• Tools: R, Python, SAS.
*OOH-Out Of Home- like billboards, posters…
TPR-Temporary Price Deductions
DTC-Direct To Consumer marketing
18.
Applications of
Marketing
Analytics
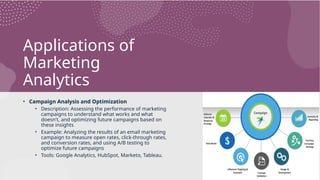
• CampaignAnalysis and Optimization
• Description: Assessing the performance of marketing
campaigns to understand what works and what
doesn't, and optimizing future campaigns based on
these insights
• Example: Analyzing the results of an email marketing
campaign to measure open rates, click-through rates,
and conversion rates, and using A/B testing to
optimize future campaigns
• Tools: Google Analytics, HubSpot, Marketo, Tableau.
19.
Applications of
Marketing
Analytics
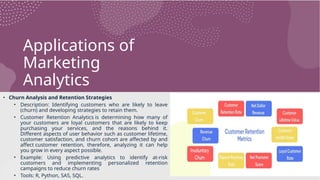
• ChurnAnalysis and Retention Strategies
• Description: Identifying customers who are likely to leave
(churn) and developing strategies to retain them.
• Customer Retention Analytics is determining how many of
your customers are loyal customers that are likely to keep
purchasing your services, and the reasons behind it.
Different aspects of user behavior such as customer lifetime,
customer satisfaction, and churn cohort are affected by and
affect customer retention, therefore, analyzing it can help
you grow in every aspect possible.
• Example: Using predictive analytics to identify at-risk
customers and implementing personalized retention
campaigns to reduce churn rates
• Tools: R, Python, SAS, SQL.
20.
Applications of
Marketing
Analytics
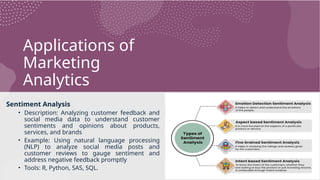
Sentiment Analysis
•Description: Analyzing customer feedback and
social media data to understand customer
sentiments and opinions about products,
services, and brands
• Example: Using natural language processing
(NLP) to analyze social media posts and
customer reviews to gauge sentiment and
address negative feedback promptly
• Tools: R, Python, SAS, SQL.
21.
Applications of
Marketing
Analytics
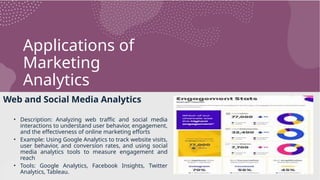
Web andSocial Media Analytics
• Description: Analyzing web traffic and social media
interactions to understand user behavior, engagement,
and the effectiveness of online marketing efforts
• Example: Using Google Analytics to track website visits,
user behavior, and conversion rates, and using social
media analytics tools to measure engagement and
reach
• Tools: Google Analytics, Facebook Insights, Twitter
Analytics, Tableau.
22.
Applications of
Marketing
Analytics
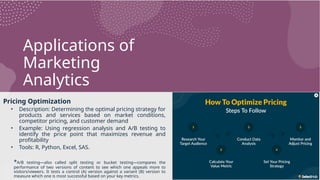
Pricing Optimization
•Description: Determining the optimal pricing strategy for
products and services based on market conditions,
competitor pricing, and customer demand
• Example: Using regression analysis and A/B testing to
identify the price point that maximizes revenue and
profitability
• Tools: R, Python, Excel, SAS.
*A/B testing—also called split testing or bucket testing—compares the
performance of two versions of content to see which one appeals more to
visitors/viewers. It tests a control (A) version against a variant (B) version to
measure which one is most successful based on your key metrics.
23.
Applications of
Marketing
Analytics
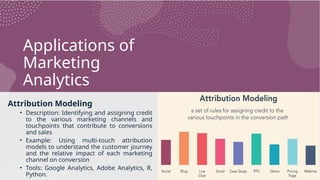
Attribution Modeling
•Description: Identifying and assigning credit
to the various marketing channels and
touchpoints that contribute to conversions
and sales
• Example: Using multi-touch attribution
models to understand the customer journey
and the relative impact of each marketing
channel on conversion
• Tools: Google Analytics, Adobe Analytics, R,
Python.
24.
Applications of
Marketing
Analytics
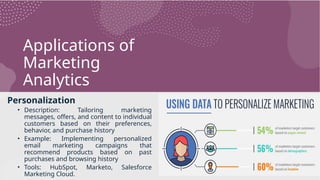
Personalization
• Description:Tailoring marketing
messages, offers, and content to individual
customers based on their preferences,
behavior, and purchase history
• Example: Implementing personalized
email marketing campaigns that
recommend products based on past
purchases and browsing history
• Tools: HubSpot, Marketo, Salesforce
Marketing Cloud.
25.
Applications of
Marketing
Analytics
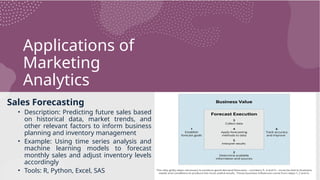
Sales Forecasting
•Description: Predicting future sales based
on historical data, market trends, and
other relevant factors to inform business
planning and inventory management
• Example: Using time series analysis and
machine learning models to forecast
monthly sales and adjust inventory levels
accordingly
• Tools: R, Python, Excel, SAS
26.
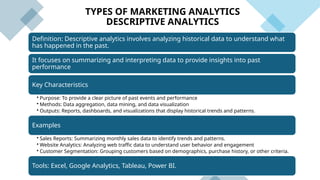
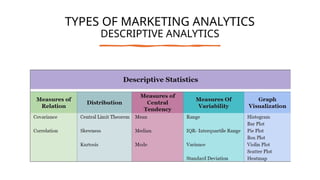
TYPES OF MARKETINGANALYTICS
DESCRIPTIVE ANALYTICS
Definition: Descriptive analytics involves analyzing historical data to understand what
has happened in the past.
It focuses on summarizing and interpreting data to provide insights into past
performance
Key Characteristics
• Purpose: To provide a clear picture of past events and performance
• Methods: Data aggregation, data mining, and data visualization
• Outputs: Reports, dashboards, and visualizations that display historical trends and patterns.
Examples
• Sales Reports: Summarizing monthly sales data to identify trends and patterns.
• Website Analytics: Analyzing web traffic data to understand user behavior and engagement
• Customer Segmentation: Grouping customers based on demographics, purchase history, or other criteria.
Tools: Excel, Google Analytics, Tableau, Power BI.
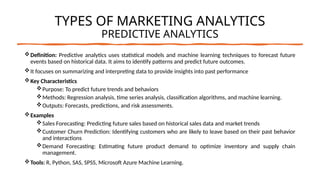
TYPES OF MARKETINGANALYTICS
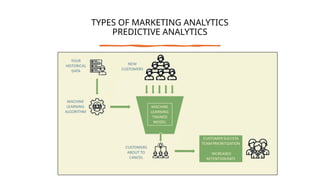
PREDICTIVE ANALYTICS
Definition: Predictive analytics uses statistical models and machine learning techniques to forecast future
events based on historical data. It aims to identify patterns and predict future outcomes.
It focuses on summarizing and interpreting data to provide insights into past performance
Key Characteristics
Purpose: To predict future trends and behaviors
Methods: Regression analysis, time series analysis, classification algorithms, and machine learning.
Outputs: Forecasts, predictions, and risk assessments.
Examples
Sales Forecasting: Predicting future sales based on historical sales data and market trends
Customer Churn Prediction: Identifying customers who are likely to leave based on their past behavior
and interactions
Demand Forecasting: Estimating future product demand to optimize inventory and supply chain
management.
Tools: R, Python, SAS, SPSS, Microsoft Azure Machine Learning.
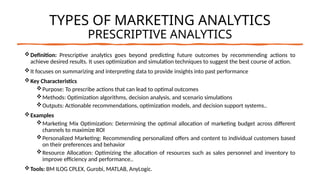
TYPES OF MARKETINGANALYTICS
PRESCRIPTIVE ANALYTICS
Definition: Prescriptive analytics goes beyond predicting future outcomes by recommending actions to
achieve desired results. It uses optimization and simulation techniques to suggest the best course of action.
It focuses on summarizing and interpreting data to provide insights into past performance
Key Characteristics
Purpose: To prescribe actions that can lead to optimal outcomes
Methods: Optimization algorithms, decision analysis, and scenario simulations
Outputs: Actionable recommendations, optimization models, and decision support systems..
Examples
Marketing Mix Optimization: Determining the optimal allocation of marketing budget across different
channels to maximize ROI
Personalized Marketing: Recommending personalized offers and content to individual customers based
on their preferences and behavior
Resource Allocation: Optimizing the allocation of resources such as sales personnel and inventory to
improve efficiency and performance..
Tools: BM ILOG CPLEX, Gurobi, MATLAB, AnyLogic.
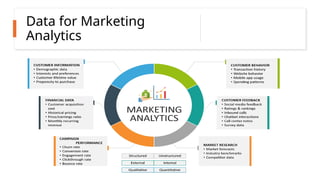
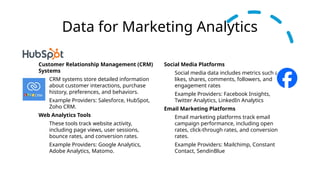
Data for MarketingAnalytics
Customer Relationship Management (CRM)
Systems
CRM systems store detailed information
about customer interactions, purchase
history, preferences, and behaviors.
Example Providers: Salesforce, HubSpot,
Zoho CRM.
Web Analytics Tools
These tools track website activity,
including page views, user sessions,
bounce rates, and conversion rates.
Example Providers: Google Analytics,
Adobe Analytics, Matomo.
Social Media Platforms
Social media data includes metrics such as
likes, shares, comments, followers, and
engagement rates
Example Providers: Facebook Insights,
Twitter Analytics, LinkedIn Analytics
Email Marketing Platforms
Email marketing platforms track email
campaign performance, including open
rates, click-through rates, and conversion
rates.
Example Providers: Mailchimp, Constant
Contact, SendinBlue
33.
Data for MarketingAnalytics
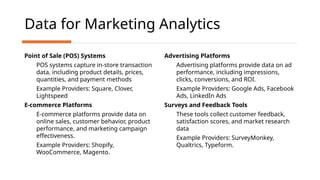
Point of Sale (POS) Systems
POS systems capture in-store transaction
data, including product details, prices,
quantities, and payment methods
Example Providers: Square, Clover,
Lightspeed
E-commerce Platforms
E-commerce platforms provide data on
online sales, customer behavior, product
performance, and marketing campaign
effectiveness.
Example Providers: Shopify,
WooCommerce, Magento.
Advertising Platforms
Advertising platforms provide data on ad
performance, including impressions,
clicks, conversions, and ROI.
Example Providers: Google Ads, Facebook
Ads, LinkedIn Ads
Surveys and Feedback Tools
These tools collect customer feedback,
satisfaction scores, and market research
data
Example Providers: SurveyMonkey,
Qualtrics, Typeform.
34.
Data for MarketingAnalytics
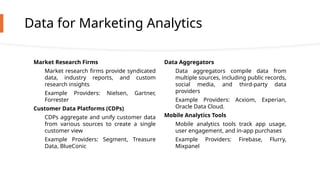
Market Research Firms
Market research firms provide syndicated
data, industry reports, and custom
research insights
Example Providers: Nielsen, Gartner,
Forrester
Customer Data Platforms (CDPs)
CDPs aggregate and unify customer data
from various sources to create a single
customer view
Example Providers: Segment, Treasure
Data, BlueConic
Data Aggregators
Data aggregators compile data from
multiple sources, including public records,
social media, and third-party data
providers
Example Providers: Acxiom, Experian,
Oracle Data Cloud.
Mobile Analytics Tools
Mobile analytics tools track app usage,
user engagement, and in-app purchases
Example Providers: Firebase, Flurry,
Mixpanel
35.
Data for MarketingAnalytics
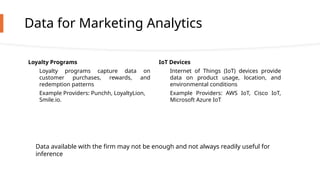
Loyalty Programs
Loyalty programs capture data on
customer purchases, rewards, and
redemption patterns
Example Providers: Punchh, LoyaltyLion,
Smile.io.
IoT Devices
Internet of Things (IoT) devices provide
data on product usage, location, and
environmental conditions
Example Providers: AWS IoT, Cisco IoT,
Microsoft Azure IoT
Data available with the firm may not be enough and not always readily useful for
inference
36.
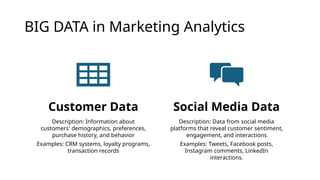
BIG DATA inMarketing Analytics
Customer Data
Description: Information about
customers' demographics, preferences,
purchase history, and behavior
Examples: CRM systems, loyalty programs,
transaction records
Social Media Data
Description: Data from social media
platforms that reveal customer sentiment,
engagement, and interactions
Examples: Tweets, Facebook posts,
Instagram comments, LinkedIn
interactions.
37.
BIG DATA inMarketing
Analytics
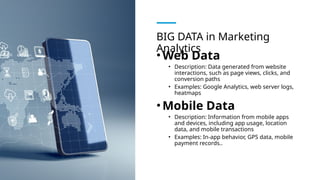
•Web Data
• Description: Data generated from website
interactions, such as page views, clicks, and
conversion paths
• Examples: Google Analytics, web server logs,
heatmaps
•Mobile Data
• Description: Information from mobile apps
and devices, including app usage, location
data, and mobile transactions
• Examples: In-app behavior, GPS data, mobile
payment records..
38.
BIG DATA inMarketing Analytics
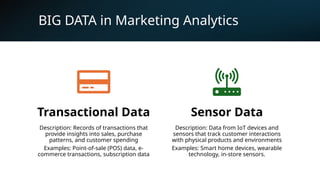
Transactional Data
Description: Records of transactions that
provide insights into sales, purchase
patterns, and customer spending
Examples: Point-of-sale (POS) data, e-
commerce transactions, subscription data
Sensor Data
Description: Data from IoT devices and
sensors that track customer interactions
with physical products and environments
Examples: Smart home devices, wearable
technology, in-store sensors.
39.
BIG DATA in
MarketingAnalytics
•Third-Party Data
• Description: Data acquired from
external sources to supplement and
enhance internal data
• Examples: Market research reports,
industry benchmarks, data brokers.
40.
Statistical Foundations ofMarketing
SLICING AND DICING
MARKETING DATA WITH PIVOT
TABLES
USING EXCEL CHARTS TO
SUMMARISE MARKETING DATA
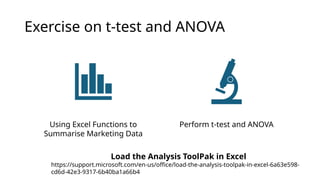
Exercise on t-testand ANOVA
Using Excel Functions to
Summarise Marketing Data
Perform t-test and ANOVA
Load the Analysis ToolPak in Excel
https://support.microsoft.com/en-us/office/load-the-analysis-toolpak-in-excel-6a63e598-
cd6d-42e3-9317-6b40ba1a66b4
43.
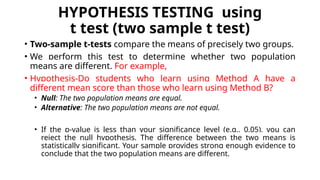
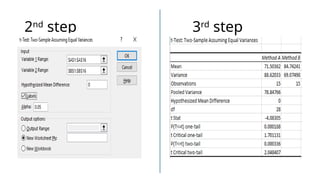
HYPOTHESIS TESTING using
ttest (two sample t test)
• Two-sample t-tests compare the means of precisely two groups.
• We perform this test to determine whether two population
means are different. For example,
• Hypothesis-Do students who learn using Method A have a
different mean score than those who learn using Method B?
• Null: The two population means are equal.
• Alternative: The two population means are not equal.
• If the p-value is less than your significance level (e.g., 0.05), you can
reject the null hypothesis. The difference between the two means is
statistically significant. Your sample provides strong enough evidence to
conclude that the two population means are different.
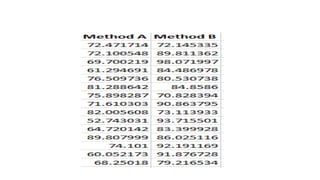
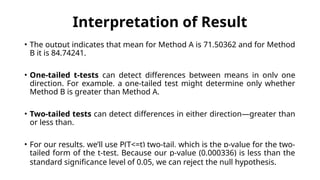
Interpretation of Result
•The output indicates that mean for Method A is 71.50362 and for Method
B it is 84.74241.
• One-tailed t-tests can detect differences between means in only one
direction. For example, a one-tailed test might determine only whether
Method B is greater than Method A.
• Two-tailed tests can detect differences in either direction—greater than
or less than.
• For our results, we’ll use P(T<=t) two-tail, which is the p-value for the two-
tailed form of the t-test. Because our p-value (0.000336) is less than the
standard significance level of 0.05, we can reject the null hypothesis.
47.
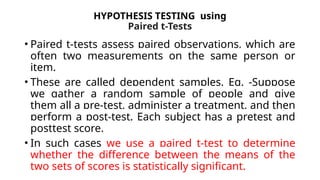
HYPOTHESIS TESTING using
Pairedt-Tests
• Paired t-tests assess paired observations, which are
often two measurements on the same person or
item.
• These are called dependent samples. Eg. -Suppose
we gather a random sample of people and give
them all a pre-test, administer a treatment, and then
perform a post-test. Each subject has a pretest and
posttest score.
• In such cases we use a paired t-test to determine
whether the difference between the means of the
two sets of scores is statistically significant.
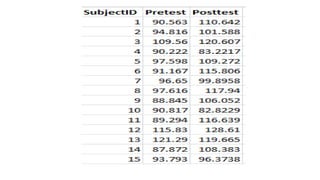
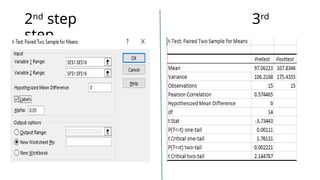
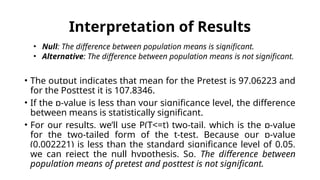
Interpretation of Results
•Null: The difference between population means is significant.
• Alternative: The difference between population means is not significant.
• The output indicates that mean for the Pretest is 97.06223 and
for the Posttest it is 107.8346.
• If the p-value is less than your significance level, the difference
between means is statistically significant.
• For our results, we’ll use P(T<=t) two-tail, which is the p-value
for the two-tailed form of the t-test. Because our p-value
(0.002221) is less than the standard significance level of 0.05,
we can reject the null hypothesis. So, The difference between
population means of pretest and posttest is not significant.
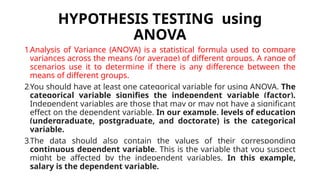
51.
HYPOTHESIS TESTING using
ANOVA
1.Analysisof Variance (ANOVA) is a statistical formula used to compare
variances across the means (or average) of different groups. A range of
scenarios use it to determine if there is any difference between the
means of different groups.
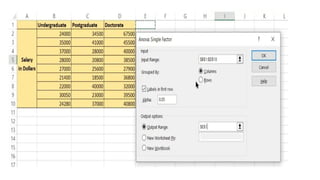
2.You should have at least one categorical variable for using ANOVA. The
categorical variable signifies the independent variable (factor).
Independent variables are those that may or may not have a significant
effect on the dependent variable. In our example, levels of education
(undergraduate, postgraduate, and doctorate) is the categorical
variable.
3.The data should also contain the values of their corresponding
continuous dependent variable. This is the variable that you suspect
might be affected by the independent variables. In this example,
salary is the dependent variable.
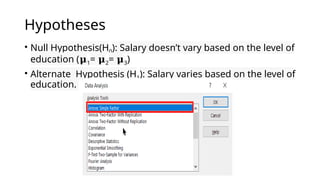
52.
Hypotheses
• Null Hypothesis(H0):Salary doesn’t vary based on the level of
education (𝛍1= 𝛍2= 𝛍3)
• Alternate Hypothesis (H1): Salary varies based on the level of
education.
54.
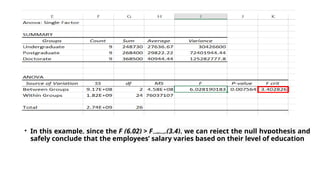
• In thisexample, since the F (6.02) > Fcritical (3.4), we can reject the null hypothesis and
safely conclude that the employees’ salary varies based on their level of education
55.
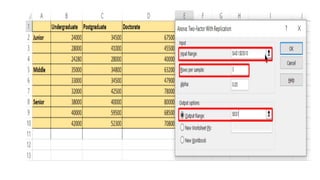
Two Factor ANOVA
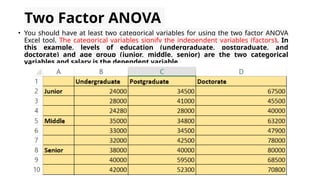
•You should have at least two categorical variables for using the two factor ANOVA
Excel tool. The categorical variables signify the independent variables (factors). In
this example, levels of education (undergraduate, postgraduate, and
doctorate) and age group (junior, middle, senior) are the two categorical
variables and salary is the dependent variable.
56.
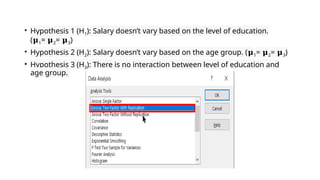
• Hypothesis 1(H1): Salary doesn’t vary based on the level of education.
(𝛍1= 𝛍2= 𝛍3)
• Hypothesis 2 (H2): Salary doesn’t vary based on the age group. (𝛍1= 𝛍2= 𝛍3)
• Hypothesis 3 (H3): There is no interaction between level of education and
age group.
58.
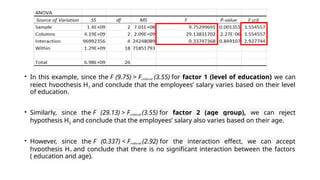
• In thisexample, since the F (9.75) > Fcritical (3.55) for factor 1 (level of education) we can
reject hypothesis H1 and conclude that the employees’ salary varies based on their level
of education.
• Similarly, since the F (29.13) > Fcritical (3.55) for factor 2 (age group), we can reject
hypothesis H2 and conclude that the employees’ salary also varies based on their age.
• However, since the F (0.337) < Fcritical (2.92) for the interaction effect, we can accept
hypothesis H3 and conclude that there is no significant interaction between the factors
( education and age).
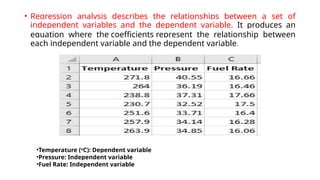
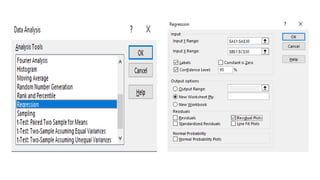
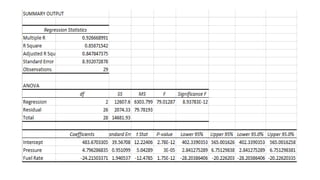
• Regression analysisdescribes the relationships between a set of
independent variables and the dependent variable. It produces an
equation where the coefficients represent the relationship between
each independent variable and the dependent variable.
•Temperature (o
C): Dependent variable
•Pressure: Independent variable
•Fuel Rate: Independent variable
63.
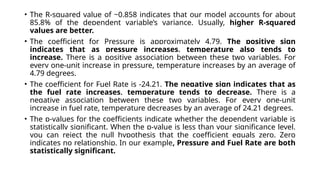
• The R-squaredvalue of ~0.858 indicates that our model accounts for about
85.8% of the dependent variable’s variance. Usually, higher R-squared
values are better.
• The coefficient for Pressure is approximately 4.79. The positive sign
indicates that as pressure increases, temperature also tends to
increase. There is a positive association between these two variables. For
every one-unit increase in pressure, temperature increases by an average of
4.79 degrees.
• The coefficient for Fuel Rate is -24.21. The negative sign indicates that as
the fuel rate increases, temperature tends to decrease. There is a
negative association between these two variables. For every one-unit
increase in fuel rate, temperature decreases by an average of 24.21 degrees.
• The p-values for the coefficients indicate whether the dependent variable is
statistically significant. When the p-value is less than your significance level,
you can reject the null hypothesis that the coefficient equals zero. Zero
indicates no relationship. In our example, Pressure and Fuel Rate are both
statistically significant.
64.
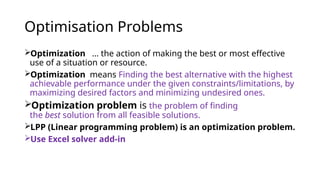
Optimisation Problems
Optimization …the action of making the best or most effective
use of a situation or resource.
Optimization means Finding the best alternative with the highest
achievable performance under the given constraints/limitations, by
maximizing desired factors and minimizing undesired ones.
Optimization problem is the problem of finding
the best solution from all feasible solutions.
LPP (Linear programming problem) is an optimization problem.
Use Excel solver add-in
66.
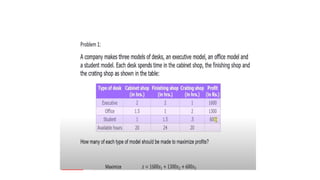
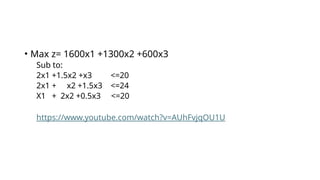
• Max z=1600x1 +1300x2 +600x3
Sub to:
2x1 +1.5x2 +x3 <=20
2x1 + x2 +1.5x3 <=24
X1 + 2x2 +0.5x3 <=20
https://www.youtube.com/watch?v=AUhFvjqOU1U
67.
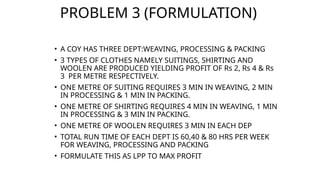
PROBLEM 3 (FORMULATION)
•A COY HAS THREE DEPT:WEAVING, PROCESSING & PACKING
• 3 TYPES OF CLOTHES NAMELY SUITINGS, SHIRTING AND
WOOLEN ARE PRODUCED YIELDING PROFIT OF Rs 2, Rs 4 & Rs
3 PER METRE RESPECTIVELY.
• ONE METRE OF SUITING REQUIRES 3 MIN IN WEAVING, 2 MIN
IN PROCESSING & 1 MIN IN PACKING.
• ONE METRE OF SHIRTING REQUIRES 4 MIN IN WEAVING, 1 MIN
IN PROCESSING & 3 MIN IN PACKING.
• ONE METRE OF WOOLEN REQUIRES 3 MIN IN EACH DEP
• TOTAL RUN TIME OF EACH DEPT IS 60,40 & 80 HRS PER WEEK
FOR WEAVING, PROCESSING AND PACKING
• FORMULATE THIS AS LPP TO MAX PROFIT
68.
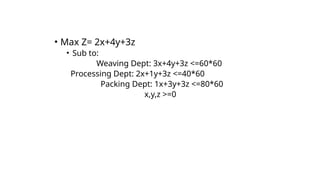
• Max Z=2x+4y+3z
• Sub to:
Weaving Dept: 3x+4y+3z <=60*60
Processing Dept: 2x+1y+3z <=40*60
Packing Dept: 1x+3y+3z <=80*60
x,y,z >=0


![[rokonz.com] Glossary of Semantic SEO Part-3.pdf](https://cdn.slidesharecdn.com/ss_thumbnails/rokonz-260123200835-55123e1e-thumbnail.jpg?width=640&height=640&fit=bounds)


![[rokonz.com] Glossary of Semantic SEO Part-2.pdf](https://cdn.slidesharecdn.com/ss_thumbnails/rokonz-260123200719-92199ba8-thumbnail.jpg?width=640&height=640&fit=bounds)
