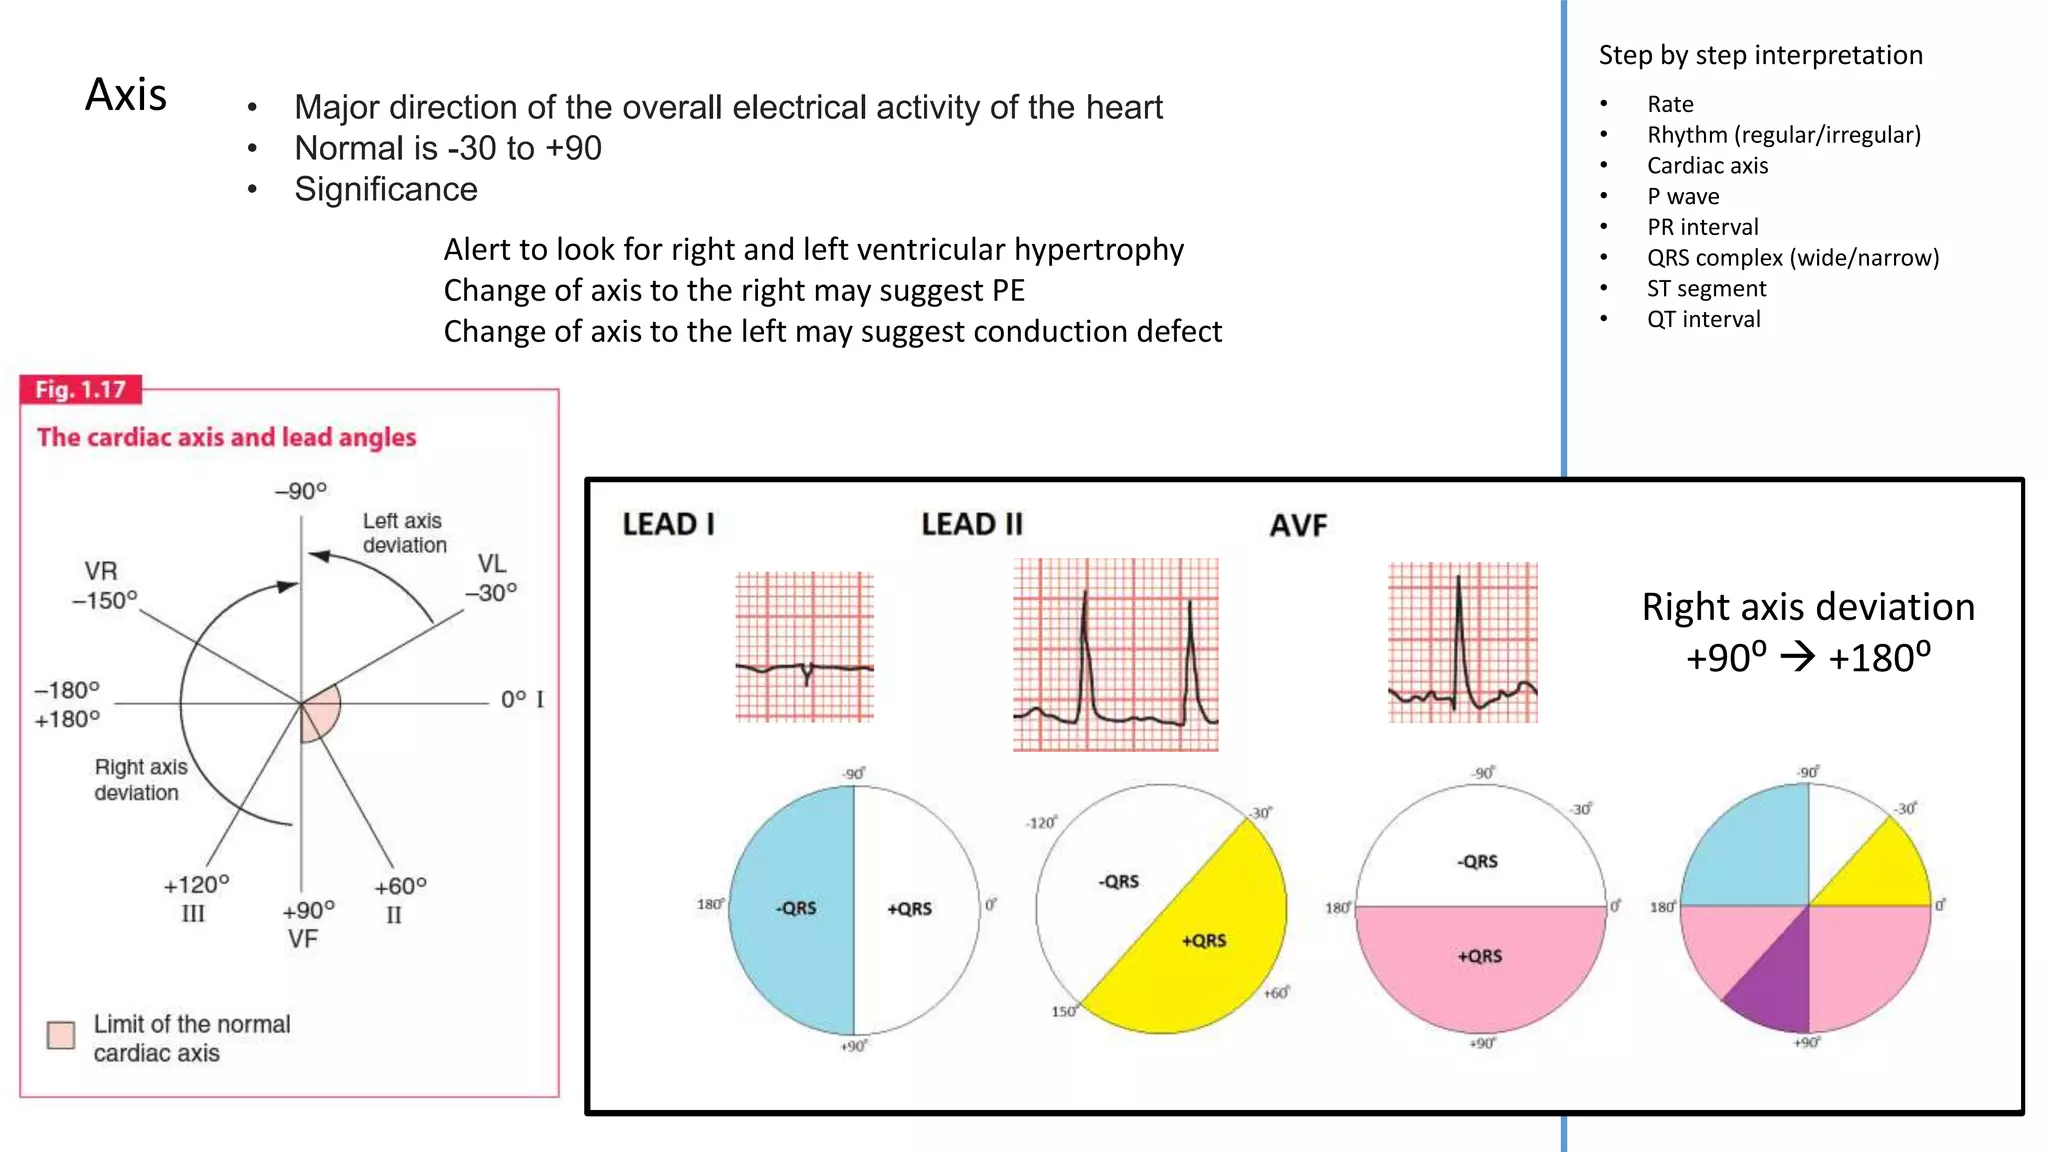
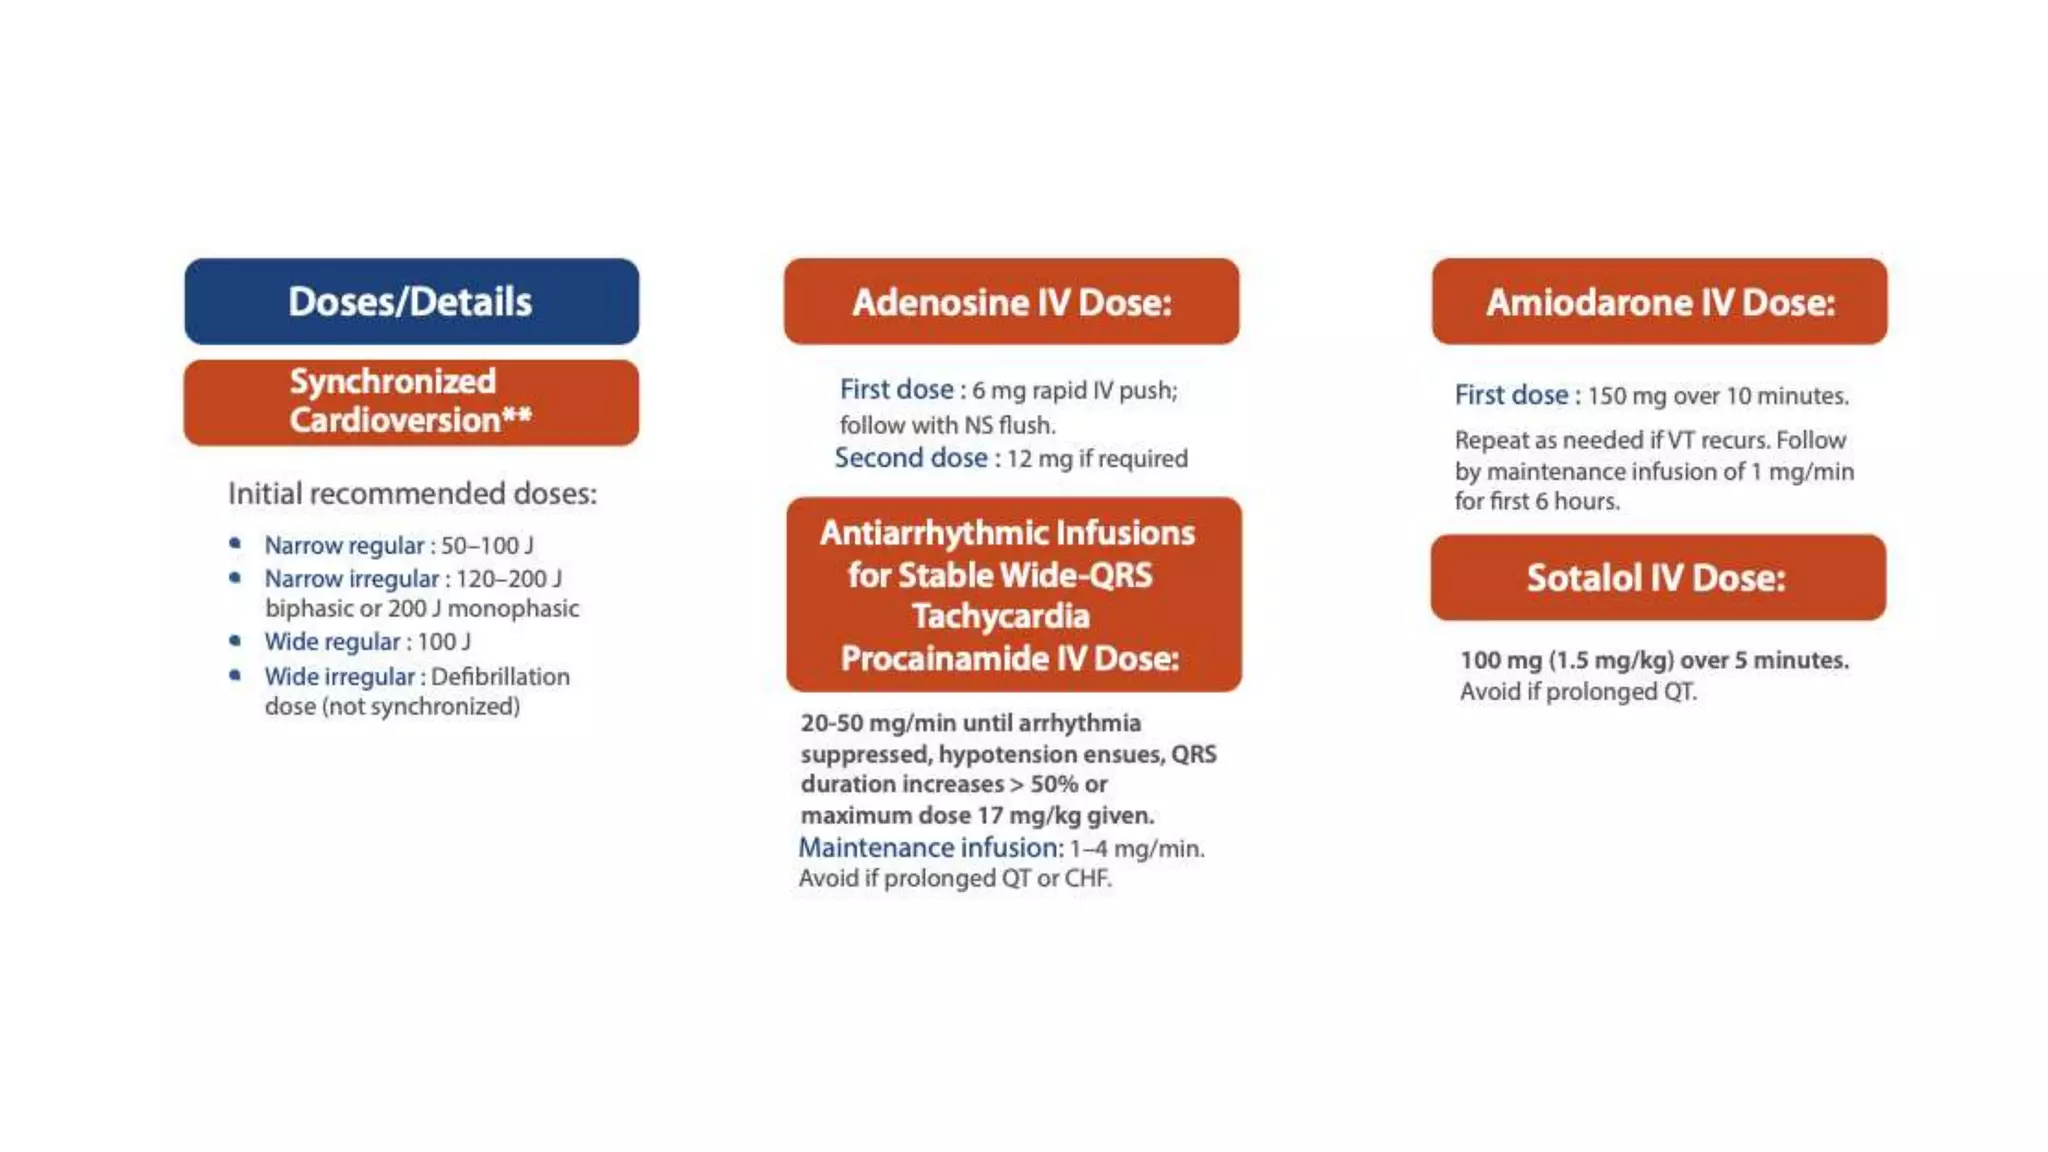
2. • Rate
• Rhythm (regular/irregular)
• Cardiac axis
• P wave
• PR interval
• QRS complex (wide/narrow)
• ST segment
• QT interval
Step by step interpretation
• P wave
• present/absent
• size
• PR interval
= 0.12-0.2 sec (3-5 small boxes)
• QRS complex (wide/narrow)
= <0.12 sec (3 small boxes)
• ST segment
• QT interval
QT interval should be less than 50% of the preceding cycle length
Prolonged QT is associated with risk of VT and Torsades de pointes
3.
4. • Rate
• Rhythm (regular/irregular)
• Cardiac axis
• P wave
• PR interval
• QRS complex (wide/narrow)
• ST segment
• QT interval
Step by step interpretation
Rate
If RR interval is 1 big box (0.2 secs) then the rate
is 60/0.2 = 300 bpm
•1 big box = 300 beats/min
•2 big boxes = 150 beats/min
•3 big boxes = 100 beats/min
10 seconds = 50 large square
6 seconds = 30 large square
The standard paper speed is 25mm/sec
• 1mm (small square) = 0.04sec
• 5mm (large square) = 0.2sec
REGULAR RHYTHM IRREGULAR RHYTHM
• Rate = 300/number of large square
between two consecutives R waves
• 10 seconds method
Rate = number of R waves x 6
• 6 seconds method
Rate = number of R waves x 10
5. • Rate
• Rhythm (regular/irregular)
• Cardiac axis
• P wave
• PR interval
• QRS complex (wide/narrow)
• ST segment
• QT interval
Step by step interpretation
Rhythm
II
• Regular : RR interval constant
• Regularly irregular : RR interval variable but with a pattern
• Irregularly irregular : RR interval variable with no pattern, totally irregular
6. • Rate
• Rhythm (regular/irregular)
• Cardiac axis
• P wave
• PR interval
• QRS complex (wide/narrow)
• ST segment
• QT interval
Step by step interpretation
Axis • Major direction of the overall electrical activity of the heart
• Normal is -30 to +90
• Significance
Alert to look for right and left ventricular hypertrophy
Change of axis to the right may suggest PE
Change of axis to the left may suggest conduction defect
Normal axis
0⁰ - 90⁰
Left axis deviation
PATHOLOGICAL
-30⁰ -90⁰
Right axis deviation
+90⁰ +180⁰
16. prolongation of PR interval (>0.2s)
progressive lengthening of PR interval with
eventual dropped ventricular conduction
intermittent dropping of ventricular conduction
complete dissociation between atria and
ventricular
30. Management
for SVT
• 2) Pharmacological
• Adenosine, 6mg with 20cc NS via
cubital fossa, with 3way
connected to the cannula, rapidly
deliver the adenosine followed by
NS flush through 3 way tap and
raise the arm
• OR IV Verapamil 2-5 mg given
1mg/min up to 20mg
• OR IV Diltiazem 2.5mg/min (max
50mg)
• OR IV Amiodarone 300mg in 100
cc D5 and 900mg in 100cc D5 in
23H ( infusion)
• 1) Non pharmacological
• Vasalva manouvre: Supine
position, ask patient to blow into
20ml syringe to push plunger out
or blow against closed glottis like
straining to have bowel
movement/ Maintain for 10
seconds and then resume normal
breathing
• Carotid massage-make sure to
exclude carotid bruits,
trandelenburg position, and head
turn to one side, put finger to the
superior part of the palpable
carotid pulse, and apply pressure
backward and medially in circular
or longitudinal massage for <10s,
apply up until 1min
31. Management
for AF
Unstable
Electrical cardioversion
-start with 120J
Pharmacological
cardioversion
- Amiodarone 300mg in
1H followed by 900mg in
24H OR
Stable
Rate control
-oral beta blocker – T metoprolol
50mg
-calcium channel cblocker - IV
verapamil 2.5-5mg
-IV digoxin 0.5mg in 100cc NS
over 30 min
Rhythm control
Pharmacological cardioversion –
IV amiodarone 300mg in 1H,
then 900mg in 23H
Electrical cardioversion 120J
onwards
32. Management
for VT
• IV amiodarone 300mg over 20-60 min and
followed by infusion 900mg/23H
• Lidocaine 1-1.5mg/kg over 10 min, repeated
once at half dose after 10min ( max 3mg/kg)
OR
• Procainamide 100mg in 5 min, 20-50mg/min
until arrythmia suppressed
• Sotalol 100mg or 1.5mg/kg over 5min
• Avoid in prolonged QT or HF
• If torsades de pointes, given IV Mg So4 2g over
10 min
36. Transcutaneous Pacing
Steps:
Explain to the patient
regarding the procedure
Inform consent
Prepare procedural
sedations
Attach pads (apex and
sternum)
Select mode: Fixed or
demand
Select rate: usually starts
from 60bpm
Select energy
Turn Pacer ON, presence of
pacing spikes on ECG are
indicating that impulse are
delivered
Look for electrical capture
(pacing spikes followed by
broad QRS complex and T
waves)
Feel for mechanical capture
Increase energy by 5mA
38. Mechanical
capture
• Signs of improved cardiac output
• palpable pulse,
• rise in blood pressure,
• improved level of consciousness,
• improved skin color and temperature
An ECG - representation of the electrical activity of the heart muscle
Regular or irregular>?
R-R interval?
Rate
Regular: 300/ ( bifg boxes from R-R)
Irregular: count R in 30 big boxes x 10
( 300 big boxes= 1 min)
Look at the QRS complex
Narrow? Broad 0.07- 0.1s
Narrow < 0.12s
Borad> 0.12s
Supraventricular rhythm: arises from above level of bundle of His, junctional, producing narrow QRS complex, as impulse pass through specialized conduction system to the ventricles
Ventricular rhythm produce wide QRS complex as impulses does not pulse through AVN/bundle of His, --pass directly to ventricular myocardium, longer time taken for depolar
P wave absend? Present?
PR wave: normal,shortend or prolonged ( 120-200ms)- 3-4 boxes
P followed by QRS complex– if not in heart block
Regular/irregular?
Rate
QRS( broad/narrow)
P? absent or present,
PR, normal or prolonged
P with QRS relationship
The normal ECG
It will be clear from above that the first structure to be depolarised during normal sinus rhythm is the right atrium, closely followed by the left atrium. So the first electrical signal on a normal ECG originates from the atria and is known as the P wave. Although there is usually only one P wave in most leads of an ECG, the P wave is in fact the sum of the electrical signals from the two atria, which are usually superimposed.
There is then a short, physiological delay as the atrioventricular (AV) node slows the electrical depolarisation before it proceeds to the ventricles. This delay is responsible for the PR interval, a short period where no electrical activity is seen on the ECG, represented by a straight horizontal or ‘isoelectric’ line.
Depolarisation of the ventricles results in usually the largest part of the ECG signal (because of the greater muscle mass in the ventricles) and this is known as the QRS complex.
The Q wave is the first initial downward or ‘negative’ deflection
The R wave is then the next upward deflection (provided it crosses the isoelectric line and becomes ‘positive’)
The S wave is then the next deflection downwards, provided it crosses the isoelectric line to become briefly negative before returning to the isoelectric baseline.
In the case of the ventricles, there is also an electrical signal reflecting repolarisation of the myocardium. This is shown as the ST segment and the T wave. The ST segment is normally isoelectric, and the T wave in most leads is an upright deflection of variable amplitude and duration (see Figures 5 and 6).
Normal intervals
The recording of an ECG on standard paper allows the time taken for the various phases of electrical depolarisation to be measured, usually in milliseconds. There is a recognised normal range for such ‘intervals’:
PR interval (measured from the beginning of the P wave to the first deflection of the QRS complex). Normal range 120 – 200 ms (3 – 5 small squares on ECG paper).
QRS duration (measured from first deflection of QRS complex to end of QRS complex at isoelectric line). Normal range up to 120 ms (3 small squares on ECG paper).
QT interval (measured from first deflection of QRS complex to end of T wave at isoelectric line). Normal range up to 440 ms (though varies with heart rate and may be slightly longer in females)
An ECG is simply a representation of the electrical activity of the heart muscle as it changes with time, usually printed on paper for easier analysis.
Regular or irregular>?
R-R interval>?
Rate
Regular: 300/ ( bifg boxes from R-R)
Irregular: count R in 30 big boxes x 10
( 300 big boxes= 1 min)
Look at the QRS complex
Narrow? Broad 0.07- 0.1s
Narrow < 0.12s
Borad> 0.12s
Supraventricular rhythm: arises from above level of bundle of His, junctional, producing narrow QRS complex, as impulse pass through specialized conduction system to the ventricles
Ventricular rhythm produce wide QRS complex as impulses does not pulse through AVN/bundle of His, --pass directly to ventricular myocardium, longer time taken for depolar
P wave absend? Present?
PR wave: normal,shortend or prolonged ( 120-200ms)- 3-4 boxes
P followed by QRS complex– if not in heart block
Regular/irregular?
Rate
QRS( broad/narrow)
P? absent or present,
PR, normal or prolonged
P with QRS relationship
The normal ECG
It will be clear from above that the first structure to be depolarised during normal sinus rhythm is the right atrium, closely followed by the left atrium. So the first electrical signal on a normal ECG originates from the atria and is known as the P wave. Although there is usually only one P wave in most leads of an ECG, the P wave is in fact the sum of the electrical signals from the two atria, which are usually superimposed.
There is then a short, physiological delay as the atrioventricular (AV) node slows the electrical depolarisation before it proceeds to the ventricles. This delay is responsible for the PR interval, a short period where no electrical activity is seen on the ECG, represented by a straight horizontal or ‘isoelectric’ line.
Depolarisation of the ventricles results in usually the largest part of the ECG signal (because of the greater muscle mass in the ventricles) and this is known as the QRS complex.
The Q wave is the first initial downward or ‘negative’ deflection
The R wave is then the next upward deflection (provided it crosses the isoelectric line and becomes ‘positive’)
The S wave is then the next deflection downwards, provided it crosses the isoelectric line to become briefly negative before returning to the isoelectric baseline.
In the case of the ventricles, there is also an electrical signal reflecting repolarisation of the myocardium. This is shown as the ST segment and the T wave. The ST segment is normally isoelectric, and the T wave in most leads is an upright deflection of variable amplitude and duration (see Figures 5 and 6).
Normal intervals
The recording of an ECG on standard paper allows the time taken for the various phases of electrical depolarisation to be measured, usually in milliseconds. There is a recognised normal range for such ‘intervals’:
PR interval (measured from the beginning of the P wave to the first deflection of the QRS complex). Normal range 120 – 200 ms (3 – 5 small squares on ECG paper).
QRS duration (measured from first deflection of QRS complex to end of QRS complex at isoelectric line). Normal range up to 120 ms (3 small squares on ECG paper).
QT interval (measured from first deflection of QRS complex to end of T wave at isoelectric line). Normal range up to 440 ms (though varies with heart rate and may be slightly longer in females)
An ECG - representation of the electrical activity of the heart muscle
Regular or irregular>?
R-R interval?
Rate
Regular: 300/ ( bifg boxes from R-R)
Irregular: count R in 30 big boxes x 10
( 300 big boxes= 1 min)
Look at the QRS complex
Narrow? Broad 0.07- 0.1s
Narrow < 0.12s
Borad> 0.12s
Supraventricular rhythm: arises from above level of bundle of His, junctional, producing narrow QRS complex, as impulse pass through specialized conduction system to the ventricles
Ventricular rhythm produce wide QRS complex as impulses does not pulse through AVN/bundle of His, --pass directly to ventricular myocardium, longer time taken for depolar
P wave absend? Present?
PR wave: normal,shortend or prolonged ( 120-200ms)- 3-4 boxes
P followed by QRS complex– if not in heart block
Regular/irregular?
Rate
QRS( broad/narrow)
P? absent or present,
PR, normal or prolonged
P with QRS relationship
The normal ECG
It will be clear from above that the first structure to be depolarised during normal sinus rhythm is the right atrium, closely followed by the left atrium. So the first electrical signal on a normal ECG originates from the atria and is known as the P wave. Although there is usually only one P wave in most leads of an ECG, the P wave is in fact the sum of the electrical signals from the two atria, which are usually superimposed.
There is then a short, physiological delay as the atrioventricular (AV) node slows the electrical depolarisation before it proceeds to the ventricles. This delay is responsible for the PR interval, a short period where no electrical activity is seen on the ECG, represented by a straight horizontal or ‘isoelectric’ line.
Depolarisation of the ventricles results in usually the largest part of the ECG signal (because of the greater muscle mass in the ventricles) and this is known as the QRS complex.
The Q wave is the first initial downward or ‘negative’ deflection
The R wave is then the next upward deflection (provided it crosses the isoelectric line and becomes ‘positive’)
The S wave is then the next deflection downwards, provided it crosses the isoelectric line to become briefly negative before returning to the isoelectric baseline.
In the case of the ventricles, there is also an electrical signal reflecting repolarisation of the myocardium. This is shown as the ST segment and the T wave. The ST segment is normally isoelectric, and the T wave in most leads is an upright deflection of variable amplitude and duration (see Figures 5 and 6).
Normal intervals
The recording of an ECG on standard paper allows the time taken for the various phases of electrical depolarisation to be measured, usually in milliseconds. There is a recognised normal range for such ‘intervals’:
PR interval (measured from the beginning of the P wave to the first deflection of the QRS complex). Normal range 120 – 200 ms (3 – 5 small squares on ECG paper).
QRS duration (measured from first deflection of QRS complex to end of QRS complex at isoelectric line). Normal range up to 120 ms (3 small squares on ECG paper).
QT interval (measured from first deflection of QRS complex to end of T wave at isoelectric line). Normal range up to 440 ms (though varies with heart rate and may be slightly longer in females)
Normal heart rate ( 60-100)
Above HR>100, called tachycardia
Below < 60, called bradycardia
Clinical- stable/unstable
ECG- narrow/wide, regular vs irregular
Origin- supraventricular vs ventricular
Narrow QRS complex
P waves not seen
Rate> 150bpm
Regular rhythm
P waves buried in T wave
Normal heart rate ( 60-100)
Above HR>100, called tachycardia
Below < 60, called bradycardia
Clinical- stable/unstable
ECG- narrow/wide, regular vs irregular
Origin- supraventricular vs ventricular
Sinus rhythm
A resting heart beat < 60bpm
Normal QRS complex
First degree heart block
PR interval > 200ms ( five small squares)
Sinus rhythm
Normal P wave followed by normal QRS complex
‘Marked’ first degree block if PR interval >300ms
Progressive prolongation of the PR interval culminating in a non conducted P wave
The PR interval is the longest immediately before the dropped beat
The PR interval is the shortest immediately after the dropped beat
Intermittent non conducted P waves without progressive prolongation of the PR interval ( compare to Mobitzz II)
The PR interval in the conducted beates remain constant
The P waves ‘ march through’ at constant rate
The RR interval surrounding the dropped beat is an exact multiple of the preceding RR interval
In complete HB, there is complete absence of AV conduction- none of the supraventricular impulses are conducted to the ventricles
Atrial and ventricular rate regular but independently dissociated
P waves normal
Less damage to myocardium in cardioversion
Fixed: will deliver a fixed number of beats regardless pt heart beat
Demand: only deliver beats when pt heart beat less than the rate
Fixed: will deliver a fixed number of beats regardless pt heart beat
Demand: only deliver beats when pt heart beat less than the rate