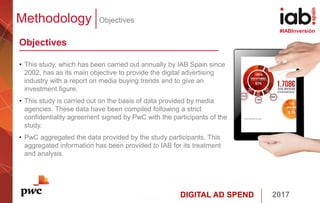
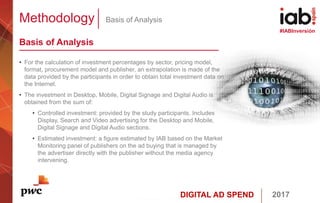
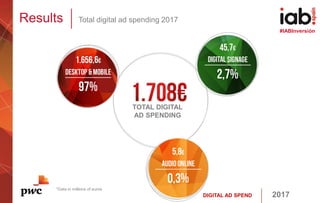
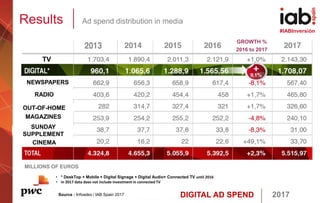
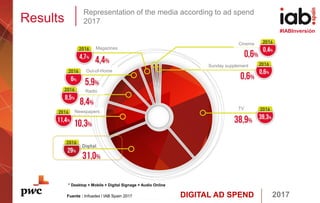
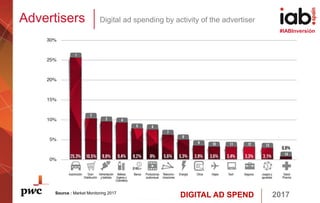
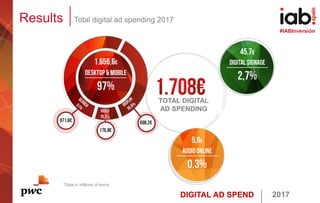
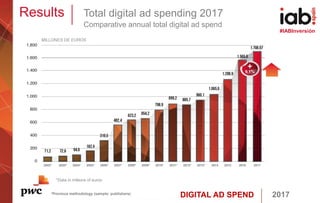
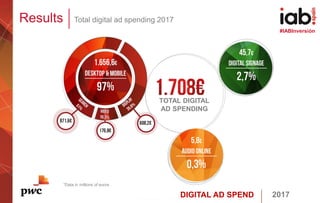
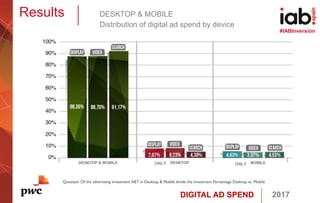
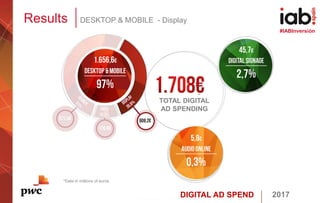
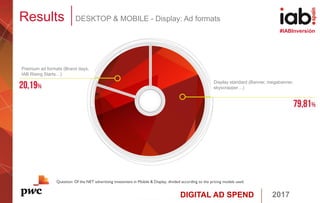
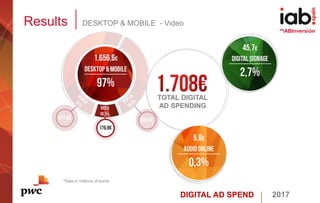
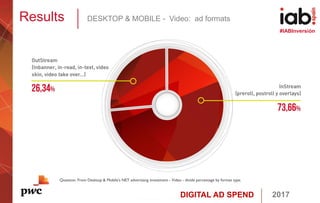
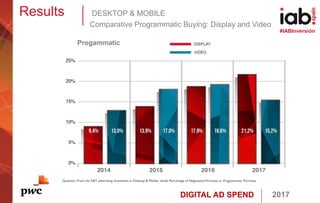
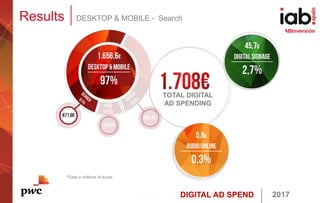
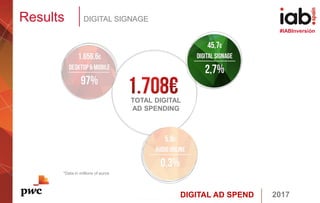
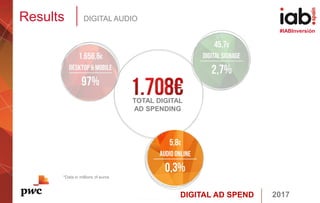
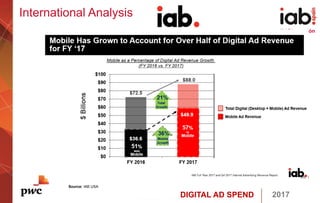
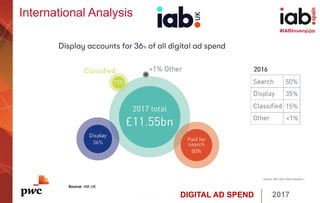
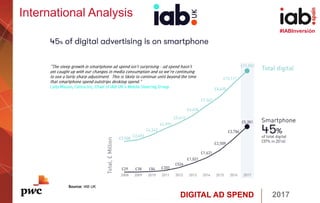
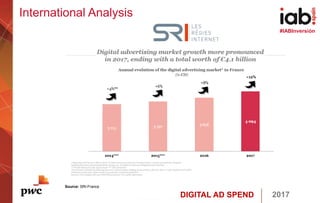
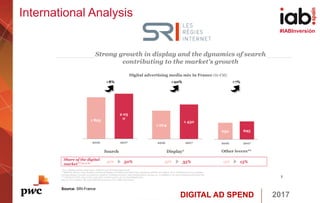
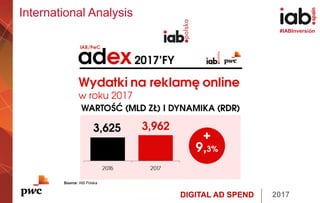
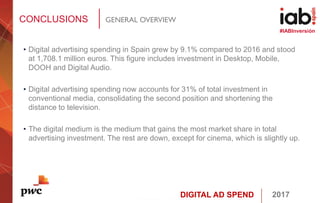
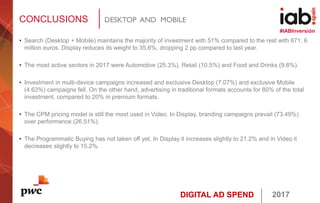
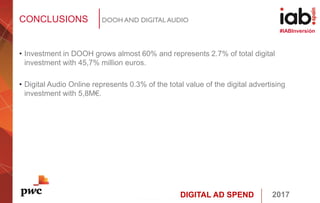
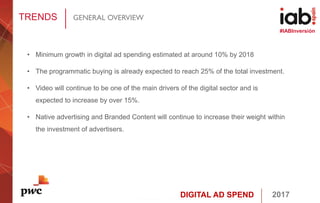
DIGITAL AD SPEND 2017
#IABInversión
DIGITAL AD SPEND
2017 full year results
DIGITAL AD SPEND 2017
#IABInversión
INDEX
I. Methodology
• Objectives
• Basis of Analysis
• Technical datasheet
• Representativeness
• Sample Profile
• Participants
II. Results
• Media overview
• Advertisers ranking
1. Desktop & Mobile
Display
• Pricing
• Ad format
• Device
• Procurement
Video
• Pricing
• Ad format
• Device
• Procurement
Search
• Device
2. Digital Signage
3. Digital Audio
III. International Analysis
IV. Conclusions
V. Trends
DIGITAL AD SPEND 2017
#IABInversión
I. Methodology
• Objectives
• Basis of Analysis
• Technical datasheet
• Representativeness
• Sample Profile
• Participants
#IABInversión
2017DIGITAL AD SPEND
DIGITAL AD SPEND 2017
#IABInversión
Methodology Objectives
Objectives
• This study, which has been carried out annually by IAB Spain since
2002, has as its main objective to provide the digital advertising
industry with a report on media buying trends and to give an
investment figure.
• This study is carried out on the basis of data provided by media
agencies. These data have been compiled following a strict
confidentiality agreement signed by PwC with the participants of the
study.
• PwC aggregated the data provided by the study participants. This
aggregated information has been provided to IAB for its treatment
and analysis.
DIGITAL AD SPEND 2017
#IABInversión
Methodology Basis of Analysis
Basis of Analysis
• For the calculation of investment percentages by sector, pricing model,
format, procurement model and publisher, an extrapolation is made of the
data provided by the participants in order to obtain total investment data on
the Internet.
• The investment in Desktop, Mobile, Digital Signage and Digital Audio is
obtained from the sum of:
• Controlled investment: provided by the study participants. Includes
Display, Search and Video advertising for the Desktop and Mobile,
Digital Signage and Digital Audio sections.
• Estimated investment: a figure estimated by IAB based on the Market
Monitoring panel of publishers on the ad buying that is managed by
the advertiser directly with the publisher without the media agency
intervening.
DIGITAL AD SPEND 2017
#IABInversión
Methodology Technical datasheet
Technical datasheet
• Sample
o DESKTOP & MOBILE:
 13 Display participants
 13 Video participants
 13 Search participants
o DIGITAL SIGNAGE
 6 participants
o DIGITAL AUDIO
 9 participants
• Study type
Tracking with biannual periodicity to panel of
companies.
• Universe
Media agencies associated and not
associated to IAB Spain.
• Selection method
From databases owned by IAB, an invitation to
participate was sent.
• Type of questionnaire
Structured (closed-ended questions).
DIGITAL AD SPEND 2017
#IABInversión
Methodology Representation – Desktop & Mobile
o Display DESKTOP & MOBILE:
- Pricing: 100%
- Ad formats: 100%
- Commercialisation Model
(programmatic/negotiated):100
%
- Type of programmatic: 73,51%
- Device: 100%
Representativeness of the data
(The percentage of
data
representativeness
indicates the
proportion
between the
reported
investment in each
category (pricing,
formats, etc.) and
the total
investment
reported for the
media-type of
advertising (e.g.
Desktop-display).
o Video DESKTOP & MOBILE:
- Pricing: 80,38%
- Ad formats (Instream video,
Instream display, Outstream):
100%
- Commercialisation Model
(programmatic/negotiated):
100%
- Type of programmatic: 65,08%
- Device: 100%
o Search DESKTOP & MOBILE:
- Device: 100%
DIGITAL AD SPEND 2017
#IABInversión
Sample Profile Participating companies
DESKTOP & MOBILE: 13 companies
DIGITAL SIGNAGE: 6 companies
DIGITAL AUDIO: 9 companies
Basis for study: 13 participating companies
DIGITAL AD SPEND 2017
#IABInversión
Participants Media agencies
DIGITAL AD SPEND 2017
#IABInversión
• Desktop & Mobile
• Digital Signage
• Digital Audio
II. Results
Media overview
#IABInversión
DIGITAL AD SPEND 2017
#IABInversión
Results Total digital ad spending 2017
TOTAL DIGITAL
AD SPENDING
*Data in millions of euros
DIGITAL AD SPEND
DIGITAL AD SPEND 2017
#IABInversión
Results Ad spend distribution in media
Source : Infoadex / IAB Spain 2017
• * DeskTop + Mobile + Digital Signage + Digital Audio+ Connected TV until 2016
• In 2017 data does not include investment in connected TV
TV
NEWSPAPERS
RADIO
OUT-OF-HOME
MAGAZINES
CINEMA
MILLIONS OF EUROS
SUNDAY
SUPPLEMENT
GROWTH %
2016 to 2017
DIGITAL AD SPEND 2017
#IABInversión
Results
Representation of the media according to ad spend
2017
* Desktop + Mobile + Digital Signage + Audio Online
Fuente : Infoadex / IAB Spain 2017
Magazines
Radio
Newspapers
Out-of-Home
TV
Cinema
Sunday supplement
DIGITAL AD SPEND 2017
#IABInversión
Advertisers Digital ad spending by activity of the advertiser
Source : Market Monitoring 2017
DIGITAL AD SPEND 2017
#IABInversión
Advertisers Ranking digital advertisers
Source : Market Monitoring 2017
DIGITAL AD SPEND 2017
#IABInversión
Results Total digital ad spending 2017
TOTAL DIGITAL
AD SPENDING
*Data in millions of euros
DIGITAL AD SPEND 2017
#IABInversión
Results Total digital ad spending 2017
Comparative annual total digital ad spend
*Previous methodology (sample: publishers)
*Data in millions of euros
DIGITAL AD SPEND 2017
#IABInversión
1. Desktop & Mobile
2. Digital Signage
3. Digital Audio
II. Results
DIGITAL AD SPEND 2017
#IABInversión
TOTAL DIGITAL
AD SPENDING
Results Total digital ad spending 2017
*Data in millions of euros
DIGITAL AD SPEND 2017
#IABInversión
Results DESKTOP & MOBILE
Distribution of digital ad spend by device
Question: Of the advertising investment NET in Desktop & Mobile divide the investment Percentage Desktop vs. Mobile
ONLY ONLY
DIGITAL AD SPEND 2017
#IABInversión
Results DESKTOP & MOBILE - Display
TOTAL DIGITAL
AD SPENDING
*Data in millions of euros
DIGITAL AD SPEND 2017
#IABInversión
Results DESKTOP & MOBILE - Display: Ad formats
Question: Of the NET advertising investment in Mobile & Display, divided according to the pricing models used.
Premium ad formats (Brand days,
IAB Rising Starts…)
Display standard (Banner, megabanner,
skyscrapper…)
DIGITAL AD SPEND 2017
#IABInversión
Results DESKTOP & MOBILE - Video
TOTAL DIGITAL
AD SPENDING
*Data in millions of euros
DIGITAL AD SPEND 2017
#IABInversión
Results DESKTOP & MOBILE - Video: ad formats
Question: From Desktop & Mobile's NET advertising investment - Video - divide percentage by format type.
DIGITAL AD SPEND 2017
#IABInversión
Results DESKTOP & MOBILE
Comparative Programmatic Buying: Display and Video
Question: From the NET advertising investment in Desktop & Mobile- divide Percentage of Negotiated Purchase vs. Programmatic Purchase.
Progammatic
DIGITAL AD SPEND 2017
#IABInversión
Results DESKTOP & MOBILE - Search
TOTAL DIGITAL
AD SPENDING
*Data in millions of euros
DIGITAL AD SPEND 2017
#IABInversión
1. Desktop & Mobile
2. Digital Signage
3. Digital Audio
II. Results
#IABInversión
DIGITAL AD SPEND 2017
#IABInversión
Results DIGITAL SIGNAGE
TOTAL DIGITAL
AD SPENDING
*Data in millions of euros
DIGITAL AD SPEND 2017
#IABInversión
1. Desktop & Mobile
2. Digital Signage
3. Audio Online
II. Results
#IABInversión
DIGITAL AD SPEND 2017
#IABInversión
Results DIGITAL AUDIO
TOTAL DIGITAL
AD SPENDING
*Data in millions of euros
DIGITAL AD SPEND 2017
#IABInversión
III. International Analysis
#IABInversión
DIGITAL AD SPEND 2017
#IABInversión
Digital ad spending estimated by PwCen in the
rest of the world in 2017
251670
10,948
2,322
ChinaUKItalia
80,738
3,858
76,880
AustraliaSouth
Africa
USA Germany Russia Turkey Asian
Pacific
2,446
France Brasil MexicoEMEA
1,964 1,057
58,773
North
America
Canada
39,580
3,782
6,074 4,414
35,449
4,243
LatAm
Source: PwC Global Entertainment and Media Outlook 2018-2022
22%
34%
12%
32%
22%
34%
14%
28%
10%
24%
8%
25%
13%
27%
17%
44%
25%
33%
16%
26%
27%
8%
19%
35%
5%
35%
24%
51%
14%
19%
10%
18%
19%
22%
Digital investment (€ million) Weight of digital over total advertising investmentGrowth vs 2016
DIGITAL AD SPEND 2017
#IABInversión
International Analysis
Source: IAB USA
DIGITAL AD SPEND 2017
#IABInversión
Source: IAB USA
International Analysis
DIGITAL AD SPEND 2017
#IABInversión
Source: IAB Europe
International Analysis
DIGITAL AD SPEND 2017
#IABInversión
Source: IAB Europe
International Analysis
DIGITAL AD SPEND 2017
#IABInversión
Source: IAB UK
International Analysis
DIGITAL AD SPEND 2017
#IABInversión
Source: IAB UK
International Analysis
DIGITAL AD SPEND 2017
#IABInversión
Source: IAB UK
International Analysis
DIGITAL AD SPEND 2017
#IABInversión
Source: SRI-France
International Analysis
DIGITAL AD SPEND 2017
#IABInversión
Source: SRI-France
International Analysis
DIGITAL AD SPEND 2017
#IABInversión
Source: BVDW
International Analysis
DIGITAL AD SPEND 2017
#IABInversión
Source: IAB Ireland
International Analysis
DIGITAL AD SPEND 2017
#IABInversión
Source: IAB Nederland
International Analysis
DIGITAL AD SPEND 2017
#IABInversión
Source: IAB Nederland
International Analysis
DIGITAL AD SPEND 2017
#IABInversión
Source: IAB Polska
International Analysis
DIGITAL AD SPEND 2017
#IABInversión
Source: IAB Turkey
International Analysis
DIGITAL AD SPEND 2017
#IABInversión
Source: IAB Australia
International Analysis
DIGITAL AD SPEND 2017
#IABInversión
Source: IAB Australia
International Analysis
DIGITAL AD SPEND 2017
#IABInversión
IV. Conclusions
#IABInversión
DIGITAL AD SPEND 2017
#IABInversión
• Digital advertising spending in Spain grew by 9.1% compared to 2016 and stood
at 1,708.1 million euros. This figure includes investment in Desktop, Mobile,
DOOH and Digital Audio.
• Digital advertising spending now accounts for 31% of total investment in
conventional media, consolidating the second position and shortening the
distance to television.
• The digital medium is the medium that gains the most market share in total
advertising investment. The rest are down, except for cinema, which is slightly up.
CONCLUSIONS GENERAL OVERVIEW
DIGITAL AD SPEND 2017
#IABInversión
• Search (Desktop + Mobile) maintains the majority of investment with 51% compared to the rest with 871, 6
million euros. Display reduces its weight to 35.6%, dropping 2 pp compared to last year.
• The most active sectors in 2017 were Automotive (25.3%), Retail (10.5%) and Food and Drinks (9.8%).
• Investment in multi-device campaigns increased and exclusive Desktop (7.07%) and exclusive Mobile
(4.63%) campaigns fell. On the other hand, advertising in traditional formats accounts for 80% of the total
investment, compared to 20% in premium formats.
• The CPM pricing model is still the most used in Video. In Display, branding campaigns prevail (73.49%)
over performance (26.51%).
• The Programmatic Buying has not taken off yet. In Display it increases slightly to 21.2% and in Video it
decreases slightly to 15.2%.
CONCLUSIONS DESKTOP AND MOBILE
DIGITAL AD SPEND 2017
#IABInversión
• Investment in DOOH grows almost 60% and represents 2.7% of total digital
investment with 45,7% million euros.
• Digital Audio Online represents 0.3% of the total value of the digital advertising
investment with 5,8M€.
CONCLUSIONS DOOH AND DIGITAL AUDIO
DIGITAL AD SPEND 2017
#IABInversión
V. TRENDS
#IABInversión
DIGITAL AD SPEND 2017
#IABInversión
TRENDS GENERAL OVERVIEW
• Minimum growth in digital ad spending estimated at around 10% by 2018
• The programmatic buying is already expected to reach 25% of the total investment.
• Video will continue to be one of the main drivers of the digital sector and is
expected to increase by over 15%.
• Native advertising and Branded Content will continue to increase their weight within
the investment of advertisers.
DIGITAL AD SPEND 2017
#IABInversión
Jorge Planes – Manager
jorge.planes.trillo@es.pwc.com
Reyes Justribó – General Manager
reyes.justribo@iabspain.es
Belén Acebes – Marketing and Research Manager
belen@iabspain.net
#IABInversión
DIGITAL AD SPEND 2017

IAB Spain Digital Ad Spend 2017 Report

  • 1.
    DIGITAL AD SPEND2017 #IABInversión DIGITAL AD SPEND 2017 full year results
  • 2.
    DIGITAL AD SPEND2017 #IABInversión INDEX I. Methodology • Objectives • Basis of Analysis • Technical datasheet • Representativeness • Sample Profile • Participants II. Results • Media overview • Advertisers ranking 1. Desktop & Mobile Display • Pricing • Ad format • Device • Procurement Video • Pricing • Ad format • Device • Procurement Search • Device 2. Digital Signage 3. Digital Audio III. International Analysis IV. Conclusions V. Trends
  • 3.
    DIGITAL AD SPEND2017 #IABInversión I. Methodology • Objectives • Basis of Analysis • Technical datasheet • Representativeness • Sample Profile • Participants #IABInversión 2017DIGITAL AD SPEND
  • 4.
    DIGITAL AD SPEND2017 #IABInversión Methodology Objectives Objectives • This study, which has been carried out annually by IAB Spain since 2002, has as its main objective to provide the digital advertising industry with a report on media buying trends and to give an investment figure. • This study is carried out on the basis of data provided by media agencies. These data have been compiled following a strict confidentiality agreement signed by PwC with the participants of the study. • PwC aggregated the data provided by the study participants. This aggregated information has been provided to IAB for its treatment and analysis.
  • 5.
    DIGITAL AD SPEND2017 #IABInversión Methodology Basis of Analysis Basis of Analysis • For the calculation of investment percentages by sector, pricing model, format, procurement model and publisher, an extrapolation is made of the data provided by the participants in order to obtain total investment data on the Internet. • The investment in Desktop, Mobile, Digital Signage and Digital Audio is obtained from the sum of: • Controlled investment: provided by the study participants. Includes Display, Search and Video advertising for the Desktop and Mobile, Digital Signage and Digital Audio sections. • Estimated investment: a figure estimated by IAB based on the Market Monitoring panel of publishers on the ad buying that is managed by the advertiser directly with the publisher without the media agency intervening.
  • 6.
    DIGITAL AD SPEND2017 #IABInversión Methodology Technical datasheet Technical datasheet • Sample o DESKTOP & MOBILE:  13 Display participants  13 Video participants  13 Search participants o DIGITAL SIGNAGE  6 participants o DIGITAL AUDIO  9 participants • Study type Tracking with biannual periodicity to panel of companies. • Universe Media agencies associated and not associated to IAB Spain. • Selection method From databases owned by IAB, an invitation to participate was sent. • Type of questionnaire Structured (closed-ended questions).
  • 7.
    DIGITAL AD SPEND2017 #IABInversión Methodology Representation – Desktop & Mobile o Display DESKTOP & MOBILE: - Pricing: 100% - Ad formats: 100% - Commercialisation Model (programmatic/negotiated):100 % - Type of programmatic: 73,51% - Device: 100% Representativeness of the data (The percentage of data representativeness indicates the proportion between the reported investment in each category (pricing, formats, etc.) and the total investment reported for the media-type of advertising (e.g. Desktop-display). o Video DESKTOP & MOBILE: - Pricing: 80,38% - Ad formats (Instream video, Instream display, Outstream): 100% - Commercialisation Model (programmatic/negotiated): 100% - Type of programmatic: 65,08% - Device: 100% o Search DESKTOP & MOBILE: - Device: 100%
  • 8.
    DIGITAL AD SPEND2017 #IABInversión Sample Profile Participating companies DESKTOP & MOBILE: 13 companies DIGITAL SIGNAGE: 6 companies DIGITAL AUDIO: 9 companies Basis for study: 13 participating companies
  • 9.
    DIGITAL AD SPEND2017 #IABInversión Participants Media agencies
  • 10.
    DIGITAL AD SPEND2017 #IABInversión • Desktop & Mobile • Digital Signage • Digital Audio II. Results Media overview #IABInversión DIGITAL AD SPEND 2017
  • 11.
    DIGITAL AD SPEND2017 #IABInversión Results Total digital ad spending 2017 TOTAL DIGITAL AD SPENDING *Data in millions of euros DIGITAL AD SPEND
  • 12.
    DIGITAL AD SPEND2017 #IABInversión Results Ad spend distribution in media Source : Infoadex / IAB Spain 2017 • * DeskTop + Mobile + Digital Signage + Digital Audio+ Connected TV until 2016 • In 2017 data does not include investment in connected TV TV NEWSPAPERS RADIO OUT-OF-HOME MAGAZINES CINEMA MILLIONS OF EUROS SUNDAY SUPPLEMENT GROWTH % 2016 to 2017
  • 13.
    DIGITAL AD SPEND2017 #IABInversión Results Representation of the media according to ad spend 2017 * Desktop + Mobile + Digital Signage + Audio Online Fuente : Infoadex / IAB Spain 2017 Magazines Radio Newspapers Out-of-Home TV Cinema Sunday supplement
  • 14.
    DIGITAL AD SPEND2017 #IABInversión Advertisers Digital ad spending by activity of the advertiser Source : Market Monitoring 2017
  • 15.
    DIGITAL AD SPEND2017 #IABInversión Advertisers Ranking digital advertisers Source : Market Monitoring 2017
  • 16.
    DIGITAL AD SPEND2017 #IABInversión Results Total digital ad spending 2017 TOTAL DIGITAL AD SPENDING *Data in millions of euros
  • 17.
    DIGITAL AD SPEND2017 #IABInversión Results Total digital ad spending 2017 Comparative annual total digital ad spend *Previous methodology (sample: publishers) *Data in millions of euros
  • 18.
    DIGITAL AD SPEND2017 #IABInversión 1. Desktop & Mobile 2. Digital Signage 3. Digital Audio II. Results DIGITAL AD SPEND 2017
  • 19.
    DIGITAL AD SPEND2017 #IABInversión TOTAL DIGITAL AD SPENDING Results Total digital ad spending 2017 *Data in millions of euros
  • 20.
    DIGITAL AD SPEND2017 #IABInversión Results DESKTOP & MOBILE Distribution of digital ad spend by device Question: Of the advertising investment NET in Desktop & Mobile divide the investment Percentage Desktop vs. Mobile ONLY ONLY
  • 21.
    DIGITAL AD SPEND2017 #IABInversión Results DESKTOP & MOBILE - Display TOTAL DIGITAL AD SPENDING *Data in millions of euros
  • 22.
    DIGITAL AD SPEND2017 #IABInversión Results DESKTOP & MOBILE - Display: Ad formats Question: Of the NET advertising investment in Mobile & Display, divided according to the pricing models used. Premium ad formats (Brand days, IAB Rising Starts…) Display standard (Banner, megabanner, skyscrapper…)
  • 23.
    DIGITAL AD SPEND2017 #IABInversión Results DESKTOP & MOBILE - Video TOTAL DIGITAL AD SPENDING *Data in millions of euros
  • 24.
    DIGITAL AD SPEND2017 #IABInversión Results DESKTOP & MOBILE - Video: ad formats Question: From Desktop & Mobile's NET advertising investment - Video - divide percentage by format type.
  • 25.
    DIGITAL AD SPEND2017 #IABInversión Results DESKTOP & MOBILE Comparative Programmatic Buying: Display and Video Question: From the NET advertising investment in Desktop & Mobile- divide Percentage of Negotiated Purchase vs. Programmatic Purchase. Progammatic
  • 26.
    DIGITAL AD SPEND2017 #IABInversión Results DESKTOP & MOBILE - Search TOTAL DIGITAL AD SPENDING *Data in millions of euros
  • 27.
    DIGITAL AD SPEND2017 #IABInversión 1. Desktop & Mobile 2. Digital Signage 3. Digital Audio II. Results #IABInversión DIGITAL AD SPEND 2017
  • 28.
    DIGITAL AD SPEND2017 #IABInversión Results DIGITAL SIGNAGE TOTAL DIGITAL AD SPENDING *Data in millions of euros
  • 29.
    DIGITAL AD SPEND2017 #IABInversión 1. Desktop & Mobile 2. Digital Signage 3. Audio Online II. Results #IABInversión DIGITAL AD SPEND 2017
  • 30.
    DIGITAL AD SPEND2017 #IABInversión Results DIGITAL AUDIO TOTAL DIGITAL AD SPENDING *Data in millions of euros
  • 31.
    DIGITAL AD SPEND2017 #IABInversión III. International Analysis #IABInversión DIGITAL AD SPEND 2017
  • 32.
    DIGITAL AD SPEND2017 #IABInversión Digital ad spending estimated by PwCen in the rest of the world in 2017 251670 10,948 2,322 ChinaUKItalia 80,738 3,858 76,880 AustraliaSouth Africa USA Germany Russia Turkey Asian Pacific 2,446 France Brasil MexicoEMEA 1,964 1,057 58,773 North America Canada 39,580 3,782 6,074 4,414 35,449 4,243 LatAm Source: PwC Global Entertainment and Media Outlook 2018-2022 22% 34% 12% 32% 22% 34% 14% 28% 10% 24% 8% 25% 13% 27% 17% 44% 25% 33% 16% 26% 27% 8% 19% 35% 5% 35% 24% 51% 14% 19% 10% 18% 19% 22% Digital investment (€ million) Weight of digital over total advertising investmentGrowth vs 2016
  • 33.
    DIGITAL AD SPEND2017 #IABInversión International Analysis Source: IAB USA
  • 34.
    DIGITAL AD SPEND2017 #IABInversión Source: IAB USA International Analysis
  • 35.
    DIGITAL AD SPEND2017 #IABInversión Source: IAB Europe International Analysis
  • 36.
    DIGITAL AD SPEND2017 #IABInversión Source: IAB Europe International Analysis
  • 37.
    DIGITAL AD SPEND2017 #IABInversión Source: IAB UK International Analysis
  • 38.
    DIGITAL AD SPEND2017 #IABInversión Source: IAB UK International Analysis
  • 39.
    DIGITAL AD SPEND2017 #IABInversión Source: IAB UK International Analysis
  • 40.
    DIGITAL AD SPEND2017 #IABInversión Source: SRI-France International Analysis
  • 41.
    DIGITAL AD SPEND2017 #IABInversión Source: SRI-France International Analysis
  • 42.
    DIGITAL AD SPEND2017 #IABInversión Source: BVDW International Analysis
  • 43.
    DIGITAL AD SPEND2017 #IABInversión Source: IAB Ireland International Analysis
  • 44.
    DIGITAL AD SPEND2017 #IABInversión Source: IAB Nederland International Analysis
  • 45.
    DIGITAL AD SPEND2017 #IABInversión Source: IAB Nederland International Analysis
  • 46.
    DIGITAL AD SPEND2017 #IABInversión Source: IAB Polska International Analysis
  • 47.
    DIGITAL AD SPEND2017 #IABInversión Source: IAB Turkey International Analysis
  • 48.
    DIGITAL AD SPEND2017 #IABInversión Source: IAB Australia International Analysis
  • 49.
    DIGITAL AD SPEND2017 #IABInversión Source: IAB Australia International Analysis
  • 50.
    DIGITAL AD SPEND2017 #IABInversión IV. Conclusions #IABInversión DIGITAL AD SPEND 2017
  • 51.
    DIGITAL AD SPEND2017 #IABInversión • Digital advertising spending in Spain grew by 9.1% compared to 2016 and stood at 1,708.1 million euros. This figure includes investment in Desktop, Mobile, DOOH and Digital Audio. • Digital advertising spending now accounts for 31% of total investment in conventional media, consolidating the second position and shortening the distance to television. • The digital medium is the medium that gains the most market share in total advertising investment. The rest are down, except for cinema, which is slightly up. CONCLUSIONS GENERAL OVERVIEW
  • 52.
    DIGITAL AD SPEND2017 #IABInversión • Search (Desktop + Mobile) maintains the majority of investment with 51% compared to the rest with 871, 6 million euros. Display reduces its weight to 35.6%, dropping 2 pp compared to last year. • The most active sectors in 2017 were Automotive (25.3%), Retail (10.5%) and Food and Drinks (9.8%). • Investment in multi-device campaigns increased and exclusive Desktop (7.07%) and exclusive Mobile (4.63%) campaigns fell. On the other hand, advertising in traditional formats accounts for 80% of the total investment, compared to 20% in premium formats. • The CPM pricing model is still the most used in Video. In Display, branding campaigns prevail (73.49%) over performance (26.51%). • The Programmatic Buying has not taken off yet. In Display it increases slightly to 21.2% and in Video it decreases slightly to 15.2%. CONCLUSIONS DESKTOP AND MOBILE
  • 53.
    DIGITAL AD SPEND2017 #IABInversión • Investment in DOOH grows almost 60% and represents 2.7% of total digital investment with 45,7% million euros. • Digital Audio Online represents 0.3% of the total value of the digital advertising investment with 5,8M€. CONCLUSIONS DOOH AND DIGITAL AUDIO
  • 54.
    DIGITAL AD SPEND2017 #IABInversión V. TRENDS #IABInversión DIGITAL AD SPEND 2017
  • 55.
    DIGITAL AD SPEND2017 #IABInversión TRENDS GENERAL OVERVIEW • Minimum growth in digital ad spending estimated at around 10% by 2018 • The programmatic buying is already expected to reach 25% of the total investment. • Video will continue to be one of the main drivers of the digital sector and is expected to increase by over 15%. • Native advertising and Branded Content will continue to increase their weight within the investment of advertisers.
  • 56.
    DIGITAL AD SPEND2017 #IABInversión Jorge Planes – Manager jorge.planes.trillo@es.pwc.com Reyes Justribó – General Manager reyes.justribo@iabspain.es Belén Acebes – Marketing and Research Manager belen@iabspain.net #IABInversión DIGITAL AD SPEND 2017