This document provides an overview of understanding corporate annual reports. It discusses what an annual report is and its purpose of informing stockholders about a company's financial performance and operations. The Securities and Exchange Commission requires publicly traded companies to publish annual reports and keep stockholders informed. Financial statements like the income statement, balance sheet, and statement of cash flows are included in annual reports to provide information on earnings, financial position, and cash flows. The document also reviews accounting standards and regulations companies must follow in preparing financial statements.

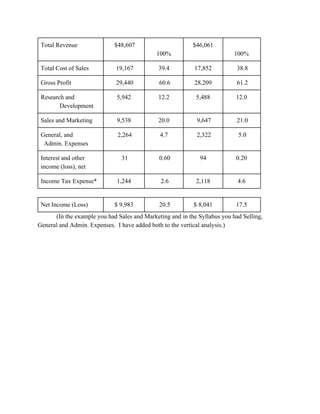


![[Ebooks PDF] download Intermediate Accounting 11th Edition Donald E. Kieso fu...](https://cdn.slidesharecdn.com/ss_thumbnails/12497-250104233912-0c9becde-thumbnail.jpg?width=640&height=640&fit=bounds)


