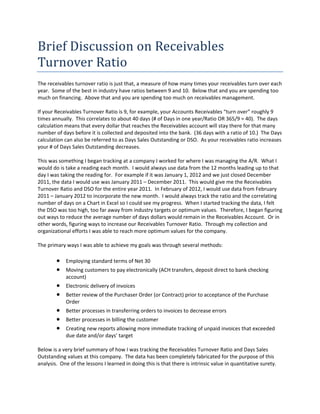
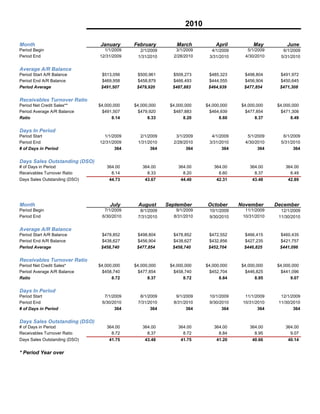
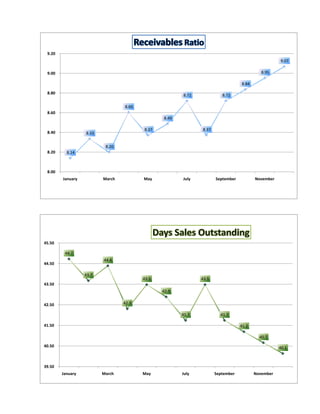
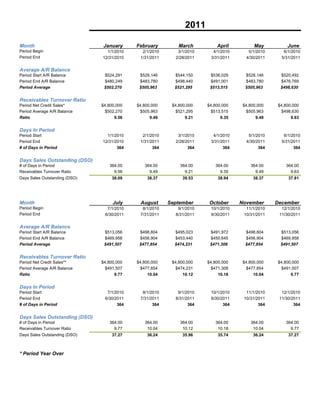
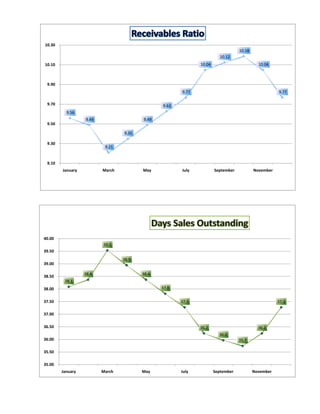
Brief Discussion on Receivables 
Turnover Ratio 
The receivables turnover ratio is just that, a measure of how many times your receivables turn over each 
year.  Some of the best in industry have ratios between 9 and 10.  Below that and you are spending too 
much on financing.  Above that and you are spending too much on receivables management.   
 
If your Receivables Turnover Ratio is 9, for example, your Accounts Receivables “turn over” roughly 9 
times annually.  This correlates to about 40 days (# of Days in one year/Ratio OR 365/9 = 40).  The days 
calculation means that every dollar that reaches the Receivables account will stay there for that many 
number of days before it is collected and deposited into the bank.  (36 days with a ratio of 10.)  The Days 
calculation can also be referred to as Days Sales Outstanding or DSO.  As your receivables ratio increases 
your # of Days Sales Outstanding decreases.   
 
This was something I began tracking at a company I worked for where I was managing the A/R.  What I 
would do is take a reading each month.  I would always use data from the 12 months leading up to that 
day I was taking the reading for.  For example if it was January 1, 2012 and we just closed December 
2011, the data I would use was January 2011 – December 2011.  This would give me the Receivables 
Turnover Ratio and DSO for the entire year 2011.  In February of 2012, I would use data from February 
2011 – January 2012 to incorporate the new month.  I would always track the ratio and the correlating 
number of days on a Chart in Excel so I could see my progress.  When I started tracking the data, I felt 
the DSO was too high, too far away from industry targets or optimum values.  Therefore, I began figuring 
out ways to reduce the average number of days dollars would remain in the Receivables Account.  Or in 
other words, figuring ways to increase our Receivables Turnover Ratio.  Through my collection and 
organizational efforts I was able to reach more optimum values for the company. 
 
The primary ways I was able to achieve my goals was through several methods: 
 
            Employing standard terms of Net 30 
            Moving customers to pay electronically (ACH transfers, deposit direct to bank checking 
             account) 
            Electronic delivery of invoices 
            Better review of the Purchaser Order (or Contract) prior to acceptance of the Purchase 
             Order 
            Better processes in transferring orders to invoices to decrease errors 
            Better processes in billing the customer 
            Creating new reports allowing more immediate tracking of unpaid invoices that exceeded 
             due date and/or days’ target 
              
Below is a very brief summary of how I was tracking the Receivables Turnover Ratio and Days Sales 
Outstanding values at this company.  The data has been completely fabricated for the purpose of this 
analysis.  One of the lessons I learned in doing this is that there is intrinsic value in quantitative surety. 
2010

Month                          January      February         March          April          May         June
Period Begin                     1/1/2009     2/1/2009      3/1/2009      4/1/2009      5/1/2009      6/1/2009
Period End                     12/31/2009    1/31/2010     2/28/2010     3/31/2010     4/30/2010     5/31/2010

Average A/R Balance
Period Start A/R Balance        $513,056     $500,961      $509,273      $485,323      $498,804     $491,972
Period End A/R Balance          $469,958     $458,879      $466,493      $444,555      $456,904     $450,645
Period Average                  $491,507     $479,920      $487,883      $464,939      $477,854     $471,308


Receivables Turnover Ratio
Period Net Credit Sales**      $4,000,000   $4,000,000    $4,000,000    $4,000,000    $4,000,000   $4,000,000
Period Average A/R Balance      $491,507     $479,920      $487,883      $464,939      $477,854     $471,308
Ratio                                8.14         8.33          8.20          8.60          8.37         8.49


Days In Period
Period Start                     1/1/2009     2/1/2009      3/1/2009      4/1/2009      5/1/2009      6/1/2009
Period End                     12/31/2009    1/31/2010     2/28/2010     3/31/2010     4/30/2010     5/31/2010
# of Days in Period                   364          364           364           364           364           364


Days Sales Outstanding (DSO)
# of Days in Period               364.00       364.00        364.00        364.00        364.00        364.00
Receivables Turnover Ratio          8.14         8.33          8.20          8.60          8.37          8.49
Days Sales Outstanding (DSO)       44.73         43.67         44.40         42.31         43.48        42.89


Month                               July     August      September      October      November      December
Period Begin                     7/1/2009     8/1/2009      9/1/2009     10/1/2009     11/1/2009     12/1/2009
Period End                      6/30/2010    7/31/2010     8/31/2010     9/30/2010    10/31/2010    11/30/2010

Average A/R Balance
Period Start A/R Balance        $478,852     $498,804      $478,852      $472,552      $466,415     $460,435
Period End A/R Balance          $438,627     $456,904      $438,627      $432,856      $427,235     $421,757
Period Average                  $458,740     $477,854      $458,740      $452,704      $446,825     $441,096


Receivables Turnover Ratio
Period Net Credit Sales*       $4,000,000   $4,000,000    $4,000,000    $4,000,000    $4,000,000   $4,000,000
Period Average A/R Balance      $458,740     $477,854      $458,740      $452,704      $446,825     $441,096
Ratio                                8.72         8.37          8.72          8.84          8.95         9.07


Days In Period
Period Start                     7/1/2009     8/1/2009      9/1/2009     10/1/2009     11/1/2009     12/1/2009
Period End                      6/30/2010    7/31/2010     8/31/2010     9/30/2010    10/31/2010    11/30/2010
# of Days in Period                   364          364           364           364           364           364


Days Sales Outstanding (DSO)
# of Days in Period               364.00       364.00        364.00        364.00        364.00        364.00
Receivables Turnover Ratio          8.72         8.37          8.72          8.84          8.95          9.07
Days Sales Outstanding (DSO)       41.75         43.48         41.75         41.20         40.66        40.14


* Period Year over
9.20 
                                                                                                           9.07 

 9.00                                                                                              8.95 

                                                                                        8.84 

 8.80 
                                                            8.72               8.72 

                                    8.60 
 8.60 
                                                    8.49 

                                            8.37                    8.37 
 8.40              8.33 


                            8.20 
 8.20      8.14 


 8.00 
         January           March            May             July            September           November


45.50 
45 50

          44.7
                           44.4
44.50 

                   43.7
                                            43.5                    43.5
43.50 
                                                    42 9
                                                    42.9


42.50                               42.3

                                                            41.7              41.7

41.50                                                                                   41.2

                                                                                                  40.7

40.50                                                                                                      40.1


39.50 
         January           March            May             July            September           November
2011

Month                          January      February         March         April          May         June
Period Begin                     1/1/2010     2/1/2010      3/1/2010     4/1/2010      5/1/2010      6/1/2010
Period End                     12/31/2010    1/31/2011     2/28/2011    3/31/2011     4/30/2011     5/31/2011


Average A/R Balance
Period Start A/R Balance        $524,291     $528,146      $544,150     $536,029      $528,146     $520,492
Period End A/R Balance          $480,249     $483,780      $498,440     $491,001      $483,780     $476,769
Period Average                  $502,270     $505,963      $521,295     $513,515      $505,963     $498,630


Receivables Turnover Ratio
Period Net Credit Sales*       $4,800,000   $4,800,000    $4,800,000   $4,800,000    $4,800,000   $4,800,000
Period Average A/R Balance      $502,270     $505,963      $521,295     $513,515      $505,963     $498,630
Ratio                                9.56         9.49          9.21         9.35          9.49         9.63


Days In Period
Period Start                     1/1/2010     2/1/2010      3/1/2010     4/1/2010      5/1/2010      6/1/2010
Period End                     12/31/2010    1/31/2011     2/28/2011    3/31/2011     4/30/2011     5/31/2011
# of Days in Period                   364          364           364          364           364           364


Days Sales Outstanding (DSO)
# of Days in Period               364.00       364.00        364.00       364.00        364.00        364.00
Receivables Turnover Ratio          9.56         9.49          9.21         9.35          9.49          9.63
Days Sales Outstanding (DSO)        38.09        38.37         39.53        38.94         38.37        37.81


Month                               July     August      September     October      November      December
Period Begin                     7/1/2010     8/1/2010      9/1/2010    10/1/2010     11/1/2010     12/1/2010
Period End                      6/30/2011    7/31/2011     8/31/2011    9/30/2011    10/31/2011    11/30/2011


Average A/R Balance
Period Start A/R Balance        $513,056     $498,804      $495,023     $491,972      $498,804     $513,056
Period End A/R Balance          $469,958     $456,904      $453,440     $450,645      $456,904     $469,958
Period Average                  $491,507     $477,854      $474,231     $471,308      $477,854     $491,507


Receivables Turnover Ratio
Period Net Credit Sales**      $4,800,000   $4,800,000    $4,800,000   $4,800,000    $4,800,000   $4,800,000
Period Average A/R Balance      $491,507     $477,854      $474,231     $471,308      $477,854     $491,507
Ratio                                9.77        10.04         10.12        10.18         10.04         9.77


Days In Period
Period Start                     7/1/2010     8/1/2010      9/1/2010    10/1/2010     11/1/2010     12/1/2010
Period End                      6/30/2011    7/31/2011     8/31/2011    9/30/2011    10/31/2011    11/30/2011
# of Days in Period                   364          364           364          364           364           364


Days Sales Outstanding (DSO)
# of Days in Period               364.00       364.00        364.00       364.00        364.00        364.00
Receivables Turnover Ratio          9.77        10.04         10.12        10.18         10.04          9.77
Days Sales Outstanding (DSO)        37.27        36.24         35.96        35.74         36.24        37.27


* Period Year Over
10.30 
                                                                                         10.18 
                                                                               10.12 
10.10                                                               10.04                           10.04 


 9.90 
                                                            9.77                                             9.77 

 9.70                                               9.63 
           9.56 
                   9.49                     9.49 
 9.50 

                                    9.35 

 9.30 
                            9.21 


 9.10 
         January           March            May             July             September            November


40.00 
                           39.5
39.50 
                                    38.9
39.00 

                   38.4                     38.4
38.50 
          38.1
38.00
38.00                                               37.8


37.50                                                       37.3                                             37.3

37.00 

36.50                                                               36.2                            36.2
                                                                               36.0
36.00 
36 00                                                                                    35.7

35.50 

35.00 
         January           March            May             July             September            November

Accounts Receivable Turnover Ratio