Download to read offline

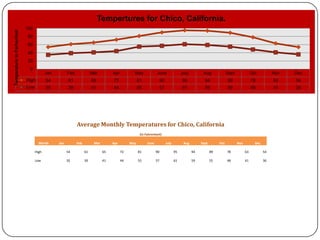
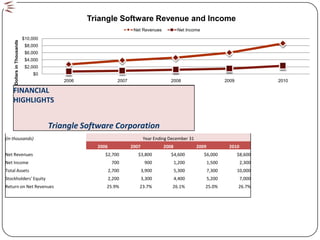
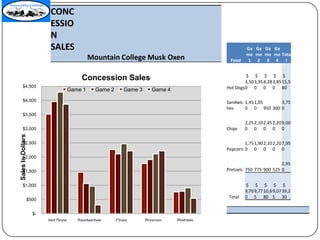
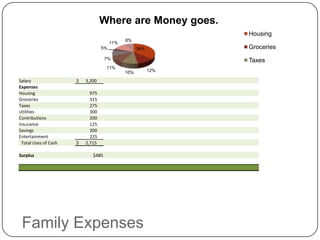
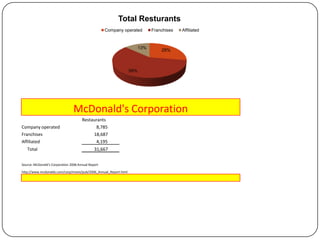

The document contains various charts and tables with data about temperatures, revenues, expenses, test scores, running times and more. It includes a chart showing average monthly temperatures for Chico, California, a table with revenue and income data for Triangle Software Corporation from 2006 to 2010, and a pie chart breaking down McDonald's restaurants by company operated, franchises and affiliated locations. The data sets and visualizations provide information on a variety of topics to help explain and illustrate different lessons.


