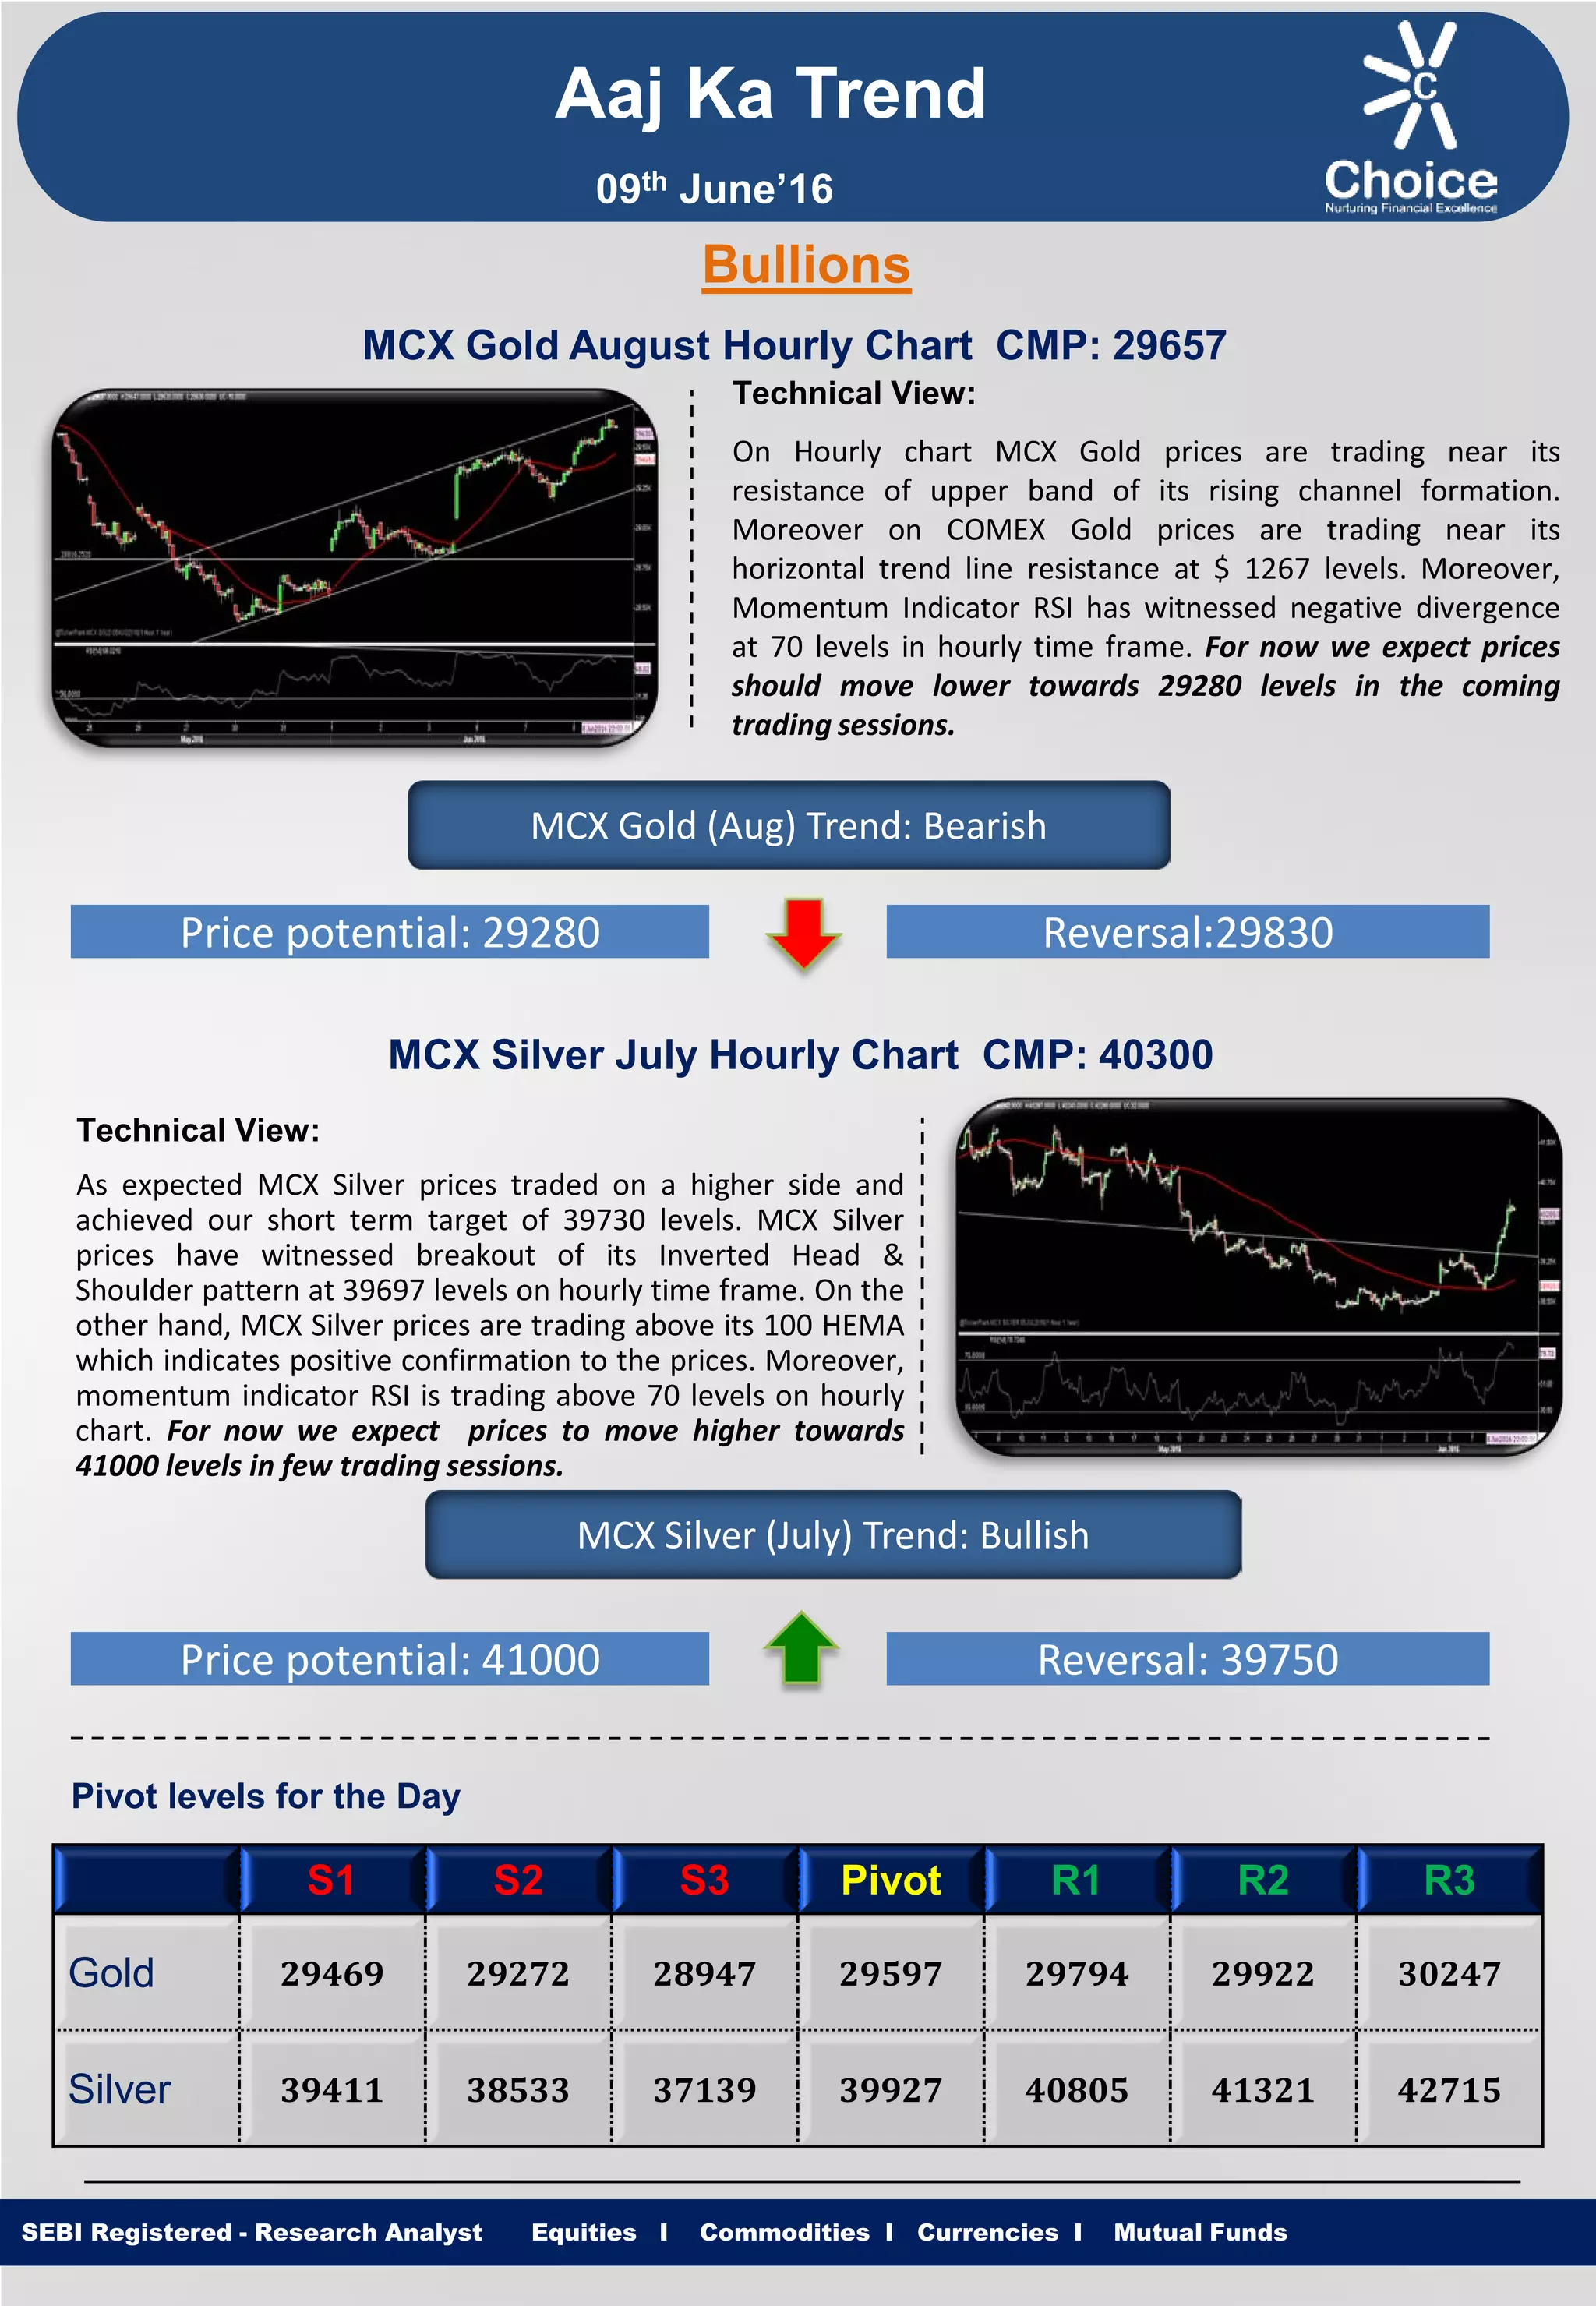
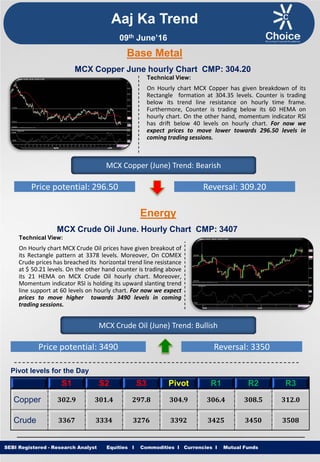
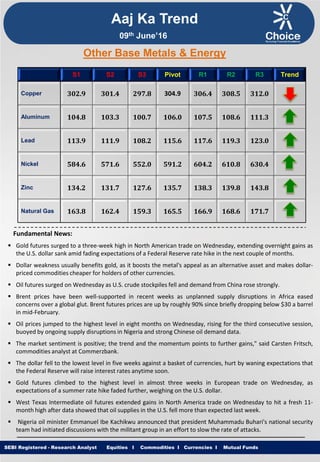
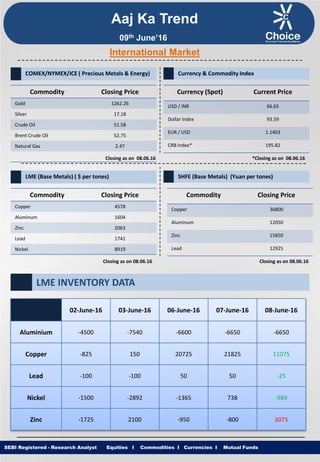
Equities I Commodities I Currencies I Mutual Funds
Aaj Ka Trend
Technical View:
On Hourly chart MCX Gold prices are trading near its
resistance of upper band of its rising channel formation.
Moreover on COMEX Gold prices are trading near its
horizontal trend line resistance at $ 1267 levels. Moreover,
Momentum Indicator RSI has witnessed negative divergence
at 70 levels in hourly time frame. For now we expect prices
should move lower towards 29280 levels in the coming
trading sessions.
SEBI Registered - Research Analyst Equities I Commodities I Currencies I Mutual Funds
Bullions
MCX Gold August Hourly Chart CMP: 29657
MCX Gold (Aug) Trend: Bearish
Price potential: 29280 Reversal:29830
MCX Silver July Hourly Chart CMP: 40300
Technical View:
As expected MCX Silver prices traded on a higher side and
achieved our short term target of 39730 levels. MCX Silver
prices have witnessed breakout of its Inverted Head &
Shoulder pattern at 39697 levels on hourly time frame. On the
other hand, MCX Silver prices are trading above its 100 HEMA
which indicates positive confirmation to the prices. Moreover,
momentum indicator RSI is trading above 70 levels on hourly
chart. For now we expect prices to move higher towards
41000 levels in few trading sessions.
MCX Silver (July) Trend: Bullish
Price potential: 41000 Reversal: 39750
Pivot levels for the Day
S1 S2 S3 Pivot R1 R2 R3
Gold 29469 29272 28947 29597 29794 29922 30247
Silver 39411 38533 37139 39927 40805 41321 42715
09th June’16
Equities I Commodities I Currencies I Mutual Funds
Technical View:
On Hourly chart MCX Copper has given breakdown of its
Rectangle formation at 304.35 levels. Counter is trading
below its trend line resistance on hourly time frame.
Furthermore, Counter is trading below its 60 HEMA on
hourly chart. On the other hand, momentum indicator RSI
has drift below 40 levels on hourly chart. For now we
expect prices to move lower towards 296.50 levels in
coming trading sessions.
SEBI Registered - Research Analyst Equities I Commodities I Currencies I Mutual Funds
MCX Copper June hourly Chart CMP: 304.20
MCX Copper (June) Trend: Bearish
Price potential: 296.50 Reversal: 309.20
MCX Crude Oil June. Hourly Chart CMP: 3407
Technical View:
On Hourly chart MCX Crude Oil prices have given breakout of
its Rectangle pattern at 3378 levels. Moreover, On COMEX
Crude prices has breached its horizontal trend line resistance
at $ 50.21 levels. On the other hand counter is trading above
its 21 HEMA on MCX Crude Oil hourly chart. Moreover,
Momentum indicator RSI is holding its upward slanting trend
line support at 60 levels on hourly chart. For now we expect
prices to move higher towards 3490 levels in coming
trading sessions.
MCX Crude Oil (June) Trend: Bullish
Price potential: 3490 Reversal: 3350
Pivot levels for the Day
S1 S2 S3 Pivot R1 R2 R3
Copper 302.9 301.4 297.8 304.9 306.4 308.5 312.0
Crude 3367 3334 3276 3392 3425 3450 3508
Base Metal
Energy
Aaj Ka Trend
09th June’16
Equities I Commodities I Currencies I Mutual FundsSEBI Registered - Research Analyst Equities I Commodities I Currencies I Mutual Funds
Other Base Metals & Energy
S1 S2 S3 Pivot R1 R2 R3 Trend
Copper 302.9 301.4 297.8 304.9 306.4 308.5 312.0
Aluminum 104.8 103.3 100.7 106.0 107.5 108.6 111.3
Lead 113.9 111.9 108.2 115.6 117.6 119.3 123.0
Nickel 584.6 571.6 552.0 591.2 604.2 610.8 630.4
Zinc 134.2 131.7 127.6 135.7 138.3 139.8 143.8
Natural Gas 163.8 162.4 159.3 165.5 166.9 168.6 171.7
Fundamental News:
 Gold futures surged to a three-week high in North American trade on Wednesday, extending overnight gains as
the U.S. dollar sank amid fading expectations of a Federal Reserve rate hike in the next couple of months.
 Dollar weakness usually benefits gold, as it boosts the metal's appeal as an alternative asset and makes dollar-
priced commodities cheaper for holders of other currencies.
 Oil futures surged on Wednesday as U.S. crude stockpiles fell and demand from China rose strongly.
 Brent prices have been well-supported in recent weeks as unplanned supply disruptions in Africa eased
concerns over a global glut. Brent futures prices are up by roughly 90% since briefly dropping below $30 a barrel
in mid-February.
 Oil prices jumped to the highest level in eight months on Wednesday, rising for the third consecutive session,
buoyed by ongoing supply disruptions in Nigeria and strong Chinese oil demand data.
 The market sentiment is positive; the trend and the momentum points to further gains," said Carsten Fritsch,
commodities analyst at Commerzbank.
 The dollar fell to the lowest level in five weeks against a basket of currencies, hurt by waning expectations that
the Federal Reserve will raise interest rates anytime soon.
 Gold futures climbed to the highest level in almost three weeks in European trade on Wednesday, as
expectations of a summer rate hike faded further, weighing on the U.S. dollar.
 West Texas Intermediate oil futures extended gains in North America trade on Wednesday to hit a fresh 11-
month high after data showed that oil supplies in the U.S. fell more than expected last week.
 Nigeria oil minister Emmanuel Ibe Kachikwu announced that president Muhammadu Buhari's national security
team had initiated discussions with the militant group in an effort to slow the rate of attacks.
Aaj Ka Trend
09th June’16
Equities I Commodities I Currencies I Mutual FundsSEBI Registered - Research Analyst Equities I Commodities I Currencies I Mutual Funds
International Market
Commodity Closing Price
Gold 1262.26
Silver 17.18
Crude Oil 51.58
Brent Crude Oil 52.75
Natural Gas 2.47
COMEX/NYMEX/ICE ( Precious Metals & Energy) Currency & Commodity Index
Currency (Spot) Current Price
USD / INR 66.65
Dollar Index 93.59
EUR / USD 1.1403
CRB Index* 195.82
Closing as on 08.06.16 *Closing as on 08.06.16
LME (Base Metals) ( $ per tones)
Commodity Closing Price
Copper 4578
Aluminum 1604
Zinc 2063
Lead 1741
Nickel 8919
SHFE (Base Metals) (Yuan per tones)
Commodity Closing Price
Copper 36800
Aluminum 12050
Zinc 15850
Lead 12925
Closing as on 08.06.16 Closing as on 08.06.16
LME INVENTORY DATA
Aaj Ka Trend
02-June-16 03-June-16 06-June-16 07-June-16 08-June-16
Aluminium -4500 -7540 -6600 -6650 -6650
Copper -825 150 20725 21825 11075
Lead -100 -100 50 50 -25
Nickel -1500 -2892 -1365 738 -984
Zinc -1725 2100 -950 -800 3075
09th June’16
Equities I Commodities I Currencies I Mutual Funds
This is solely for information of clients of Choice Broking and does not construe to be an investment advice. It is also not intended as an offer or solicitation
for the purchase and sale of any financial instruments. Any action taken by you on the basis of the information contained herein is your responsibility alone
and Choice Broking its subsidiaries or its employees or associates will not be liable in any manner for the consequences of such action taken by you. We
have exercised due diligence in checking the correctness and authenticity of the information contained in this recommendation, but Choice Broking or any of
its subsidiaries or associates or employees shall not be in any way responsible for any loss or damage that may arise to any person from any inadvertent
error in the information contained in this recommendation or any action taken on basis of this information. Technical analysis studies market psychology,
price patterns and volume levels. It is used to forecast future price and market movements. Technical analysis is complementary to fundamental analysis
and news sources. The recommendations issued herewith might be contrary to recommendations issued by Choice Broking in the company research
undertaken as the recommendations stated in this report is derived purely from technical analysis. Choice Broking has based this document on information
obtained from sources it believes to be reliable but which it has not independently verified; Choice Broking makes no guarantee, representation or warranty
and accepts no responsibility or liability as to its accuracy or completeness. The opinions contained within the report are based upon publicly available
information at the time of publication and are subject to change without notice. The information and any disclosures provided herein are in summary form
and have been prepared for informational purposes. The recommendations and suggested price levels are intended purely for trading purposes. The
recommendations are valid for the day of the report however trading trends and volumes might vary substantially on an intraday basis and the
recommendations may be subject to change. The information and any disclosures provided herein may be considered confidential. Any use, distribution,
modification, copying, forwarding or disclosure by any person is strictly prohibited. The information and any disclosures provided herein do not constitute a
solicitation or offer to purchase or sell any security or other financial product or instrument. The current performance may be unaudited. Past performance
does not guarantee future returns. There can be no assurance that investments will achieve any targeted rates of return, and there is no guarantee against
the loss of your entire investment.
POTENTIAL CONFLICT OF INTEREST DISCLOSURE (as on date of report) Disclosure of interest statement – • Analyst interest of the stock
/Instrument(s): - No. • Firm interest of the stock / Instrument (s): - No.
Disclaimer
Contact Us
Amit Pathania
Research Associate
amit.pathania@choiceindia.com
Rohan Patil
Research Associate
rohan.patil@choiceindia.com
www.choiceindia.comcustomercare@choiceindia.com
SEBI Registered - Research Analyst Equities I Commodities I Currencies I Mutual Funds
Aaj Ka Trend
09th June’16
Neeraj Yadav
Research Advisor
neeraj.yadav@choiceindia.com
Anish Vyas
Senior Research Associate
anish.vyas@choiceindia.com
Amit Pathania
Digitally signed by Amit Pathania
DN: cn=Amit Pathania, o=Choice Equity Broking Pvt. ltd, ou=Research
Department, email=amit.pathania@choiceindia.com, c=IN
Date: 2016.06.09 08:57:29 +05'30'

Aaj ka trend 09.06.16

  • 1.
    Equities I CommoditiesI Currencies I Mutual Funds Aaj Ka Trend Technical View: On Hourly chart MCX Gold prices are trading near its resistance of upper band of its rising channel formation. Moreover on COMEX Gold prices are trading near its horizontal trend line resistance at $ 1267 levels. Moreover, Momentum Indicator RSI has witnessed negative divergence at 70 levels in hourly time frame. For now we expect prices should move lower towards 29280 levels in the coming trading sessions. SEBI Registered - Research Analyst Equities I Commodities I Currencies I Mutual Funds Bullions MCX Gold August Hourly Chart CMP: 29657 MCX Gold (Aug) Trend: Bearish Price potential: 29280 Reversal:29830 MCX Silver July Hourly Chart CMP: 40300 Technical View: As expected MCX Silver prices traded on a higher side and achieved our short term target of 39730 levels. MCX Silver prices have witnessed breakout of its Inverted Head & Shoulder pattern at 39697 levels on hourly time frame. On the other hand, MCX Silver prices are trading above its 100 HEMA which indicates positive confirmation to the prices. Moreover, momentum indicator RSI is trading above 70 levels on hourly chart. For now we expect prices to move higher towards 41000 levels in few trading sessions. MCX Silver (July) Trend: Bullish Price potential: 41000 Reversal: 39750 Pivot levels for the Day S1 S2 S3 Pivot R1 R2 R3 Gold 29469 29272 28947 29597 29794 29922 30247 Silver 39411 38533 37139 39927 40805 41321 42715 09th June’16
  • 2.
    Equities I CommoditiesI Currencies I Mutual Funds Technical View: On Hourly chart MCX Copper has given breakdown of its Rectangle formation at 304.35 levels. Counter is trading below its trend line resistance on hourly time frame. Furthermore, Counter is trading below its 60 HEMA on hourly chart. On the other hand, momentum indicator RSI has drift below 40 levels on hourly chart. For now we expect prices to move lower towards 296.50 levels in coming trading sessions. SEBI Registered - Research Analyst Equities I Commodities I Currencies I Mutual Funds MCX Copper June hourly Chart CMP: 304.20 MCX Copper (June) Trend: Bearish Price potential: 296.50 Reversal: 309.20 MCX Crude Oil June. Hourly Chart CMP: 3407 Technical View: On Hourly chart MCX Crude Oil prices have given breakout of its Rectangle pattern at 3378 levels. Moreover, On COMEX Crude prices has breached its horizontal trend line resistance at $ 50.21 levels. On the other hand counter is trading above its 21 HEMA on MCX Crude Oil hourly chart. Moreover, Momentum indicator RSI is holding its upward slanting trend line support at 60 levels on hourly chart. For now we expect prices to move higher towards 3490 levels in coming trading sessions. MCX Crude Oil (June) Trend: Bullish Price potential: 3490 Reversal: 3350 Pivot levels for the Day S1 S2 S3 Pivot R1 R2 R3 Copper 302.9 301.4 297.8 304.9 306.4 308.5 312.0 Crude 3367 3334 3276 3392 3425 3450 3508 Base Metal Energy Aaj Ka Trend 09th June’16
  • 3.
    Equities I CommoditiesI Currencies I Mutual FundsSEBI Registered - Research Analyst Equities I Commodities I Currencies I Mutual Funds Other Base Metals & Energy S1 S2 S3 Pivot R1 R2 R3 Trend Copper 302.9 301.4 297.8 304.9 306.4 308.5 312.0 Aluminum 104.8 103.3 100.7 106.0 107.5 108.6 111.3 Lead 113.9 111.9 108.2 115.6 117.6 119.3 123.0 Nickel 584.6 571.6 552.0 591.2 604.2 610.8 630.4 Zinc 134.2 131.7 127.6 135.7 138.3 139.8 143.8 Natural Gas 163.8 162.4 159.3 165.5 166.9 168.6 171.7 Fundamental News:  Gold futures surged to a three-week high in North American trade on Wednesday, extending overnight gains as the U.S. dollar sank amid fading expectations of a Federal Reserve rate hike in the next couple of months.  Dollar weakness usually benefits gold, as it boosts the metal's appeal as an alternative asset and makes dollar- priced commodities cheaper for holders of other currencies.  Oil futures surged on Wednesday as U.S. crude stockpiles fell and demand from China rose strongly.  Brent prices have been well-supported in recent weeks as unplanned supply disruptions in Africa eased concerns over a global glut. Brent futures prices are up by roughly 90% since briefly dropping below $30 a barrel in mid-February.  Oil prices jumped to the highest level in eight months on Wednesday, rising for the third consecutive session, buoyed by ongoing supply disruptions in Nigeria and strong Chinese oil demand data.  The market sentiment is positive; the trend and the momentum points to further gains," said Carsten Fritsch, commodities analyst at Commerzbank.  The dollar fell to the lowest level in five weeks against a basket of currencies, hurt by waning expectations that the Federal Reserve will raise interest rates anytime soon.  Gold futures climbed to the highest level in almost three weeks in European trade on Wednesday, as expectations of a summer rate hike faded further, weighing on the U.S. dollar.  West Texas Intermediate oil futures extended gains in North America trade on Wednesday to hit a fresh 11- month high after data showed that oil supplies in the U.S. fell more than expected last week.  Nigeria oil minister Emmanuel Ibe Kachikwu announced that president Muhammadu Buhari's national security team had initiated discussions with the militant group in an effort to slow the rate of attacks. Aaj Ka Trend 09th June’16
  • 4.
    Equities I CommoditiesI Currencies I Mutual FundsSEBI Registered - Research Analyst Equities I Commodities I Currencies I Mutual Funds International Market Commodity Closing Price Gold 1262.26 Silver 17.18 Crude Oil 51.58 Brent Crude Oil 52.75 Natural Gas 2.47 COMEX/NYMEX/ICE ( Precious Metals & Energy) Currency & Commodity Index Currency (Spot) Current Price USD / INR 66.65 Dollar Index 93.59 EUR / USD 1.1403 CRB Index* 195.82 Closing as on 08.06.16 *Closing as on 08.06.16 LME (Base Metals) ( $ per tones) Commodity Closing Price Copper 4578 Aluminum 1604 Zinc 2063 Lead 1741 Nickel 8919 SHFE (Base Metals) (Yuan per tones) Commodity Closing Price Copper 36800 Aluminum 12050 Zinc 15850 Lead 12925 Closing as on 08.06.16 Closing as on 08.06.16 LME INVENTORY DATA Aaj Ka Trend 02-June-16 03-June-16 06-June-16 07-June-16 08-June-16 Aluminium -4500 -7540 -6600 -6650 -6650 Copper -825 150 20725 21825 11075 Lead -100 -100 50 50 -25 Nickel -1500 -2892 -1365 738 -984 Zinc -1725 2100 -950 -800 3075 09th June’16
  • 5.
    Equities I CommoditiesI Currencies I Mutual Funds This is solely for information of clients of Choice Broking and does not construe to be an investment advice. It is also not intended as an offer or solicitation for the purchase and sale of any financial instruments. Any action taken by you on the basis of the information contained herein is your responsibility alone and Choice Broking its subsidiaries or its employees or associates will not be liable in any manner for the consequences of such action taken by you. We have exercised due diligence in checking the correctness and authenticity of the information contained in this recommendation, but Choice Broking or any of its subsidiaries or associates or employees shall not be in any way responsible for any loss or damage that may arise to any person from any inadvertent error in the information contained in this recommendation or any action taken on basis of this information. Technical analysis studies market psychology, price patterns and volume levels. It is used to forecast future price and market movements. Technical analysis is complementary to fundamental analysis and news sources. The recommendations issued herewith might be contrary to recommendations issued by Choice Broking in the company research undertaken as the recommendations stated in this report is derived purely from technical analysis. Choice Broking has based this document on information obtained from sources it believes to be reliable but which it has not independently verified; Choice Broking makes no guarantee, representation or warranty and accepts no responsibility or liability as to its accuracy or completeness. The opinions contained within the report are based upon publicly available information at the time of publication and are subject to change without notice. The information and any disclosures provided herein are in summary form and have been prepared for informational purposes. The recommendations and suggested price levels are intended purely for trading purposes. The recommendations are valid for the day of the report however trading trends and volumes might vary substantially on an intraday basis and the recommendations may be subject to change. The information and any disclosures provided herein may be considered confidential. Any use, distribution, modification, copying, forwarding or disclosure by any person is strictly prohibited. The information and any disclosures provided herein do not constitute a solicitation or offer to purchase or sell any security or other financial product or instrument. The current performance may be unaudited. Past performance does not guarantee future returns. There can be no assurance that investments will achieve any targeted rates of return, and there is no guarantee against the loss of your entire investment. POTENTIAL CONFLICT OF INTEREST DISCLOSURE (as on date of report) Disclosure of interest statement – • Analyst interest of the stock /Instrument(s): - No. • Firm interest of the stock / Instrument (s): - No. Disclaimer Contact Us Amit Pathania Research Associate amit.pathania@choiceindia.com Rohan Patil Research Associate rohan.patil@choiceindia.com www.choiceindia.comcustomercare@choiceindia.com SEBI Registered - Research Analyst Equities I Commodities I Currencies I Mutual Funds Aaj Ka Trend 09th June’16 Neeraj Yadav Research Advisor neeraj.yadav@choiceindia.com Anish Vyas Senior Research Associate anish.vyas@choiceindia.com Amit Pathania Digitally signed by Amit Pathania DN: cn=Amit Pathania, o=Choice Equity Broking Pvt. ltd, ou=Research Department, email=amit.pathania@choiceindia.com, c=IN Date: 2016.06.09 08:57:29 +05'30'