A travel behaviour change framework for the city of Cape Town.pdf
•
0 likes•2 views

Assignment Writing Service http://StudyHub.vip/A-Travel-Behaviour-Change-Framework-For

Recommended
Recommended
More Related Content
Similar to A travel behaviour change framework for the city of Cape Town.pdf
Similar to A travel behaviour change framework for the city of Cape Town.pdf (20)
More from Samantha Martinez
More from Samantha Martinez (20)
Recently uploaded
Recently uploaded (20)
A travel behaviour change framework for the city of Cape Town.pdf
- 1. A TRAVEL BEHAVIOUR CHANGE FRAMEWORK FOR THE CITY OF CAPE TOWN R Behrens, E Adjei, N Covary*, R Jobanputra*, B Wasswa and M Zuidgeest Centre for Transport Studies, University of Cape Town, Private Bag X3, Rondebosch 7701; Email: roger.behrens@uct.ac.za, eric.adjei@uct.ac.za, WSSBAN001@myuct.ac.za, mark.zuidgeest@uct.ac.za * Transport for Cape Town, City of Cape Town, PO Box X9181, Cape Town, 8000; Email: niki.covary@capetown.gov.za ABSTRACT Rapid increase in car ownership, and associated externalities, have motivated Transport for Cape Town (TCT) to develop strategies to curb growth in car use, particularly growth in Single Occupancy Vehicles (SOVs) in and out of the city centre. This paper reports upon the results of a project which sought to develop a framework to guide TCT’s Travel Demand Management (TDM) strategy, based upon a review of theory and a meta-analysis of empirical evidence. This framework includes a TDM strategy scenario in which a set of phased interventions seek to reduce the share of weekday SOV traffic into the city centre by 10% after five years. It is argued, from a theoretical perspective, that the keys to effective TDM intervention include: identifying which trip decision elements should be targeted in the short and long term; recognising which TDM measures are likely to have the greatest impact upon these decision elements; understanding which groups are most susceptible to change so that TDM measures might be targeted strategically; understanding the triggers which lead individuals to deliberately reappraise their travel decisions; influencing the variables that create the necessary circumstances that prompt decisions leading to the desired pattern of ‘asymmetry’; and ‘locking in’ the vehicle kilometres travelled and other benefits, when they accrue. On the basis of the meta-analysis of secondary data, it is contended that financial charging can be expected to register the highest reduction in SOV mode use share, at around 15% at a precinct scale, followed by financial incentives, regulatory and voluntary measures at around 5%, 3% and 2% respectively. It is suggested that with the correct packaging, sequencing, targeting and resourcing, a 10% reduction in the SOV mode share of traffic travelling in and out of the city centre could be achieved. 1. INTRODUCTION Cape Town is experiencing absolute increases in car ownership and use. The number of registered light passenger vehicles increased at an annual rate of 3.5% between 2001 and 2013, which is almost one percentage point higher than the 2.6% population growth rate between the 2001 and 2011 censuses. Given the peak and commuter focus of prior travel behaviour analysis in the city, motorised trips to work provide the best indication of citywide car use trends. Over the past 15 years, car mode share for motorised work trips has remained fairly stable in relative terms, ranging between 45% and 50% in the seven surveys undertaken during this period. 412 ISBN Number: 978-1-920017-63-7 Proceedings of the 34th Southern African Transport Conference (SATC 2015)
- 2. The car use share for all trip purposes by motorised modes, however – estimated to be 57% in 2010 (n=2,002h) and 49% in 2013 (n=5,270p) by the two most recent travel surveys – falls short of the 50:50 private:public transport mode share goal for 2010 set in the 2009 Integrated Transport Plan (ITP) (CCT 2009) and the 40:60 private:public transport mode share goal for 2014 set in the 2013 ITP (TCT 2013a), respectively. Car occupancy in the city tends to be low. A 2011 survey (n=3,635p) of seven large corporates in the Central Business District (CBD) found that single occupancy vehicles (SOVs) accounted for 79% of employee private car use (which in turn accounted for 59% of the modal split) (TCT 2013b). An imbalance between growth in traffic and road supply has caused congestion levels to deteriorate in the peak periods of working days, especially on inbound and outbound CBD routes (TCT 2013c). In response to these dynamics, and to support a transition towards a low-carbon city, Transport for Cape Town (TCT) is developing strategies to curb growth in car use, particularly SOVs. Part of TCT’s strategy is to provide modal alternatives for car users, most notably through its MyCiTi bus rapid transit network. Such supply-side measures are likely to be more effective if combined with demand-side measures geared towards changing people’s trip-making decisions. For Travel Demand Management (TDM) strategies to be effective at a precinct or citywide scale, however, component TDM measures need to be strategically packaged, sequenced and targeted, rather than selected discretely. The aim of this paper is to report upon the findings of a study commissioned by TCT in 2014, as part of its Travel SMART programme, to develop a theoretical framework to guide TDM strategy refinement, based upon a review of behaviour change theory and a meta-analysis of empirical evidence (Adjei et al 2014). The paper investigates the following questions: (1) what candidate TDM measures might TCT include in its TDM strategy, and what have been their observed impacts?; and (2) how might theories of behaviour change and the evidence base of observed impacts be synthesised into an overarching theoretical framework to guide the packaging, sequencing and targeting of TDM measures in the city? The paper is divided into five main sections. The following section categorises TDM measures, and reviews empirical evidence of their impacts. Section 3 presents the theoretical framework developed. Section 4 illustrates the application of the theoretical framework to the development of a strategy scenario for the Cape Town CBD. Section 5 concludes with a synthesis and recommendations. 413
- 3. 2. AN OVERVIEW OF TRAVEL DEMAND MANAGEMENT MEASURES The findings of a review of candidate TDM measures are reported in terms of: a categorisation of individual measures; and a synthesis of the evidence base for the impacts of these measures resulting from a meta-analysis of international secondary data. 2.1 Categorisation and trip decision element linkages TDM measures were grouped into four categories, and linked to the elements of a trip decision that they are intended to change, defined as: trip generation; trip origin, trip timing, mode use, vehicle occupancy (if a private mode); route (if a private mode); and trip destination. The categories of measures included: voluntary measures, which seek to change travel behaviour without the use of regulatory force or price manipulation; regulatory measures; which introduce regulation and enforcement to compel change in behaviour; financial incentives, which distribute monetary rewards for specified behaviours; and financial charges, which introduce a monetary charge for, or adjust the price of, using cars in particular ways (see appendix A). 2.2 Empirical evidence of travel demand management impacts The international evidence base of TDM impacts was assembled in a database. Secondary data were derived from four main sources: the Transportation Research Board’s Traveler response to transportation system changes handbook (TRB 2014); the United Kingdom Department for Transport’s Smarter choices: Changing the way we travel (Anable et al 2004, Cairns et al 2004); Transport Canada’s Transportation demand management database (TC 2014); and the Victoria Transport Policy Institute’s Online TDM encyclopaedia (VTPI 2014). To qualify for inclusion in the database, a case report needed to specify: the metric used to measure change (i.e. mode share, vehicle counts, vehicle trips, public transport ridership or public transport trips); the duration between before and after measurement; and the geographical scale at which change was observed (i.e. a company or precinct scale). This information enabled consistent and standardised comparisons of mean annual percentage change. While the key data sources reported a substantial number of cases, many did not present all the information required for standardised comparison, and were therefore excluded from the database. The final database included 64 cases: 33 relating to measures implemented on their own; and 31 relating to measures implemented in combination. Descriptive statistics were used to show the sign, magnitude and spread of the annual impact of each individual measure, or combination of measures, on, inter alia, reducing SOV car use and increasing public transport ridership. Particular attention was paid to analysing impacts at a precinct (as opposed to company) scale. Given that TDM measures can be implemented with or without support (e.g. improved public transport service or pedestrian-friendly land development), it was expected that there would be considerable variance in reported impacts. In order to reflect this variability, box-and-whisker plots were selected to display the descriptive statistics. 414
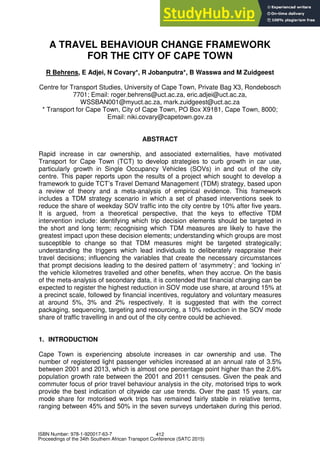
- 4. Figure 1. Synthesis of precinct level TDM category impacts On the basis of the meta-analysis conducted, notwithstanding the small number of cases in some comparisons and inconsistencies resulting from averaging annual change over varying time periods, it was concluded that financial charging can be expected to register the highest reduction in SOV mode use share, at around 15% on average at a precinct scale, followed by financial incentives, regulatory and voluntary measures at around 5%, 3% and 2% respectively (see figure 1). 3. A THEORETICAL FRAMEWORK FOR FORMULATING TRAVEL DEMAND MANAGEMENT STRATEGIES The theoretical framework to guide the packaging, sequencing and targeting of TDM measures is developed through: a set of propositions concerning how individuals change their travel behaviour, and how these individual changes interact with each other and affect aggregate patterns of change; and a discussion on the implications these intra- and inter-personal behaviour change dynamics have for the formulation, implementation and monitoring of effective TDM strategies in Cape Town. 3.1 Intra-personal dynamics of behaviour change The starting position of the theoretical framework is that individuals do not deliberately reappraise all aspects of their travel decisions on an almost trip-by-trip basis, as implicitly assumed in the mode choice step of the conventional four-step model. It is posited that if a travel choice has proven in past experiences to be of benefit, or at least satisfactory to the trip-maker, that travel choice becomes habitual (Gärling and Axhausen 2003). This conversion from deliberate decision-making to habit has been described as a transition from ‘preference-based’ to ‘script-based’ choices (Fujii and Gärling 2003). Travel habits are argued to be broken typically when some form of ‘life shock’ event (e.g. moving house, changing jobs, children starting school, etc.) or ‘critical incident’ implementation difficulty (weighted qualitative index of human resource requirements, financial cost, public acceptability and political will) 0% ~ 15% percentage change in precinct level car use voluntary measures regulatory measures financial incentive measures financial charging measures expensive, unpopular, resource intensive inexpensive, popular, less resource intensive measures more effective if accompanying the launch of new/improved PT services and/or NMT infrastructure (and proactive travel planning) 2.00 4.00 415
- 5. (e.g. car crash, mugging, sharp increase in fuel costs, etc.) occurs which forces a reappraisal of the habit and leads to another ‘preference-based’, potentially habit- forming, decision. A qualitative (n=70 commuter) mobility biography study in Cape Town – in which lower middle-income commuters were asked to recall when and why they changed travel mode over their work career – found that changes in employment, residence and car ownership were the most common triggers of mode switching decisions (Adjei and Behrens 2013). It is postulated that, when considering change, individuals will first experiment with behaviour changes that require the least planning effort and cost to implement (e.g. changing departure time, route, or destination in the case of discretionary trips), and that if these prove unsatisfactory, only then will they implement behaviour changes that require greater planning effort and cost (e.g. changing travel mode). This conceptualisation of travel behaviour change as habits broken by shocks provides a more robust basis upon which to analyse behavioural response lags to TDM strategies than conventional cross-sectional rational choice analysis, and, at least theoretically, provides an explanation for why – as found, for instance, by Fearnley and Bekken (2005) in a review of studies of demand elasticities in the short- and long-term, and by Goodwin (1996) in a review of before-and-after studies of road capacity increases – longer term effects of transport system changes are in the region of one and a half to three times the effects within one year of the change. Somewhat paradoxically with respect to observations of habitual behaviour, individuals have also been observed to exhibit considerable variability in their travel behaviour (see, for instance, Hanson and Huff 1988, Pas and Sundar 1995). These studies have found considerable ‘intra-personal’ variability in trip decision elements like frequency and chaining. A reconciliation of the apparent contradiction between observations of intra-personal habit and intra-personal variability requires a differentiation of trip decision elements occurring within a ‘travel mode domain’ and requiring less effort to change (i.e. trip frequency/generation, trip timing, route, vehicle occupancy), from trip decision elements occurring across travel mode domains and requiring more effort to change (i.e. trip origin, trip destination, mode use). It is posited that changes within a travel mode domain that require less effort to implement occur more frequently, and changes across travel mode domains that require more effort to implement occur less often. The former accounts for observed variability, while the latter accounts for observed habit. In other words, a commuter might vary trip generation, timing, route or service choice behaviour considerably in the short term, but remain a habitual car, public transport or non-motorised transport user over the long term. 3.2 Inter-personal dynamics of behaviour change Multiple individual patterns of short-term variability and long-term habit-breaking across a city population produce the aggregate utilisation patterns we observe on our road and public transport networks. Traffic streams and passenger ridership are in a constant state of change, and the notion of behavioural equilibrium – underpinning many past approaches to travel behaviour analysis and estimation – is therefore problematic. 416
- 6. Studies of the composition of morning peak period traffic streams in Cape Town (Del Mistro and Behrens 2008, Hermant and Bester 2008) and elsewhere (Bonsall et al 1984, Cherrett and McDonald 2002), for instance, point to an alternative to the conventional assumption that behavioural change occurs until some form of equilibrium is reached. The studies found that, while the traffic stream as a whole exhibits similar characteristics over time (in terms of volume, density and speed), the individual vehicles which make up the traffic stream are steadily changing. Similar observations have been made in park-and-ride facilities in Cape Town (Van Rensburg and Behrens 2011). The term ‘churn’ has been used to describe this phenomenon (Chatterjee 2001, Saleh and Farrell 2007). A system that appears stable in aggregate form, is in fact the result of individuals making reciprocal changes in their travel behaviour. a. Churn b. Asymmetric churn Note: 1. For simplification, train, bus and minibus-taxi services are considered to be one public transport travel mode domain. Figure 2. Diagrammatic representation of conceptualised inter-personal ‘churn’ and 'asymmetric churn' In figure 2(a) a pattern of ‘churn’ can be observed in mode use: at time 0 two commuters used each of the three travel modes; and at time 6, despite numerous intra-personal mode use changes, each of the three travel mode domains still had two commuters. Aggregate or system-wide change is the result of asymmetry in ‘churning’ individual decisions – labelled by Goodwin (1999) as ‘asymmetric churn’. In contrast to figure 2(a), figure 2(b) presents an asymmetric pattern of mode use churn: at time 0 two commuters used each of the three travel modes; whereas at time 6, four commuters used the car mode and the other two mode domains had only one commuter each. It is argued that the concept of ‘asymmetric churn’ offers a more useful conceptual framework within which to formulate TDM strategies, than the conventional notion of incremental behavioural adaptation until some form of equilibrium end-state is achieved. In other words, if a desired TDM strategy outcome is an increase in public transport share of modal split at the expense of the car, then for every one person units of effort time 0 1 2 3 4 5 6 private car mode domain NMT mode domain public transport mode domain ‘shock’ or ‘incident’ 0 1 2 3 4 5 6 417
- 7. switching to a car from public transport use, more than one person would need to switch to public transport from car use. Our growing understanding of ‘habitual’ travel and ‘shocked’ change tells us that these changes are happening anyway. Rational choice theory suggests that when choosing between trip element alternatives, while not necessarily the only factors taken into account, time and cost benefits are dominant considerations. Thus with respect specifically to mode choices, net change (or ‘asymmetrical churn’) in mode use is likely to occur when the relative generalised cost of mode alternatives change. In congested road networks, the implementation of voluntary and incentive TDM measures, that lead to significant switching from SOV car use to public transport or NMT use, can relieve congestion on general traffic lanes, and thereby reduce the generalised cost of SOV car use for the remaining users by decreasing travel times. Therefore, TDM measures that relieve heavily congested road networks can have the unintended consequence of ‘inducing’ new SOV car traffic: over time resulting in the erosion of congestion reduction benefits. 3.3 Implications for Cape Town International experience of TDM implementation indicates that voluntary and incentive measures that persuade and financially incentivise behaviour change are easier to implement than the more politically-contentious and resource-intensive regulatory and charging measures (see figure 1). Studies of public acceptability elsewhere suggest that in Cape Town heavy regulatory and charging measures, that restrain and penalise SOV car use, are unlikely to be readily accepted by large sections of the city’s population unless they are accompanied by clear commitments to hypothecation (i.e. the ring-fencing of revenues for investments into transport system improvements) and the provision of public transport and NMT alternatives that are broadly acceptable to choice passengers (see, for instance, Jones 2003, Jaensirisak et al 2005, Gaunt et al 2007, Schuitema et al 2010). In other words, there should be ‘no sticks without carrots’. Thus in the shorter term – as institutional and financial blockages to large-scale improvement of the citywide public transport network are mitigated, and as the South African public’s opposition to road use tolling (as demonstrated in the Gauteng city region) remains reasonably strong – the prospects of implementing voluntary and incentive measures in Cape Town are stronger than those of regulatory and charging measures. It is therefore anticipated that this is where the TCT will concentrate its TDM strategy and resources in the next five or so years. Given the habitual nature of travel behaviour discussed earlier, and the relationship between infrequent ‘shocks’ and behaviour change, it should be noted that – in the absence of interventions that universally and abruptly change the generalised cost of SOV car travel over the longer term (e.g. London’s congestion charging and Singapore’s electronic road pricing schemes) – behavioural responses to voluntary and incentive TDM measures in Cape Town are likely to occur slowly, at a pace determined by ‘churning’ changes that are occurring anyway. It follows then that the timeframes for TDM strategy monitoring and assessment, and subsequent updating and revision, should not be premature. If these timeframes are too short (i.e. 1-2 years after implementation), assessments of failure and subsequent abandonment may be wrong. 418
- 8. The relationship between ‘shock’ and behaviour change further implies that greatest impacts from TDM strategies are likely to be derived from targeting particular trip- maker groups who are most susceptible to ‘shocks’, and the associated forcing of deliberate ‘preference-based’ decision-making. Given the findings of past retrospective commuter surveys (Adjei and Behrens 2014, Behrens et al 2007), such categories of trip-makers in Cape Town would include, for example, new employees, new home owners and first-time car owners. Once the triggers that lead to deliberate reappraisal of travel decisions are identified, it is necessary for the TDM strategy to influence the variables that create the necessary conditions that prompt decisions leading to the desired pattern of asymmetry. In addition to rational choice theory (Simon 1955), the theories of planned behaviour and interpersonal behaviour provide a theoretical basis for understanding what these variables are (Ajzen 1985, Triandis 1977), while the theories of cognitive dissonance and prospect provide insight into how trip-makers might be more strongly influenced (Festinger 1957, Kahneman and Tversky 1979). A particularly important target group, given current commitments to upgrade the public transport system in Cape Town, will be households living in neighbourhoods benefiting from recently launched or improved public transport services. When ‘choice’ trip-makers are persistently dissatisfied with their travel experience, but have little or no alternatives, the addition of a new or improved travel mode domain can have the effect of triggering a large switch in behaviour in a short period of time. The theories of self-perception and goal setting provide insight into how desirable behaviour change amongst this target group might be maximised (Bem 1967, Latham and Locke 1991). International experience suggests that corporate, school and household travel planning practices, in which city authorities facilitate the preparation of workplace, school and home travel plans, present potentially effective ways for the TCT to target groups and package TDM measures (see, for instance, Rye 2002, Cairns et al 2004, Enoch 2012). This would require institutional resourcing. Given the churning nature of inter-personal behaviour patterns, and the potential for new SOV car users to fill the road space left by mode switchers, it should be noted that while voluntary and incentive TDM measures might yield impressive results at a site or company level, they are unlikely to yield observable net effects at an aggregate level (e.g. through the CBD cordon count). In order to avoid inducing new SOV car use, the VKT reduction benefits arising from TDM measures need to be ‘locked in’. This can be achieved by maintaining or increasing the generalised cost of SOV driving and parking through either reallocating road space to another mode or modes, by halting expansion of the capacity of general traffic lanes in the face of growing traffic volumes, or by levying charges directly at SOV car users. As noted earlier, the latter may be more difficult to implement. The simultaneous implementation in parts of the city of a TDM strategy to encourage switching from car use to public transport use, and the construction of additional general traffic lane capacity, would most likely be counterproductive. If, as anticipated earlier, voluntary and incentive TDM measures are indeed the first measures to be introduced at scale due to their relative ease of implementation, 419
- 9. congestion relief should not be identified as an objective of these projects. Objectives should rather be reduced VKT, and increased public transport ridership and NMT use. Congestion reduction objectives should only be attached to regulatory and charging TDM measures which provide the necessary universal change in relative generalised cost that prevents new SOV car travel from being induced. Given their relatively greater implementation difficulty, these measures are more likely to emerge in the longer term, linked perhaps to the outcomes of current efforts by the TCT and PRASA to upgrade the quality of the city’s public transport services. 4. AN ILLUSTRATIVE TRAVEL DEMAND MANAGEMENT SCENARIO FOR CAPE TOWN’S CENTRAL BUSINESS DISTRICT To illustrate how the theoretical framework might be applied in practice, a hypothetical scenario was developed. The scenario suggests how it might be possible to achieve a set of objectives specified in the study’s terms of reference, without attempting to calculate effects quantitatively or claim statistical confidence. The narrative writing style used to describe the scenario should not be interpreted to imply that the set of interventions identified have been formally proposed by TCT officials, or approved by the municipality for implementation. It has a purely exploratory and illustrative purpose. The scenario is described in terms of: the scenario-building method; the desired TDM strategy objective; and a hypothetical narrative of interventions and their impact. Figure 3. Workshop scenario-building method Scenario goal Scenario objective TDM measures Packaging and sequencing Impact estimation Consensus building Plenary discussion Group Discussion What is the TDM goal? How should the TDM goal be defined as a measurable target? What TDM measures could be implemented to achieve the target? How should these measures be packaged and sequenced? What does experience elsewhere suggest might be the impact of these measures? Do the groups agree on measure selection, packaging, sequencing and possible impact? No Yes 420
- 10. 4.1 Scenario-building method The method developed to create the scenario was a workshop in which two groups of TCT officials and UCT researchers iteratively sought consensus on how an objective might realistically be achieved by a combination and sequence of TDM measures. Figure 3 illustrates the workshop method. In this method, if the individual groups produced broadly consistent scenarios the process would end, and if the individual groups produced very different scenarios the cycle would be repeated until consensus was reached (by either adjusting the measurable target, or by groups amending their scenarios to take account of discussion and criticism from the earlier round). a. Mode share of weekday inbound passenger trips (2012) b. Main mode share of corporate employee work trips (n=3,635 employees, 2011) c. 2015 baseline estimation of inbound weekday SOV car mode share d. 2019 target year inbound weekday SOV car mode share Notes: 1. Baseline SOV car use mode share was estimated by applying the relative proportions of single occupant and ≥2 occupant car use found in the survey of corporate employees in 2011. These proportions (78.7 and 21.3% respectively) were applied to the total light vehicle drivers and passengers observed in the 2012 inbound cordon survey (227,436 persons). car 56% metered taxi 1% train 18% bus 10% minibus-taxi 12% NMT 3% SOV 44% SOV company car 3% lift clubs 12% lift club company car 1% train 22% bus 12% minibus-taxi 4% walk 1% bicycle 0% motorcycle 1% SOV car 45% ≥2 car 12% train 18% bus 10% minibus-taxi 12% NMT 3% SOV car 41% ≥2 car 13% other modes 46% 421
- 11. 2. The inbound cordon survey data between 2001 (384,362 persons) and 2012 (403,541 persons) were used to estimate an assumed annual increase in persons entering the CBD (0.44%). This annual growth rate was applied to estimate total daily persons entering the CBD in 2015 (408,936 persons) and 2019 (416,243 persons). 3. A 10% reduction in SOV car mode share, in 2012 values, represents a reduction on 16,455 persons travelling by this mode (181,002 less 164,547). This reduction of SOV car users was reassigned to other modes. Figure 4. Weekday passenger trip mode share into the Cape Town central business district (percentage) 4.2 Scenario objective The measurable target of the TDM strategy scenario objective was agreed to be a 10% reduction in average weekday CBD inbound SOV car mode share after five years of strategy implementation. The most recent weekday CBD inbound SOV car mode share data were collected in 2012 (see figure 4[a]). It was found in 2012 that light vehicles and metered taxis held a 56% and 1% share of modal split respectively. Using the survey of corporate employees in the previous year (see figure 4[b]), it was estimated that 79% of the light vehicles observed in 2012 were SOV cars. Thus it was estimated that SOV cars held a 45% share of inbound weekday modal split in 2012 (see figure 4[c]). It was assumed that the implementation of the TDM strategy will begin in 2015, and that the target year is 2019. The inbound cordon survey data between 2001 and 2012 were used to estimate an assumed annual increase in persons entering the CBD (of 0.44%). This annual growth rate was applied to 2012 data to estimate that the total number of daily persons entering the CBD will be ±409,000 in 2015, and that the baseline number of daily SOV car users will be ±183,000. This annual growth rate was also applied to estimate that the total daily persons entering the CBD will be ±416,000 persons in 2019. A 10% reduction in SOV car mode share would imply reducing the mode share of 45% in 2015, to 41% in 2019 (see figure 4[d]), and reducing the amount of SOV car users from ±183,000 in 2015 to ±170,000 in 2019. Given that net modal split changes are the result of ongoing asymmetrical churn in travel behaviours, as discussed earlier, a net reduction of around 14,000 SOV car users will therefore be needed over the five year period. 4.3 Scenario narrative In the short term (2015-2016), the following measures are implemented in the scenario: carpooling (including ride-matching, guaranteed ride home and preferential parking); flexible work scheduling (including flexitime, compressed work weeks and telecommuting); all mode transport salary benefits; and parking cash-outs. These measures are packaged together as part of a corporate travel planning programme initiated by the TCT. New positions in the TCT are established in order to dedicate resources to preparing corporate travel planning guides, soliciting companies in the CBD to participate in the programme, and providing technical planning support to these companies. An important component of this technical planning support is the establishment of a ride-matching website that facilitates filtered and screened 422
- 12. searches and pairing. The site is used by large corporates, as well as by the general public. The company travel plans produced through the corporate travel planning programme include a mix of voluntary measures aimed at encouraging SOV car use reduction and peak spreading (in the form of carpooling and a flexible working programme) and at taking advantage of rapidly diffusing information technologies, and financial incentives (in the form of all mode transport salary benefits that replace company car allowances, and parking cash-outs that replace company parking benefits). The corporate travel planning programme targets commuters who are most susceptible to deliberate decision-making with respect to travel choices, and therefore to SOV car use habit-breaking. Thus companies which have moved to the CBD, and new employees of companies already located in the CBD, are targeted. The targeted companies and employees receive information on how to initiate carpools and on what public transport services are on offer, and receive feedback on the benefits of SOV car use reduction and on how this aligns to good citizenship. In line with the dynamics of intra-personal travel behaviour change discussed earlier, greatest initial changes occur within ‘travel mode domains’. The largest net changes in behaviour in the short term are therefore in relation to departure time, vehicle occupancy and trip substitution. In the medium term (2017-2019), these measures are complemented by a further set of measures, aimed largely at accelerating mode switching, and at ‘locking in’ the benefits of the voluntary SOV car use reduction that resulted in the short term: setting parking maximums; variable parking pricing; and municipal rates reductions for ‘green travel plans’, leading to discounted public transport fares. These measures are sequenced to ensure that the generalised costs of travelling by SOV car are not reduced as a result of a reduction of SOV car mode share. The cost of travelling by SOV car is maintained by preventing significant growth in parking supply (through the determined implementation of controversial parking maximums and precinct caps) and by increasing the cost of on-street parking (through variable parking pricing). Variable parking pricing is adjusted periodically, depending upon whether specified parking space availability criteria have been met in the preceding period. The corporate travel planning scheme is extended to provide additional financial incentives to switch from SOV car use. The City of Cape Town recognises the benefits of the TDM strategy for reduced municipal expenditure on infrastructure and services provision, and therefore offers companies, that attain specified SOV car use levels, abatements on their municipal rates. These savings are used by companies to discount employee public transport fares during specified periods (specifically targeting the off-peak and the shoulders of the morning and afternoon peak periods so that additional public transport ridership resulting from mode switching is distributed to periods where additional capacity can be created without incurring significant additional service provision costs). Throughout the five year period the convenience, comfort and safety of public transport services are steadily improved, and a net incline in the fluctuating oil price enhances their cost advantages relative to SOV car use. In exchange for a commitment to pursue a set of agreed SOV car use reduction goals, beneficiaries receive a free public transport pass for a two week period in 423
- 13. order to correct misperceptions of the quality of public transport service, and thereafter receive discounted fares during the peak shoulders and off peak in order to sustain the incentive to form a new public transport use habit. In line with the dynamics of intra-personal travel behaviour change discussed earlier, in the medium term period greater changes are observed to occur across ‘travel mode domains’, and observed net changes in behaviour therefore extend to mode switching. Throughout the five year period, the benefits of SOV car use reduction is also indirectly ‘locked in’ by adherence to a policy of limiting major improvements to road capacity for cars. Expanded pedestrianisation of streets in the city core, and road space reallocation to extend the network of bicycle lanes in support of the launch of a bike share scheme, provides further car use restriction in the CBD. Given the scale of TDM impacts observed elsewhere, it is possible that the measures discussed above could meet the target of reducing average weekday CBD inbound SOV car mode share by 10%. At a company level, parking cash-outs, for instance, might be expected to achieve a ±4% reduction in SOV use, and discounted public transport fares a ±15% increase in ridership. Combined packages of voluntary TDM measures might be expected to achieve a ±10% reduction in SOV car use, and up to a ±40% increase in public transport use (depending on the baseline). If a sufficient number of companies in the CBD participate in the corporate travel planning programme, and no additional SOV car traffic is induced by TDM success, these company effects might lead to observable changes at the precinct level. Figure 5 posits where, in a hypothesised set of behavioural responses, the TDM strategy scenario might sit. Figure 5. Hypothetical TDM strategy scenario effectiveness TDM strategy scenario a combination of voluntary, incentive, regulatory and charging measures, incorporated into a proactive travel planning programme, and supported by steady improvements in the quality of public transport services implementation difficulty (weighted qualitative index of human resource requirements, financial cost, public acceptability and political will) voluntary measures regulatory measures financial incentive measures financial charging measures expensive, unpopular, resource intensive inexpensive, popular, less resource intensive measures more effective if accompanying the launch of new/improved PT services and/or NMT infrastructure (and proactive travel planning) 2.00 4.00 0% ± -15% percentage change in inbound CBD SOV car mode share after 5 years 424
- 14. In this scenario the net decrease of ±14,000 SOV car users (representing a decrease of 4.1 percentage points in SOV car mode share) is reassigned to net increases in other modes in the following manner: 4,000 (30%) to ≥2 car (representing an increase of 1.2 percentage points in mode share); 5,500 (40%) to train (representing an increase of 1.6 percentage points in mode share); 3,000 (20%) to bus (representing an increase of 0.8 percentage points in mode share); and 1,500 (10%) to non-motorised modes (representing an increase of 1.2 percentage points in mode share). Figure 6. 2019 target year weekday passenger trip mode share into the Cape Town central business district (percentage) Figure 6 presents the adjusted modal split in the target year based on the scenario. The decrease in SOV car mode share is largely the result of greater parking costs (resulting from increased charges and limited supply), and flexible work scheduling (leading to lower SOV car trip generation). The increase in ≥2 car mode share is largely the result of carpooling, and associated ride-matching services, guaranteed ride home and preferential parking for registered car pool vehicles. The increase in train and bus mode shares is largely the result of discounted public transport fares and the gradually increased attractiveness of public transport quality of service. The increased NMT mode share is largely the result of increased housing provision in the city bowl, and a growing culture of bicycle use in the city centre. 5. CONCLUSION In the theoretical framework presented in this paper it was argued that effective TDM intervention will require: • identifying which trip decision elements should be targeted in the short and long term; • recognising which TDM measures are likely to have the greatest impact upon these decision elements; • understanding the triggers which lead individuals to deliberately reappraise their travel decisions; • understanding which groups are most susceptible to change so that TDM measures might be targeted strategically; SOV car 41% ≥2 car 13% train 20% bus 11% minibus-taxi 12% NMT 3% 425
- 15. • influencing the variables that create the necessary circumstances that prompt decisions leading to the desired pattern of asymmetry; and • ‘locking in’ the VKT reduction and other benefits, when they accrue. This packaging, sequencing and targeting of measures was applied in the TDM strategy scenario for the Cape Town CBD in the following way: • in the short term, trip timing, vehicle occupancy and trip substitution decisions are targeted, and, in the medium term, these decision elements are expanded to include mode use; • flexitime, staggered working hours, compressed work weeks and telecommuting (comprising a flexible working programme) are the TDM measures targeted at trip timing and substitution decisions, carpooling is the measure targeted at vehicle occupancy, and public transport use incentives and parking charges and supply restrictions are the measures targeted at mode use decisions; • CBD commuters who have recently experienced a ‘life shock’ are identified as most susceptible to change, thus, while the employees of all companies participating in the corporate travel planning programme are included, the programme’s information and incentives are targeted strategically at new employees of companies in the CBD and companies starting or relocating to the CBD; • the relative time, cost and safety of alternative modes are identified as important factors in decision making, so public transport use incentives, parking charges and supply restrictions are implemented to adjust the relative generalised costs of mode alternatives in favour of higher occupancy modes; and • TDM benefits are ‘locked in’ by either maintaining or increasing the generalised cost of SOV car travel, through avoiding major road capacity improvements, increasing parking costs and road space reallocation in the city centre. The context and population of Cape Town are unique. As TCT and collaborating companies embark upon the implementation of TDM measures it will be important to systematically monitor their impact through before-and-after studies. The transferability limitations of the evidence-base reviewed in this study dictate that TDM strategy implementation be heuristic in nature. TCT should therefore pilot and monitor TDM interventions before implementing at scale. 426
- 16. REFERENCES Adjei E and Behrens R, 2013: The dynamics of mode-switching: findings from a mobility biography study in Cape Town, 13th World Conference on Transport Research. Rio de Janeiro. Adjei E, Behrens R, Wasswa B and Zuidgeest M, 2014: A travel behaviour change framework for the City of Cape Town, Report commissioned by Transport for Cape Town, City of Cape Town, Cape Town. Ajzen I, 1985: From Intentions to actions: A theory of planned behaviour, in Kuhl J and Beckmann J (eds), Action control: From cognition to behaviour, Springer-Verlag. New York. Anable J, Kirkbride A, Sloman L, Newson C, Cairns S and Goodwin P, 2004: Smarter choices: Changing the way we travel, Volume 2, Department for Transport, London. (http://eprints.ucl.ac.uk/1233/1/2004_11.pdf) Behrens R, Del Mistro R, Lombard M and Venter C, 2007: The pace of behaviour change and implications for TDM response lags and monitoring: Findings of a retrospective commuter travel survey in Cape Town, 26th Southern African Transport Conference, Pretoria. Bem D, 1967: Self-perception: The dependent variable of human performance, Organizational Behavior and Human Performance, Vol 2, pp105-200. Bonsall P, Montgomery F and Jones C, 1984: Deriving the constancy of traffic flow composition from vehicle registration data, Traffic Engineering and Control, Vol 25, pp10-19. Cairns S, Sloman L, Newson C, Anable J, Kirkbride A and Goodwin P, 2004: Smarter choices: Changing the way we travel, Department for Transport, London. (http://discovery.ucl.ac.uk/1224/1/1224.pdf) Chatterjee K, 2001: Asymmetric churn - academic jargon or a serious issue for transport planning?, Transport Planning Society Bursary Paper, London. Cherrett T and McDonald M, 2002: Traffic composition during the morning peak period: Implications for urban traffic management systems, European Journal of Transport and Infrastructure Research, Vol 2, No 1, pp41-55. CCT, 2009: Integrated transport plan for the City of Cape Town: 2006 to 2011, City of Cape Town, Cape Town. Del Mistro R and Behrens R, 2008: How variable is the variability in traffic? How can TDM succeed?, 27th Southern African Transport Conference, Pretoria. Enoch M, 2012: Sustainable transport, mobility management and travel plans, Ashgate, Farnham. 427
- 17. Fearnley N and Bekken J, 2005: Short-and long-run demand effects in transport: A literature survey, Institute of Transport Economics, Oslo. Festinger L, 1957: Belief, attitude, intention, and behavior: An introduction to theory and research, Addison-Wesley, Reading. Fujii S and Gärling T, 2003: Development of script-based travel mode choice after forced change, Transportation Research Part F: Traffic Psychology and Behaviour, Vol 6, No 2, pp117-124. Gärling T and Axhausen K, 2003: Introduction: Habitual travel choice, Transportation, Vol 30, No 1, pp1-11. Gaunt M, Rye T and Allen S, 2007: Public Acceptability of road user charging: The case of Edinburgh and the 2005 referendum, Transport Reviews, Vol 27, No 1, pp85-102. Goodwin P, 1996: Empirical evidence on induced traffic, Transportation, Vol 23, No 1, pp35-54. Goodwin P, 1999: Action or inertia? One year on from ‘A New Deal for Transport’. Transport Planning Society, London. Hanson S and Huff O, 1988: Systematic variability in repetitious travel, Transportation, Vol 15, No 1, pp111-135. Hermant L and Bester C, 2008: morning peak period travel characteristics of a residential suburb in Cape Town during a school and holiday period: What lessons can we learn? 27th Southern African Transport Conference. Pretoria. Jaensirisak S, Wardman M and May A, 2005: Explaining variations in public acceptability of road pricing schemes, Journal of Transport Economics and Policy, Vol 39, No 2, pp127-153. Jones P, 2003: Acceptability of transport pricing strategies: Meeting the challenge, in Schade J and Schlag B (eds), Acceptability of transport pricing strategies, Elsevier Science, Oxford. Kahneman D and Tversky A, 1979: Prospect theory: An analysis of decision under risk, Econometrica, Vol 47, No 2, pp263-291. Latham G and Locke E, 1991: Self-regulation through goal setting, Organizational Behavior and Human Decision Processes, Vol 50, No 2, pp212-247. Pas E and Sundar S, 1995: Intrapersonal variability in daily urban travel behavior: Some additional evidence, Transportation, Vol 22, No 2, pp135-150. Rye T, 2002: Travel plans: Do they work?, Transport Policy, Vol 9, No 4, pp287-298. 428
- 18. Saleh W and Farrell S, 2007: Investigation and analysis of evidence of asymmetric churn in travel demand models, Transportation Research Part A, Vol 41, No 7, pp691-702. Schuitema G, Steg L and Forward S, 2010: Explaining differences in acceptability before and acceptance after the implementation of a congestion charge in Stockholm, Transportation Research Part A, Vol 44, pp99-109. Simon H, 1955: A behavioural model of rational choice, Quarterly Journal of Economics Vol 69, No 1, pp99-118. TC, 2014: Transportation demand management database, Transport Canada, Ottawa. (http://data.tc.gc.ca/archive/eng/programs/environment-utsp-tdm-1037.htm) TCT, 2013a: 2013 - 2018 Comprehensive integrated transport plan, Transport for Cape Town, City of Cape Town. TCT, 2013b: Travel SMART project evaluation report, Transport for Cape Town, City of Cape Town. TCT, 2013c: Towards a congestion management framework for Cape Town, Transport for Cape Town, City of Cape Town. TRB, 2014: Traveler response to transportation system changes handbook, TCRP Report 95 Collection, Transportation Research Board, National Academy of Sciences, Washington DC. (www.trb.org/Publications/TCRPReport95.aspx); Triandis H, 1977: Interpersonal behaviour, Brooks/Cole Publishing Company, Monterey. Van Rensburg J and Behrens R, 2011: Measuring the impacts of rail-based park- and-ride facilities on commuting behaviour in Cape Town: Findings and methodological lessons, 30th Southern African Transport Conference, Pretoria. VTPI, 2014: Online TDM encyclopaedia, Victoria Transport Policy Institute, Victoria (www.vtpi.org/tdm/). 429
- 19. Appendix A. Categorisation of TDM measures TDM measures Trip decision element targeted Voluntary flexitime trip timing compressed work week trip generation telecommuting trip generation telephone/internet shopping and home delivery services trip generation carpooling (including matching services, HOV lanes, preferential parking and guaranteed ride- home programmes) vehicle occupancy, mode use vanpooling vehicle occupancy, mode use carsharing mode use Regulatory staggered work hours trip timing staggered school hours trip timing reduced minimum parking requirements mode use maximum parking requirements mode use shared parking schemes (including centralised management and fees-in-lieu) mode use area-wide parking cap mode use transferable parking entitlements mode use vehicle use restrictions mode use, trip generation area entry restrictions mode use, route Financial incentives parking cash-outs mode use all mode business travel reimbursements mode use all mode salary benefits mode use free toll lanes (HOT) mode use, vehicle occupancy discounted/free fare public transport zones and periods mode use, trip timing discounted/free park-and-ride parking for public transport passengers mode use discounted/free HOV parking vehicle occupancy, mode use Financial charges area congestion charging (i.e. one daily charge) mode use, trip timing cordon congestion charging (i.e. multiple daily charges) mode use, trip timing route congestion charging mode use, trip timing variable parking pricing mode use, vehicle occupancy, trip timing fuel pricing mode use vehicle kilometres travelled-based fees mode use 430