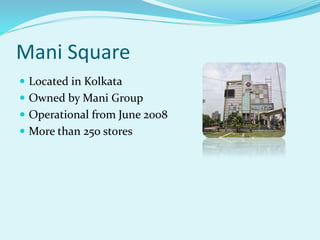
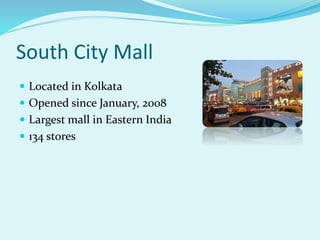
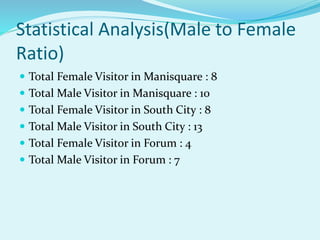
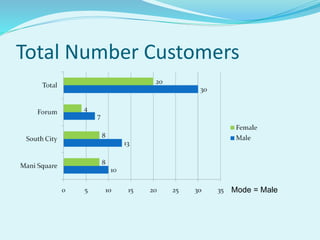
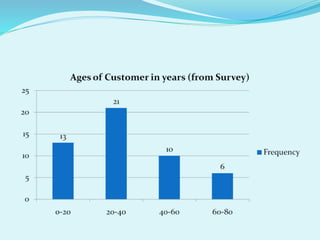
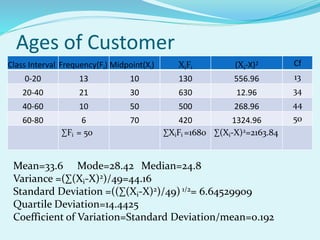
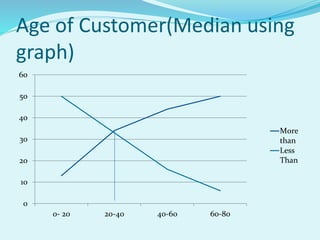
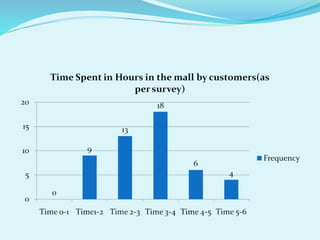
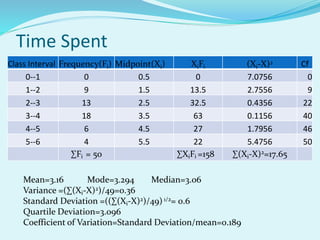
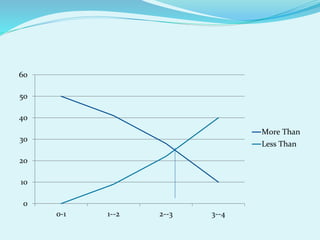
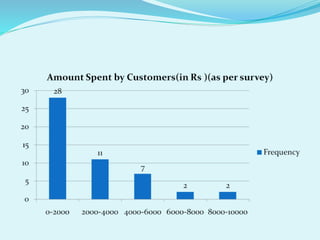
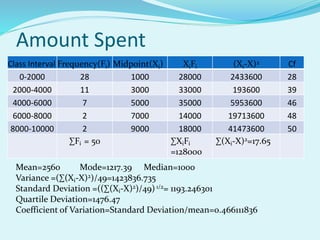
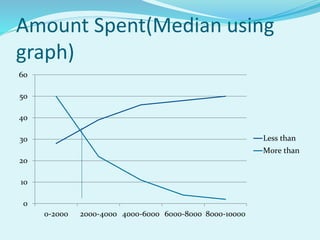
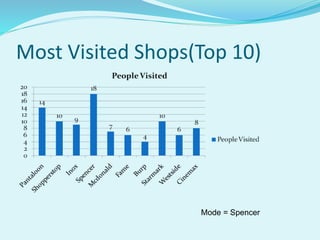
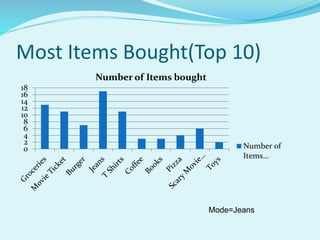
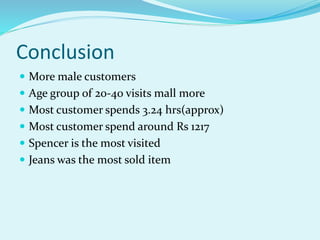
Agenda
 Malls Visited
 About Malls
 Statistical Data on Survey
 Conclusion
Malls Visited
 Mani Square
 South City Mall
 Forum
Mani Square
 Located in Kolkata
 Owned by Mani Group
 Operational from June 2008
 More than 250 stores
South City Mall
 Located in Kolkata
 Opened since January, 2008
 Largest mall in Eastern India
 134 stores
Forum
 Located in Kolkata
 Owned by Rahul saraf
 Opened in 2003
Statistical Analysis(Male to Female
Ratio)
 Total Female Visitor in Manisquare : 8
 Total Male Visitor in Manisquare : 10
 Total Female Visitor in South City : 8
 Total Male Visitor in South City : 13
 Total Female Visitor in Forum : 4
 Total Male Visitor in Forum : 7
Total Number Customers
Mode = Male
Ages of Customer
Class Interval Frequency(Fi) Midpoint(Xi) XiFi (Xi-X)2 Cf
0-20 13 10 130 556.96 13
20-40 21 30 630 12.96 34
40-60 10 50 500 268.96 44
60-80 6 70 420 1324.96 50
∑Fi = 50 ∑XiFi =1680 ∑(Xi-X)2=2163.84
Mean=33.6 Mode=28.42 Median=24.8
Variance =(∑(Xi-X)2)/49=44.16
Standard Deviation =((∑(Xi-X)2)/49) 1/2= 6.64529909
Quartile Deviation=14.4425
Coefficient of Variation=Standard Deviation/mean=0.192
Age of Customer(Median using
graph)
0
10
20
30
40
50
60
0- 20 20-40 40-60 60-80
More
than
Less
Than
Time Spent
Class Interval Frequency(Fi) Midpoint(Xi) XiFi (Xi-X)2 Cf
0--1 0 0.5 0 7.0756 0
1--2 9 1.5 13.5 2.7556 9
2--3 13 2.5 32.5 0.4356 22
3--4 18 3.5 63 0.1156 40
4--5 6 4.5 27 1.7956 46
5--6 4 5.5 22 5.4756 50
∑Fi = 50 ∑XiFi =158 ∑(Xi-X)2=17.65
Mean=3.16 Mode=3.294 Median=3.06
Variance =(∑(Xi-X)2)/49=0.36
Standard Deviation =((∑(Xi-X)2)/49)1/2= 0.6
Quartile Deviation=3.096
Coefficient of Variation=Standard Deviation/mean=0.189
0
10
20
30
40
50
60
0-1 1--2 2--3 3--4
More Than
Less Than
Amount Spent
Class Interval Frequency(Fi) Midpoint(Xi) XiFi (Xi-X)2 Cf
0-2000 28 1000 28000 2433600 28
2000-4000 11 3000 33000 193600 39
4000-6000 7 5000 35000 5953600 46
6000-8000 2 7000 14000 19713600 48
8000-10000 2 9000 18000 41473600 50
∑Fi = 50 ∑XiFi
=128000
∑(Xi-X)2=17.65
Mean=2560 Mode=1217.39 Median=1000
Variance =(∑(Xi-X)2)/49=1423836.735
Standard Deviation =((∑(Xi-X)2)/49)1/2= 1193.246301
Quartile Deviation=1476.47
Coefficient of Variation=Standard Deviation/mean=0.466111836
Amount Spent(Median using
graph)
0
10
20
30
40
50
60
0-2000 2000-4000 4000-6000 6000-8000 8000-10000
Less than
More than
Most Visited Shops(Top 10)
Mode = Spencer
Most Items Bought(Top 10)
0
2
4
6
8
10
12
14
16
18
Number of Items bought
Number of
Items…
Mode=Jeans
Conclusion
 More male customers
 Age group 0f 20-40 visits mall more
 Most customer spends 3.24 hrs(approx)
 Most customer spend around Rs 1217
 Spencer is the most visited
 Jeans was the most sold item
Thank you

A statistical Analysis of Malls(Customers)

  • 2.
    Agenda  Malls Visited About Malls  Statistical Data on Survey  Conclusion
  • 3.
    Malls Visited  ManiSquare  South City Mall  Forum
  • 4.
    Mani Square  Locatedin Kolkata  Owned by Mani Group  Operational from June 2008  More than 250 stores
  • 5.
    South City Mall Located in Kolkata  Opened since January, 2008  Largest mall in Eastern India  134 stores
  • 6.
    Forum  Located inKolkata  Owned by Rahul saraf  Opened in 2003
  • 7.
    Statistical Analysis(Male toFemale Ratio)  Total Female Visitor in Manisquare : 8  Total Male Visitor in Manisquare : 10  Total Female Visitor in South City : 8  Total Male Visitor in South City : 13  Total Female Visitor in Forum : 4  Total Male Visitor in Forum : 7
  • 8.
  • 10.
    Ages of Customer ClassInterval Frequency(Fi) Midpoint(Xi) XiFi (Xi-X)2 Cf 0-20 13 10 130 556.96 13 20-40 21 30 630 12.96 34 40-60 10 50 500 268.96 44 60-80 6 70 420 1324.96 50 ∑Fi = 50 ∑XiFi =1680 ∑(Xi-X)2=2163.84 Mean=33.6 Mode=28.42 Median=24.8 Variance =(∑(Xi-X)2)/49=44.16 Standard Deviation =((∑(Xi-X)2)/49) 1/2= 6.64529909 Quartile Deviation=14.4425 Coefficient of Variation=Standard Deviation/mean=0.192
  • 11.
    Age of Customer(Medianusing graph) 0 10 20 30 40 50 60 0- 20 20-40 40-60 60-80 More than Less Than
  • 13.
    Time Spent Class IntervalFrequency(Fi) Midpoint(Xi) XiFi (Xi-X)2 Cf 0--1 0 0.5 0 7.0756 0 1--2 9 1.5 13.5 2.7556 9 2--3 13 2.5 32.5 0.4356 22 3--4 18 3.5 63 0.1156 40 4--5 6 4.5 27 1.7956 46 5--6 4 5.5 22 5.4756 50 ∑Fi = 50 ∑XiFi =158 ∑(Xi-X)2=17.65 Mean=3.16 Mode=3.294 Median=3.06 Variance =(∑(Xi-X)2)/49=0.36 Standard Deviation =((∑(Xi-X)2)/49)1/2= 0.6 Quartile Deviation=3.096 Coefficient of Variation=Standard Deviation/mean=0.189
  • 14.
    0 10 20 30 40 50 60 0-1 1--2 2--33--4 More Than Less Than
  • 16.
    Amount Spent Class IntervalFrequency(Fi) Midpoint(Xi) XiFi (Xi-X)2 Cf 0-2000 28 1000 28000 2433600 28 2000-4000 11 3000 33000 193600 39 4000-6000 7 5000 35000 5953600 46 6000-8000 2 7000 14000 19713600 48 8000-10000 2 9000 18000 41473600 50 ∑Fi = 50 ∑XiFi =128000 ∑(Xi-X)2=17.65 Mean=2560 Mode=1217.39 Median=1000 Variance =(∑(Xi-X)2)/49=1423836.735 Standard Deviation =((∑(Xi-X)2)/49)1/2= 1193.246301 Quartile Deviation=1476.47 Coefficient of Variation=Standard Deviation/mean=0.466111836
  • 17.
    Amount Spent(Median using graph) 0 10 20 30 40 50 60 0-20002000-4000 4000-6000 6000-8000 8000-10000 Less than More than
  • 18.
    Most Visited Shops(Top10) Mode = Spencer
  • 19.
    Most Items Bought(Top10) 0 2 4 6 8 10 12 14 16 18 Number of Items bought Number of Items… Mode=Jeans
  • 20.
    Conclusion  More malecustomers  Age group 0f 20-40 visits mall more  Most customer spends 3.24 hrs(approx)  Most customer spend around Rs 1217  Spencer is the most visited  Jeans was the most sold item
  • 21.