Downloaded 491 times

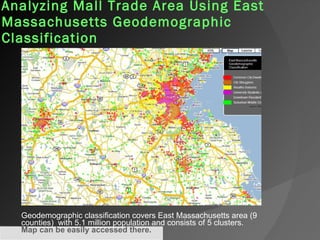
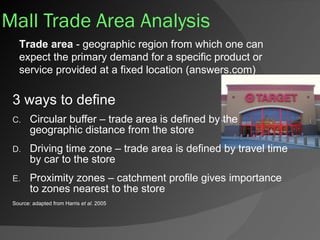
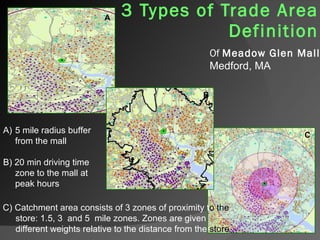
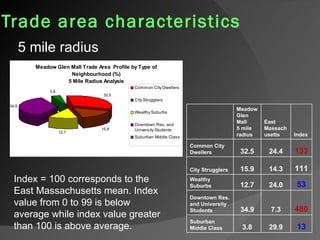
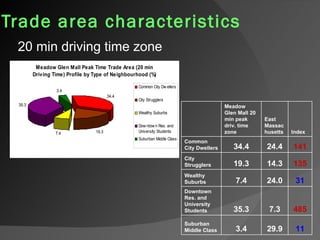
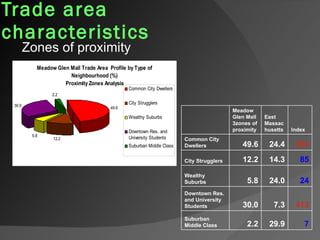
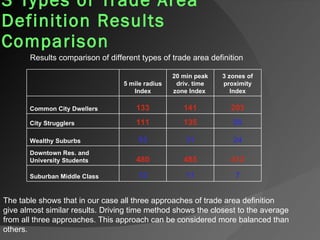
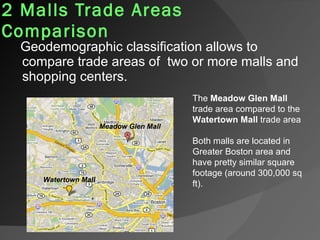

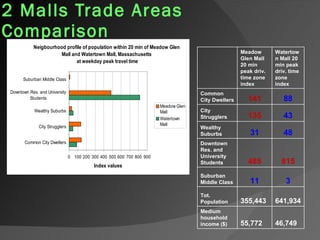
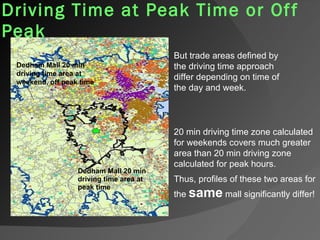
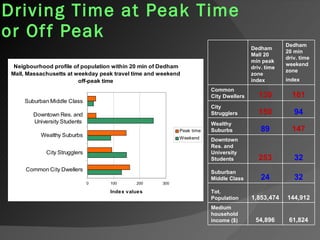

The document analyzes the trade areas of shopping malls in East Massachusetts using geodemographic classification, focusing on the Meadow Glen Mall and comparing it to the Watertown Mall. It evaluates trade areas through three methods: circular buffer, driving time zone, and proximity zones, concluding that the driving time method offers the most balanced results. The analysis highlights differences in demographics and trade area sizes, emphasizing how driving time can significantly impact trading zones depending on time and day.