The study presents a new RP-HPLC method for the simultaneous estimation of ibuprofen and tramadol in tablet dosage forms, achieving effective chromatographic separation with a mobile phase of triethylamine buffer and acetonitrile. The method demonstrated strong linearity, precision, and accuracy, with recovery studies showing no interference from common pharmaceutical additives. Validation of the method confirmed its reliability for routine pharmaceutical analysis.
![Kranthi K K et al, ICJPIR 2017, 4(1), 120-141
www.icjpir.com
~120~
Available online at www.icjpir.com ISSN: 2349-5448
Intercontinental journal of pharmaceutical
Investigations and Research
ICJPIR |Volume 4 | Issue 1 | Jan – Mar- 2017 Research Article
A new analytical method development and validation for the simultaneus
estimation of ibuprofen and tramadol using RP-HPLC
K.Kranthi Kiran, K.Saritha, K.Maryrani, L.Thomas, Santhikumari
Assoc. Professor & Jogaiah institute of Technology & Sciences College of Pharmacy, Kalagampudi.
A.P India
Corresponding Author: K.Kranthi Kiran
Email: kothapallikranthikiran@gmail.com
ABSTRACT
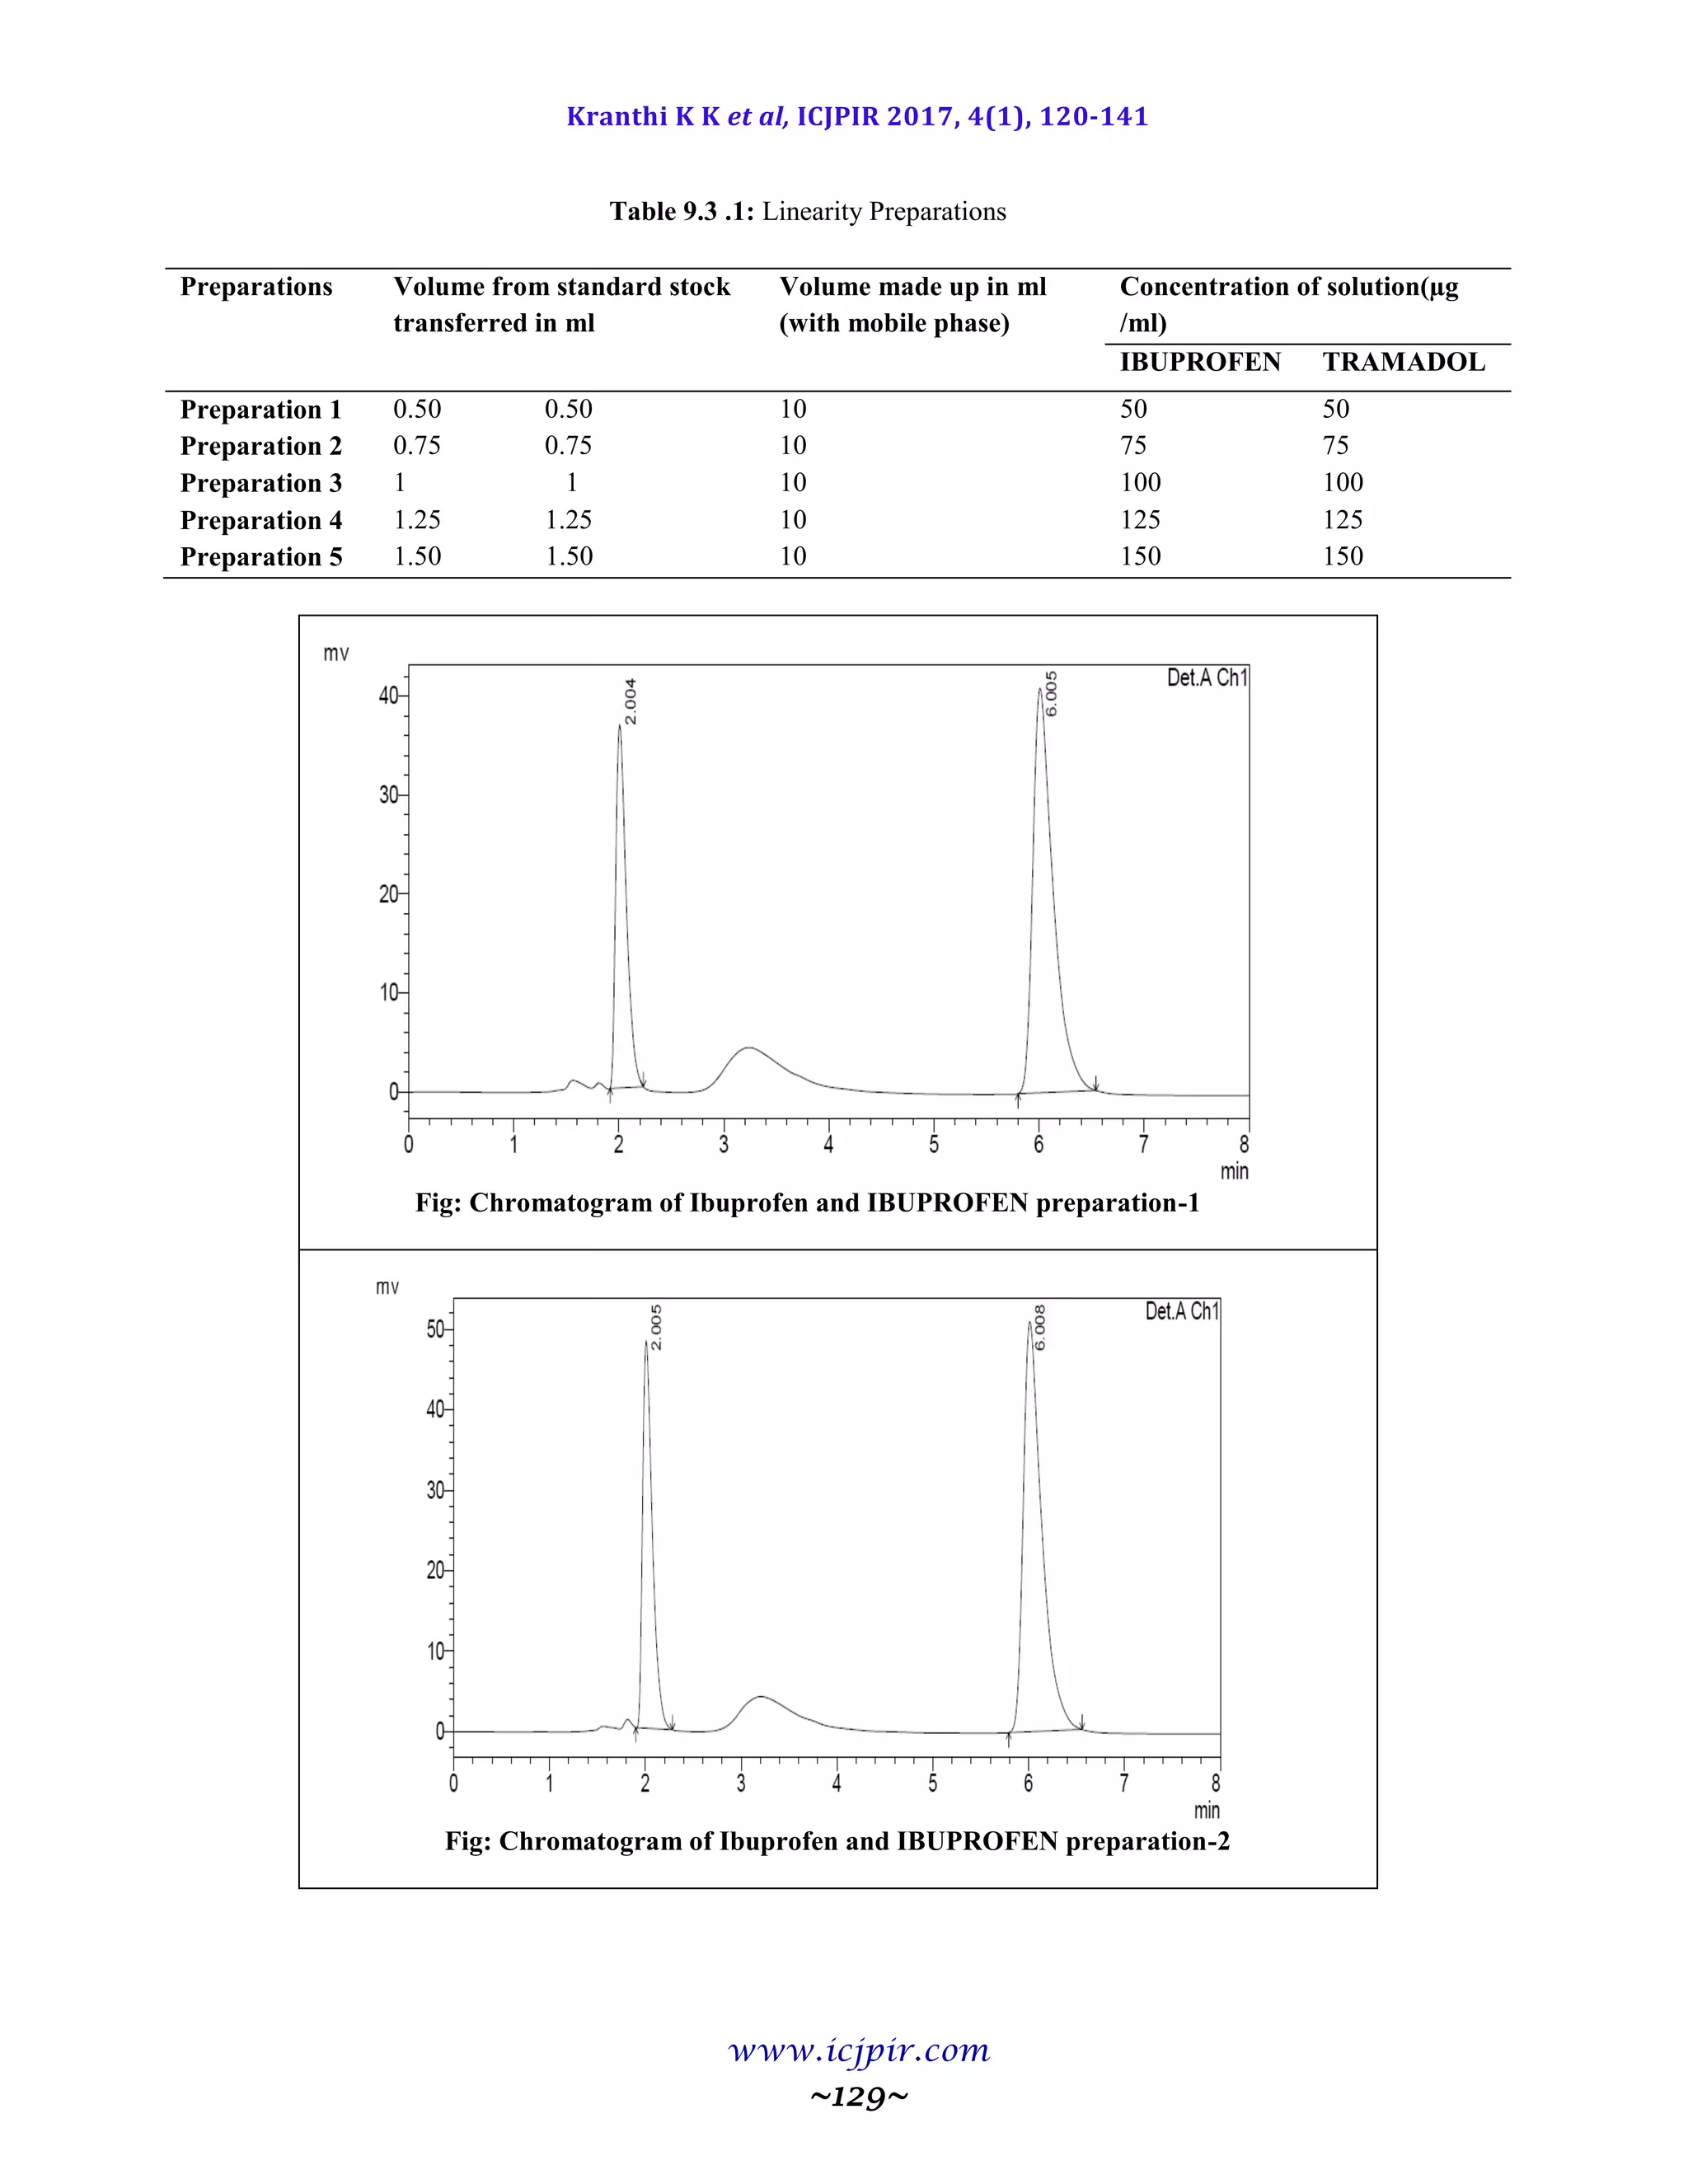
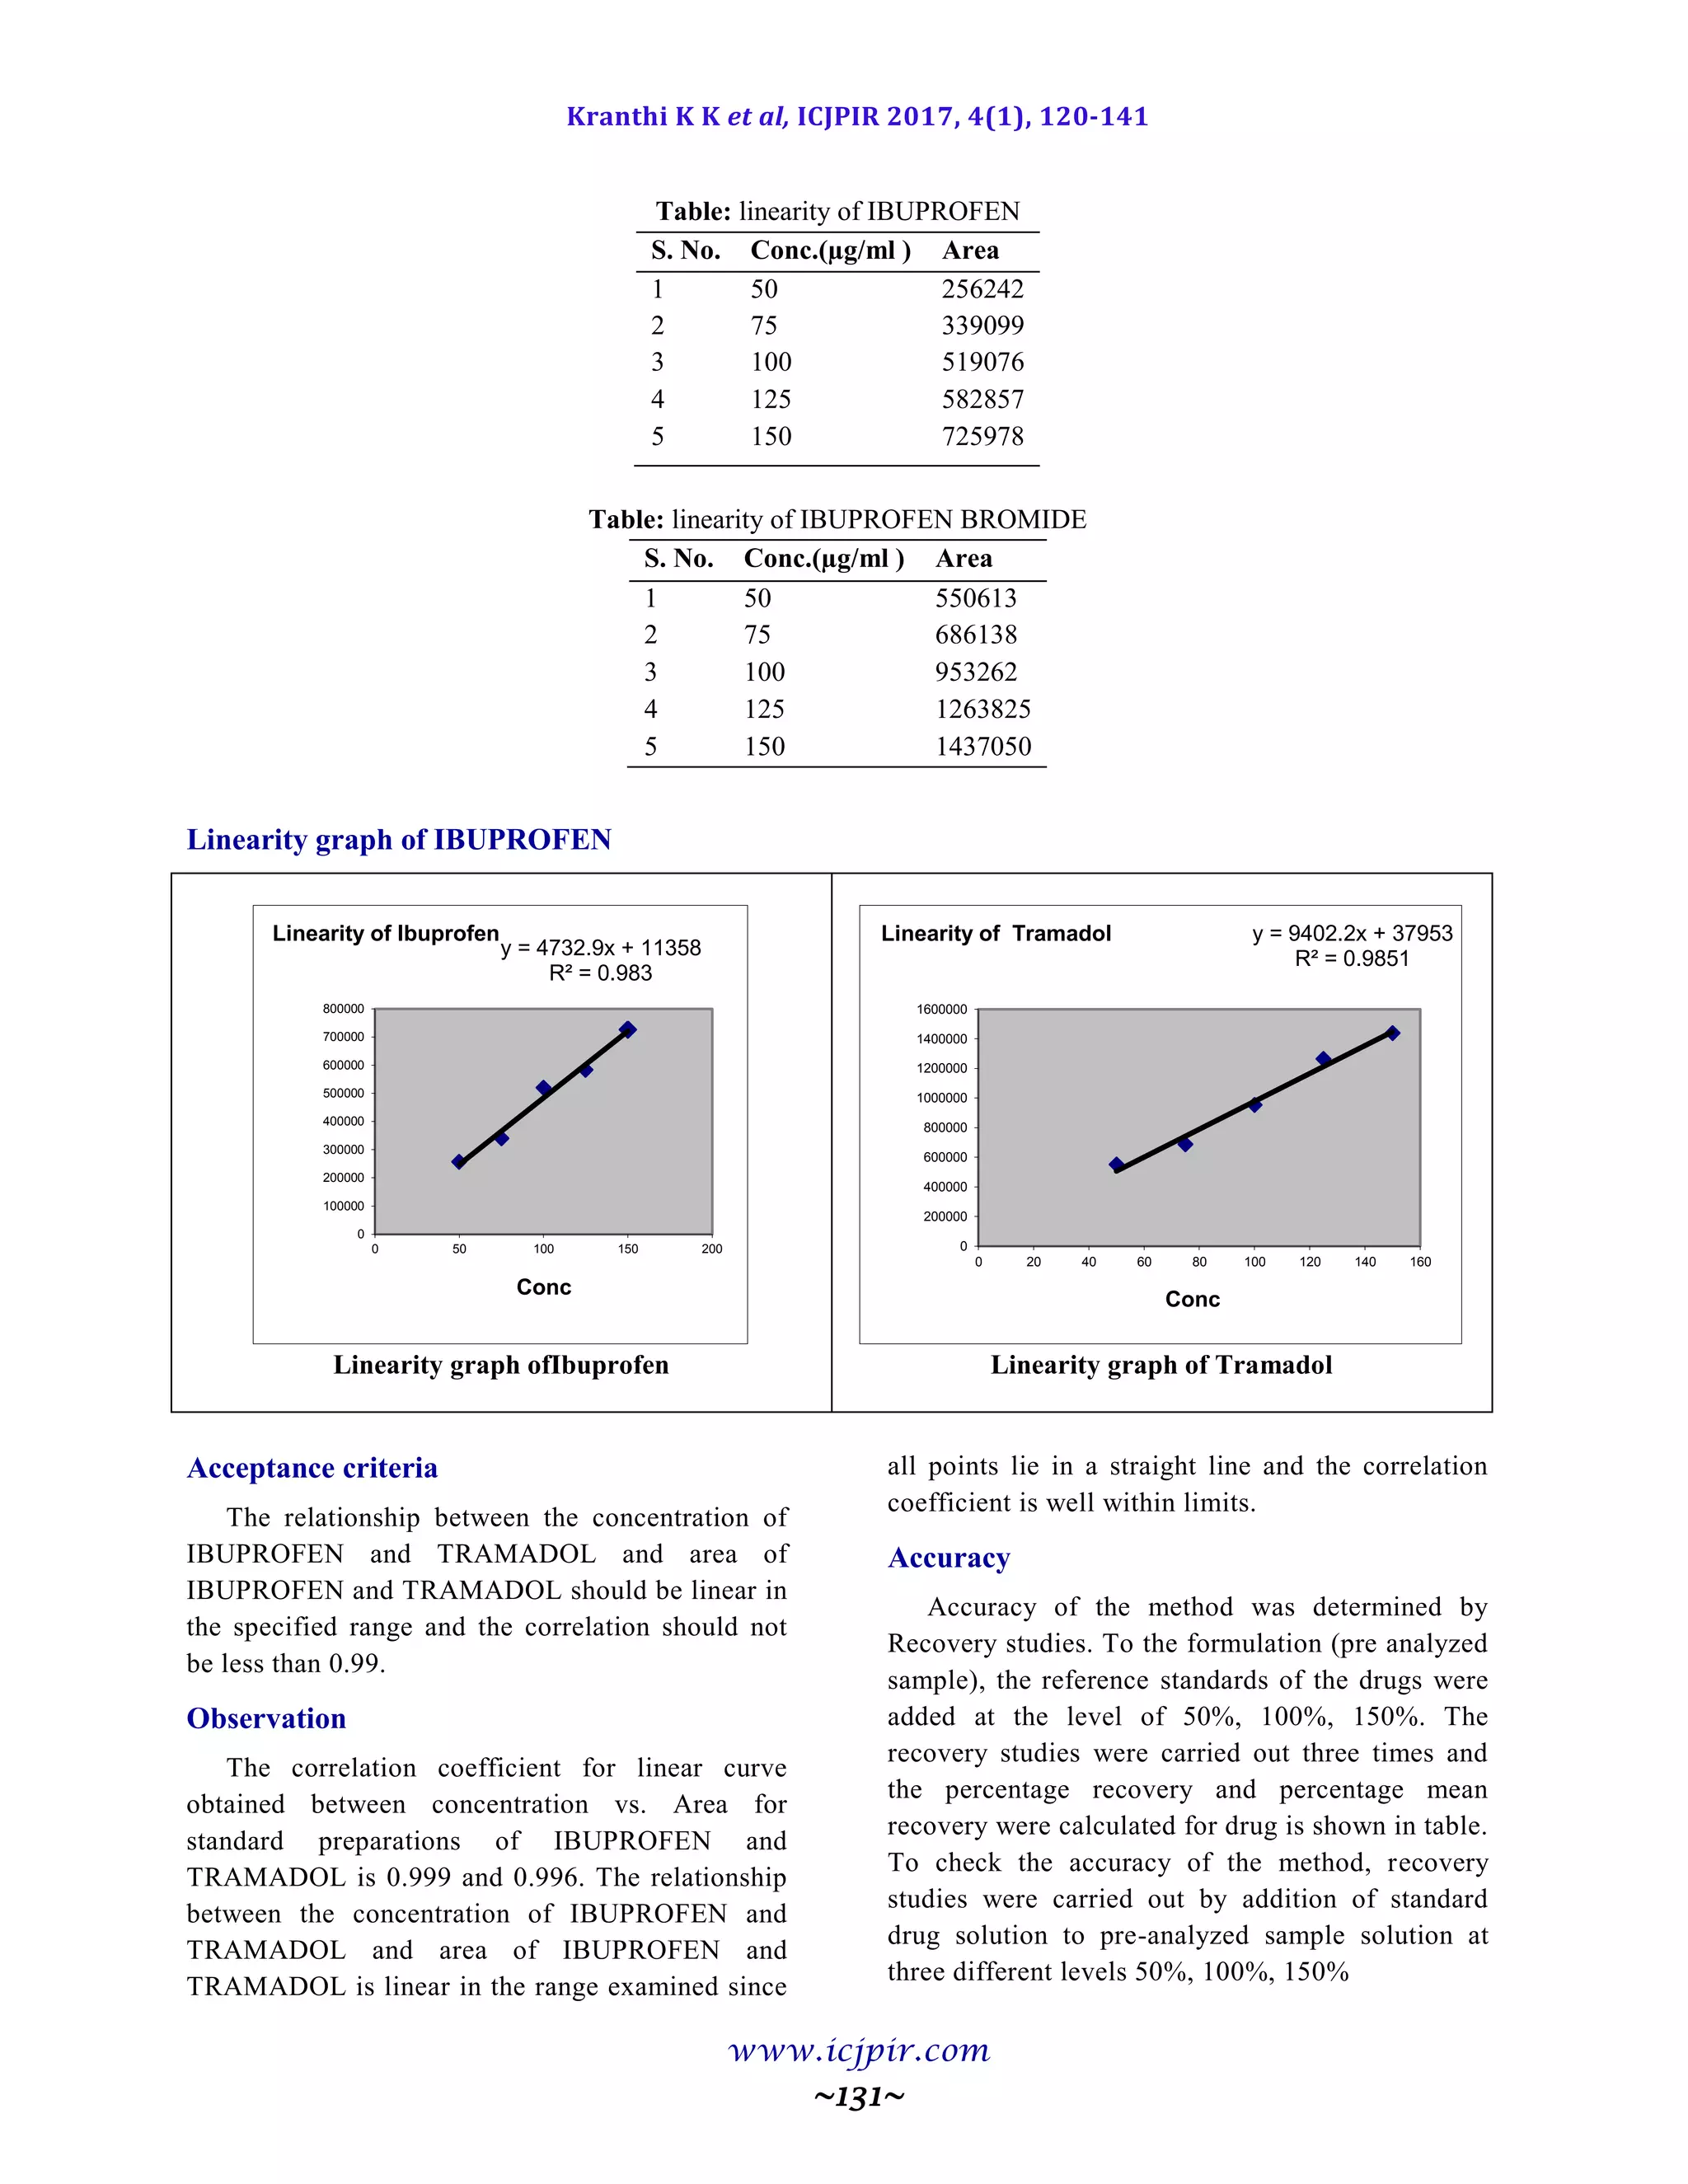
A simple and selective LC method is described for the determination of Ibuprofen and Tramadol in tablet dosage
forms. Chromatographic separation was achieved on a c18 column using mobile phase consisting of a mixture of 60
volumes of Triethylamine buffer, 40 volumes of acetonitrile with detection of 227 nm. Linearity was observed in
the range 50-150 µg/ml for Ibuprofen (r2
=0.983) and 50-150 µg /ml for Tramadol (r2
=0.985) for the amount of
drugs estimated by the proposed methods was in good agreement with the label claim.
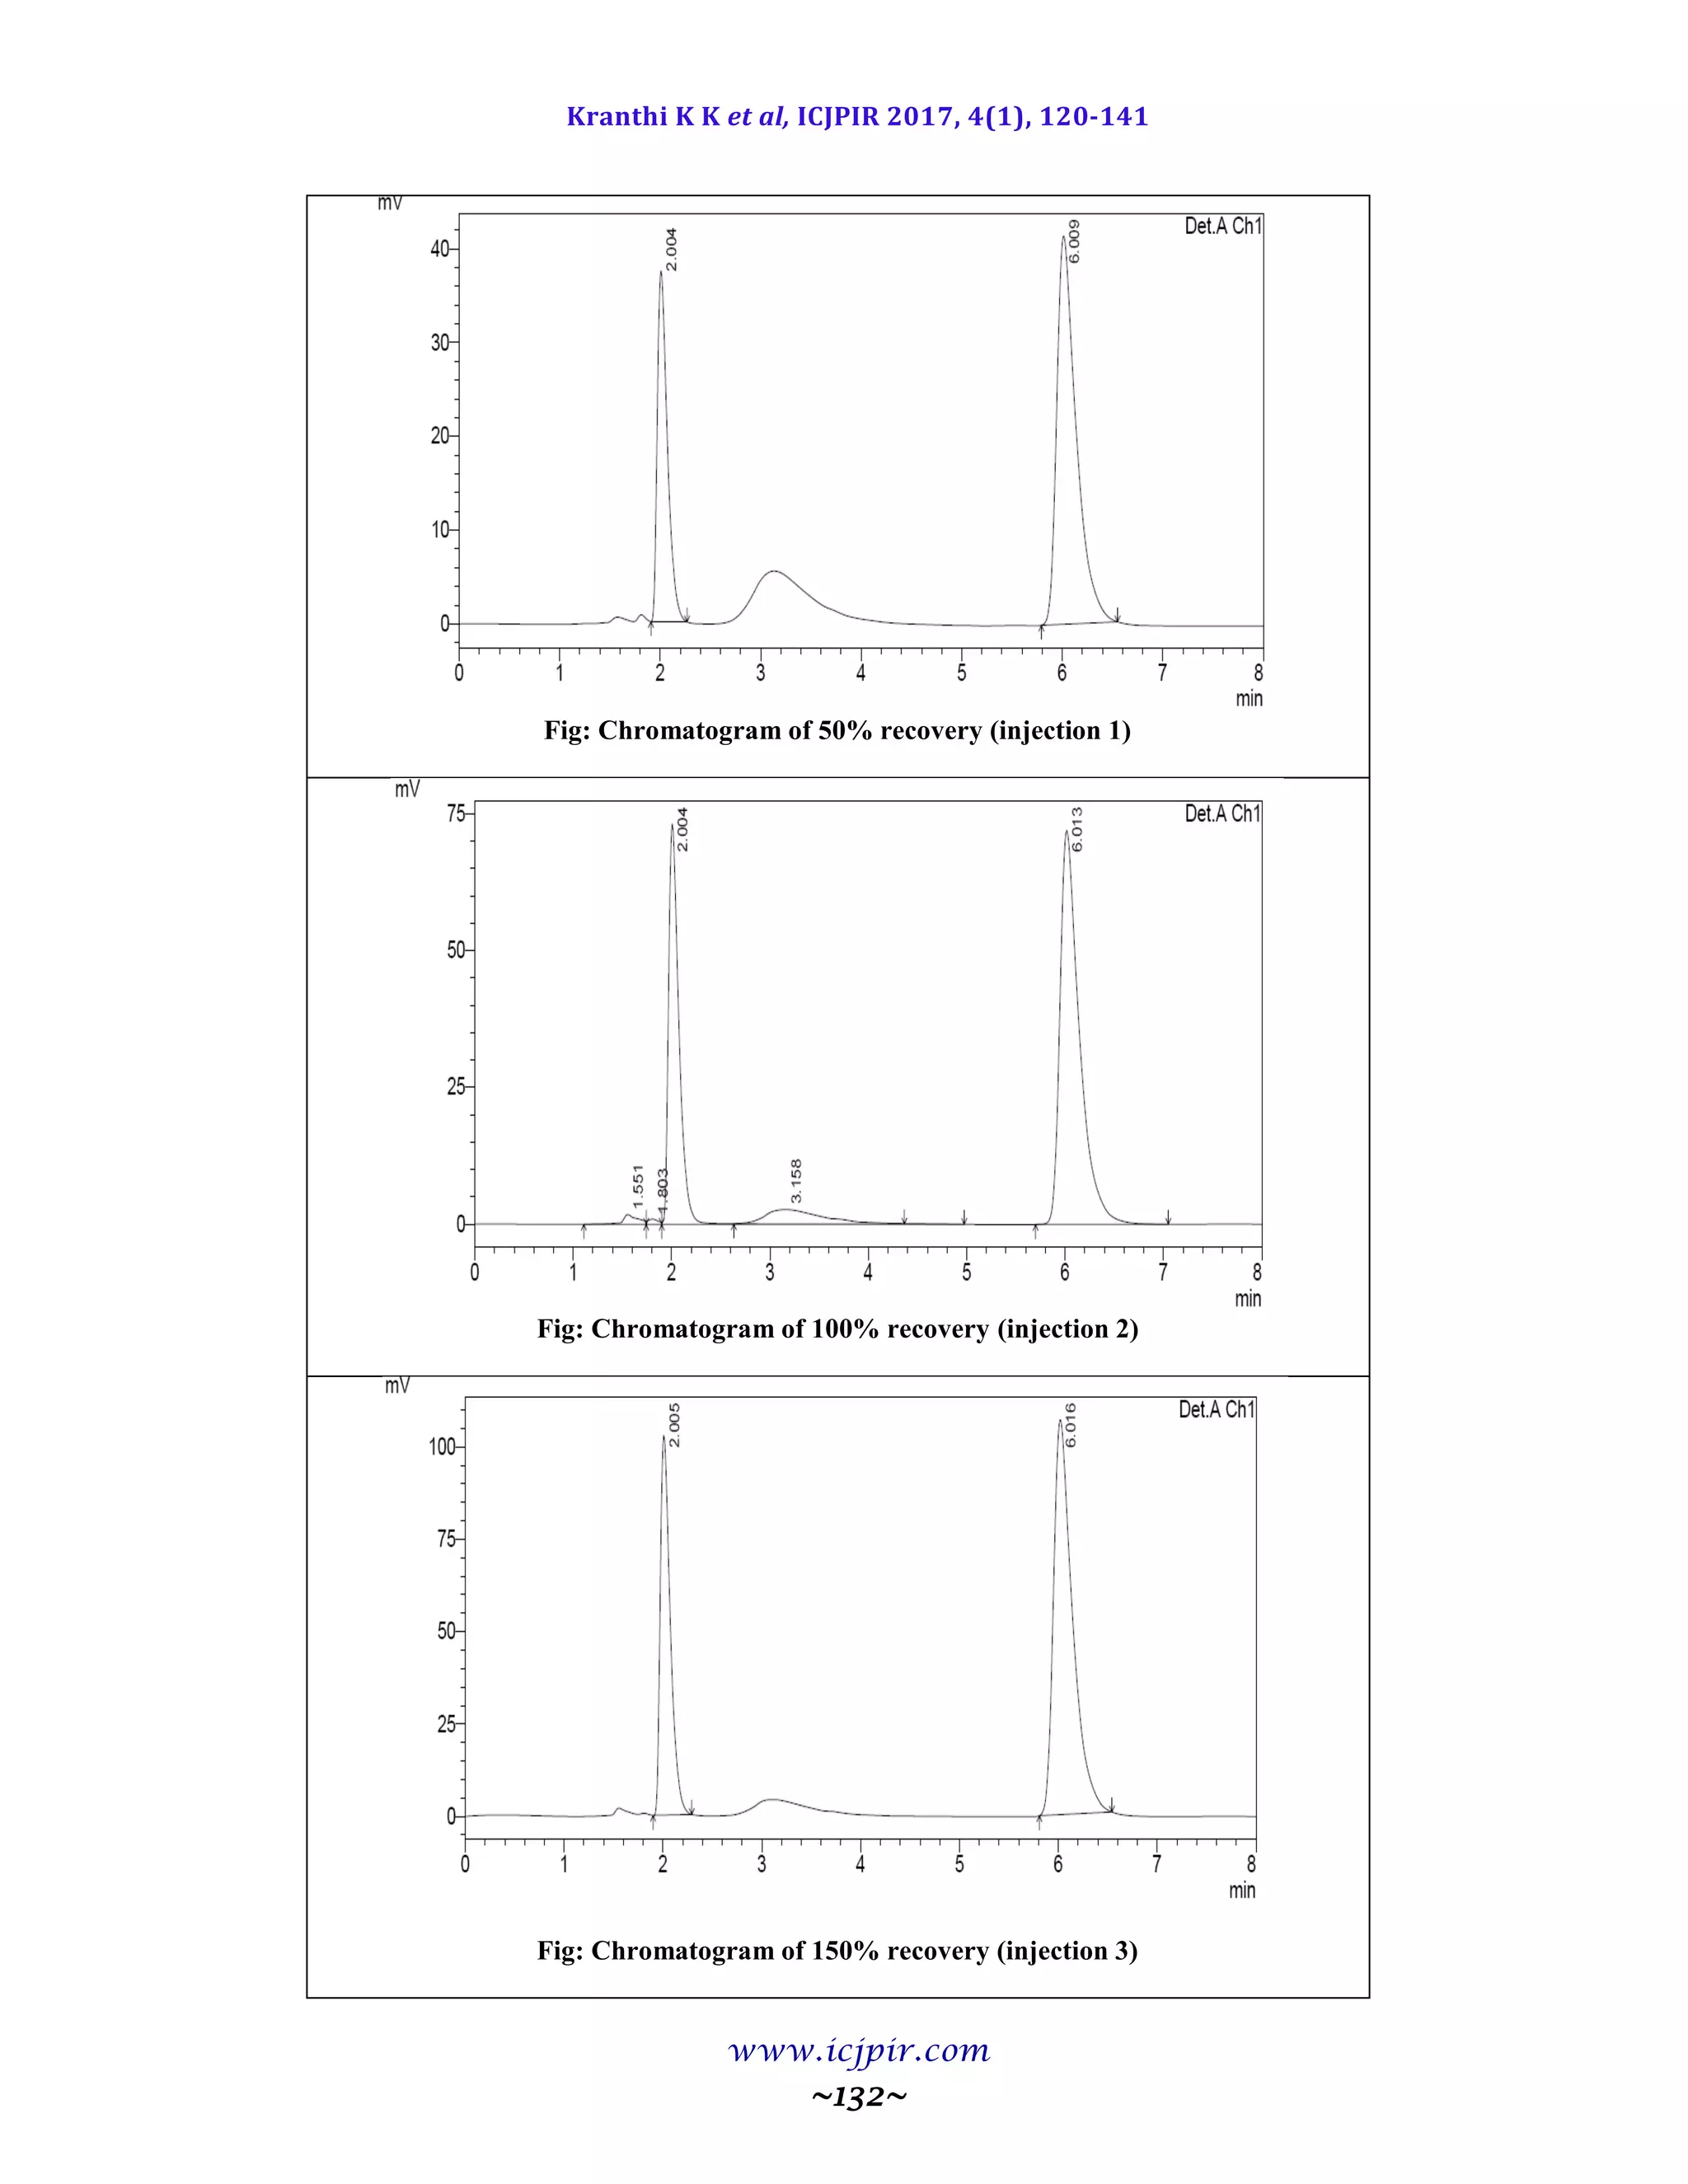
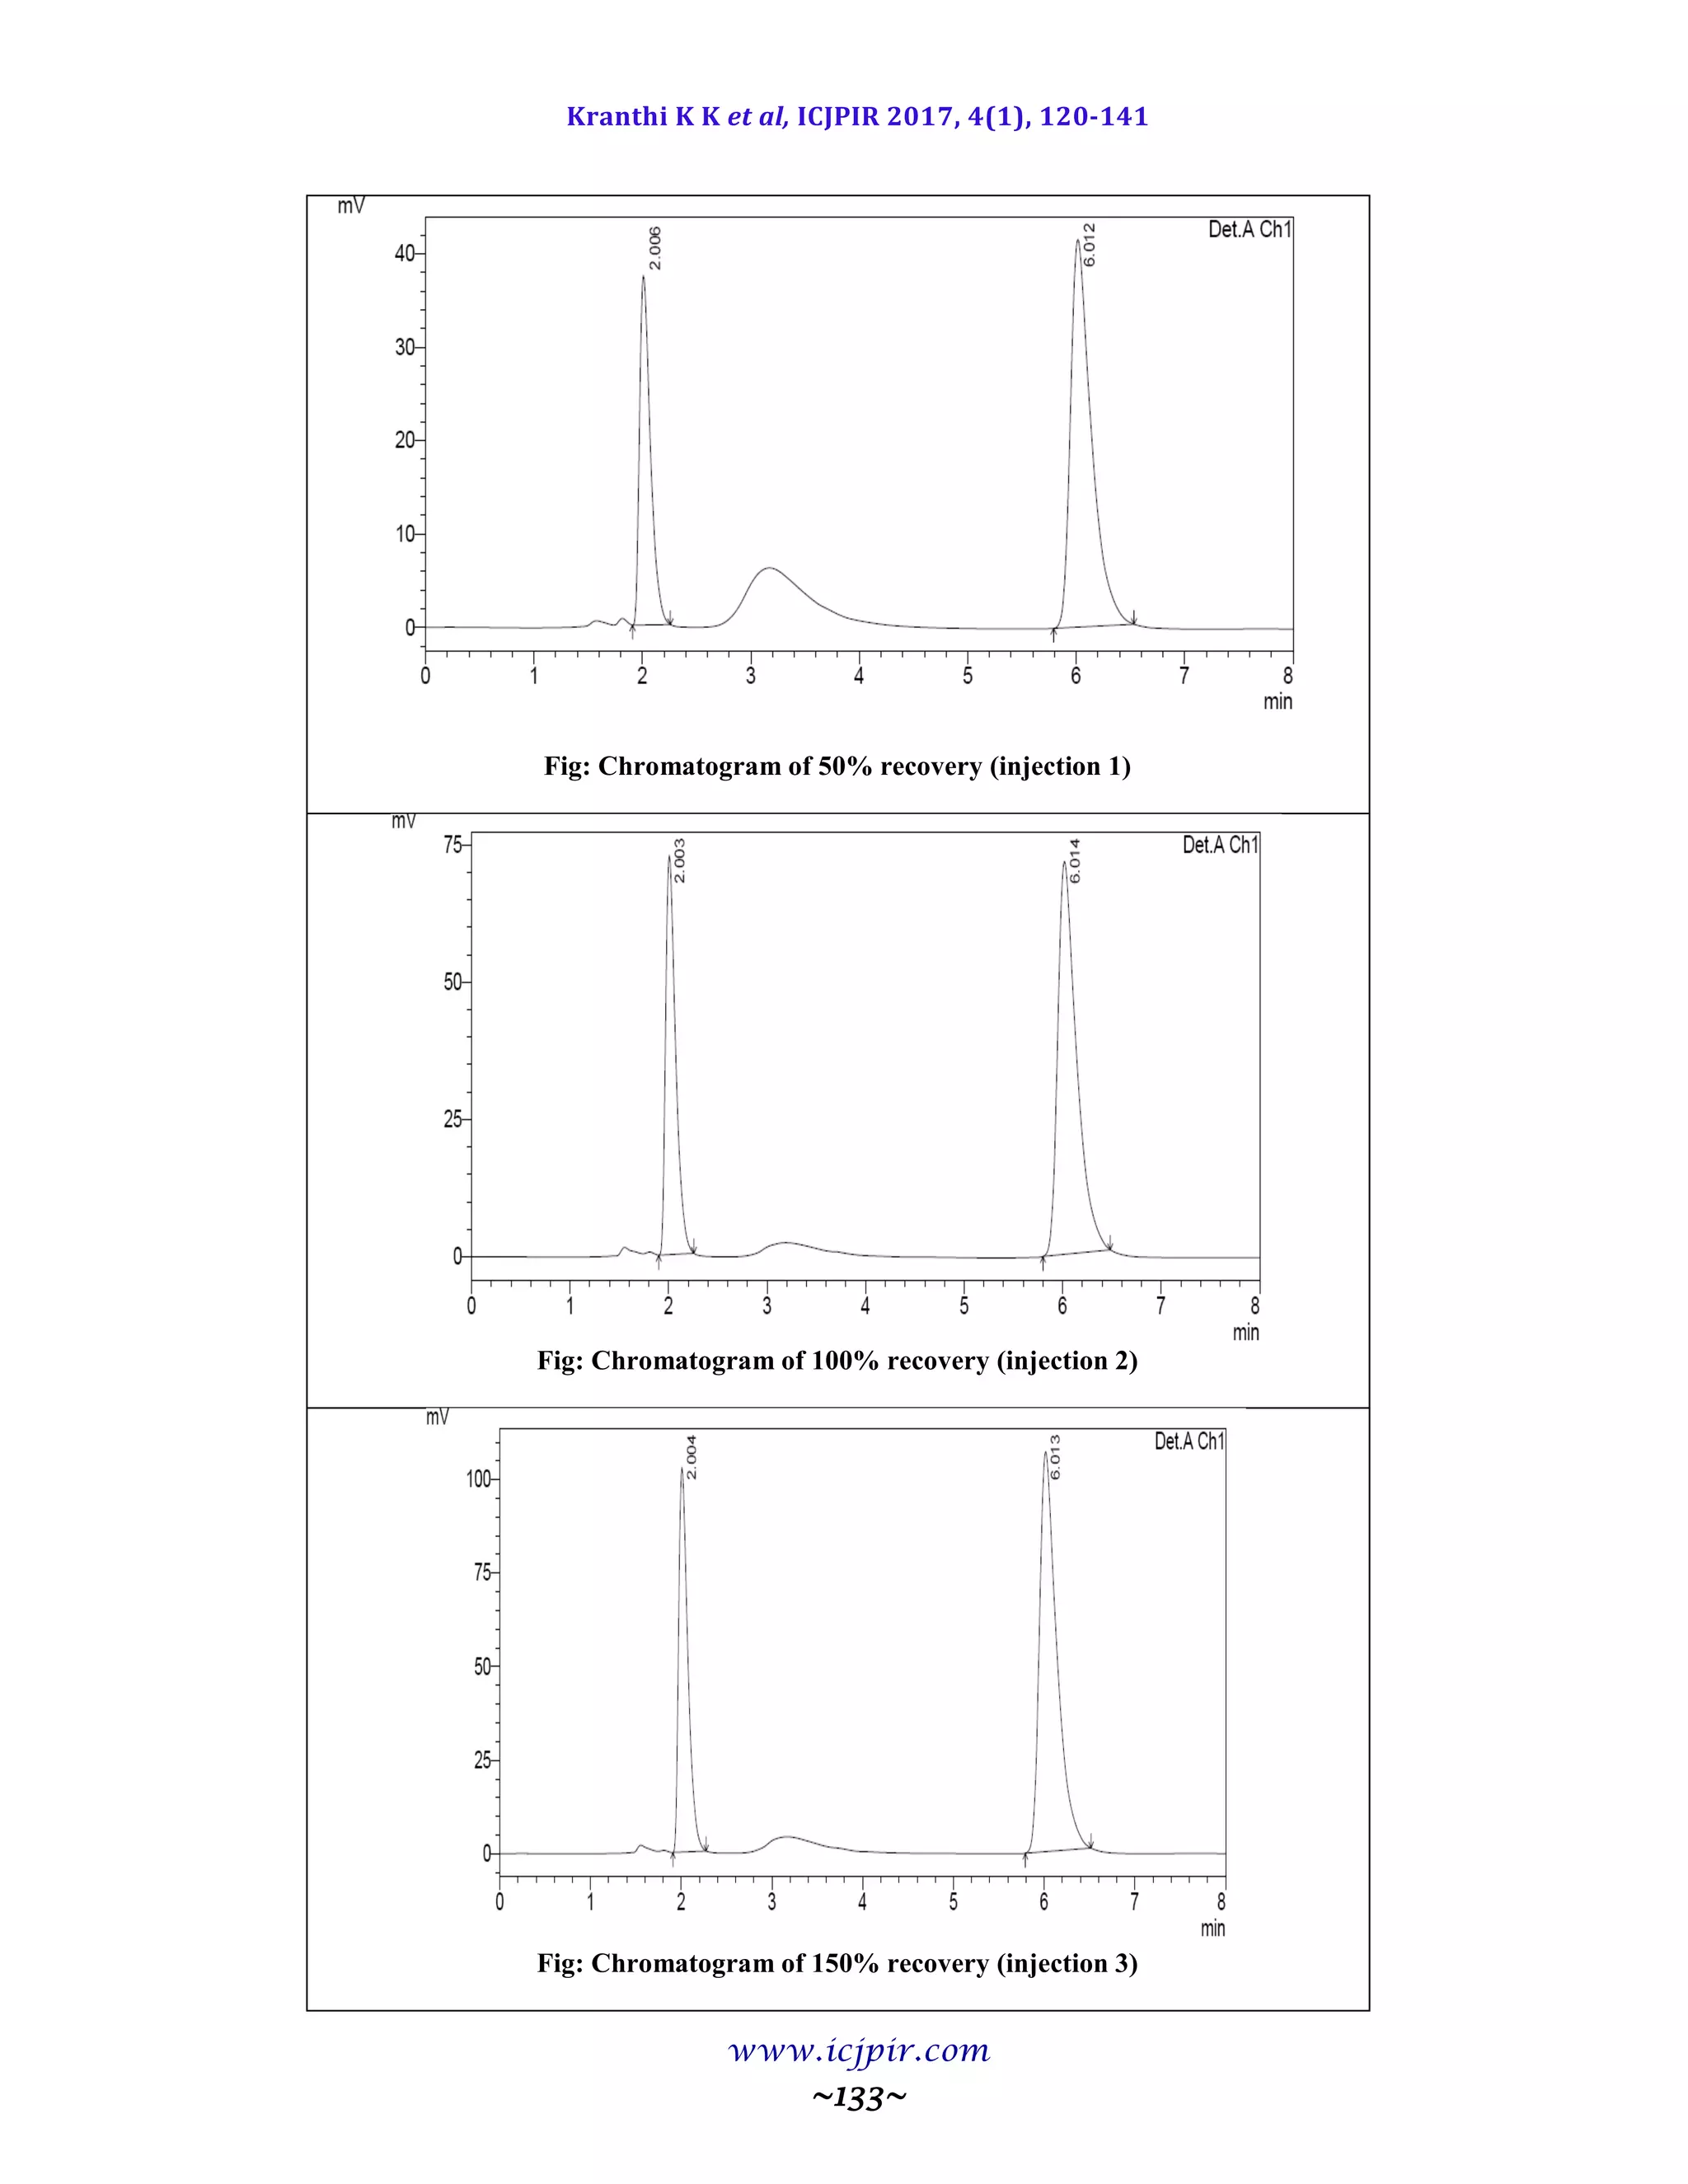
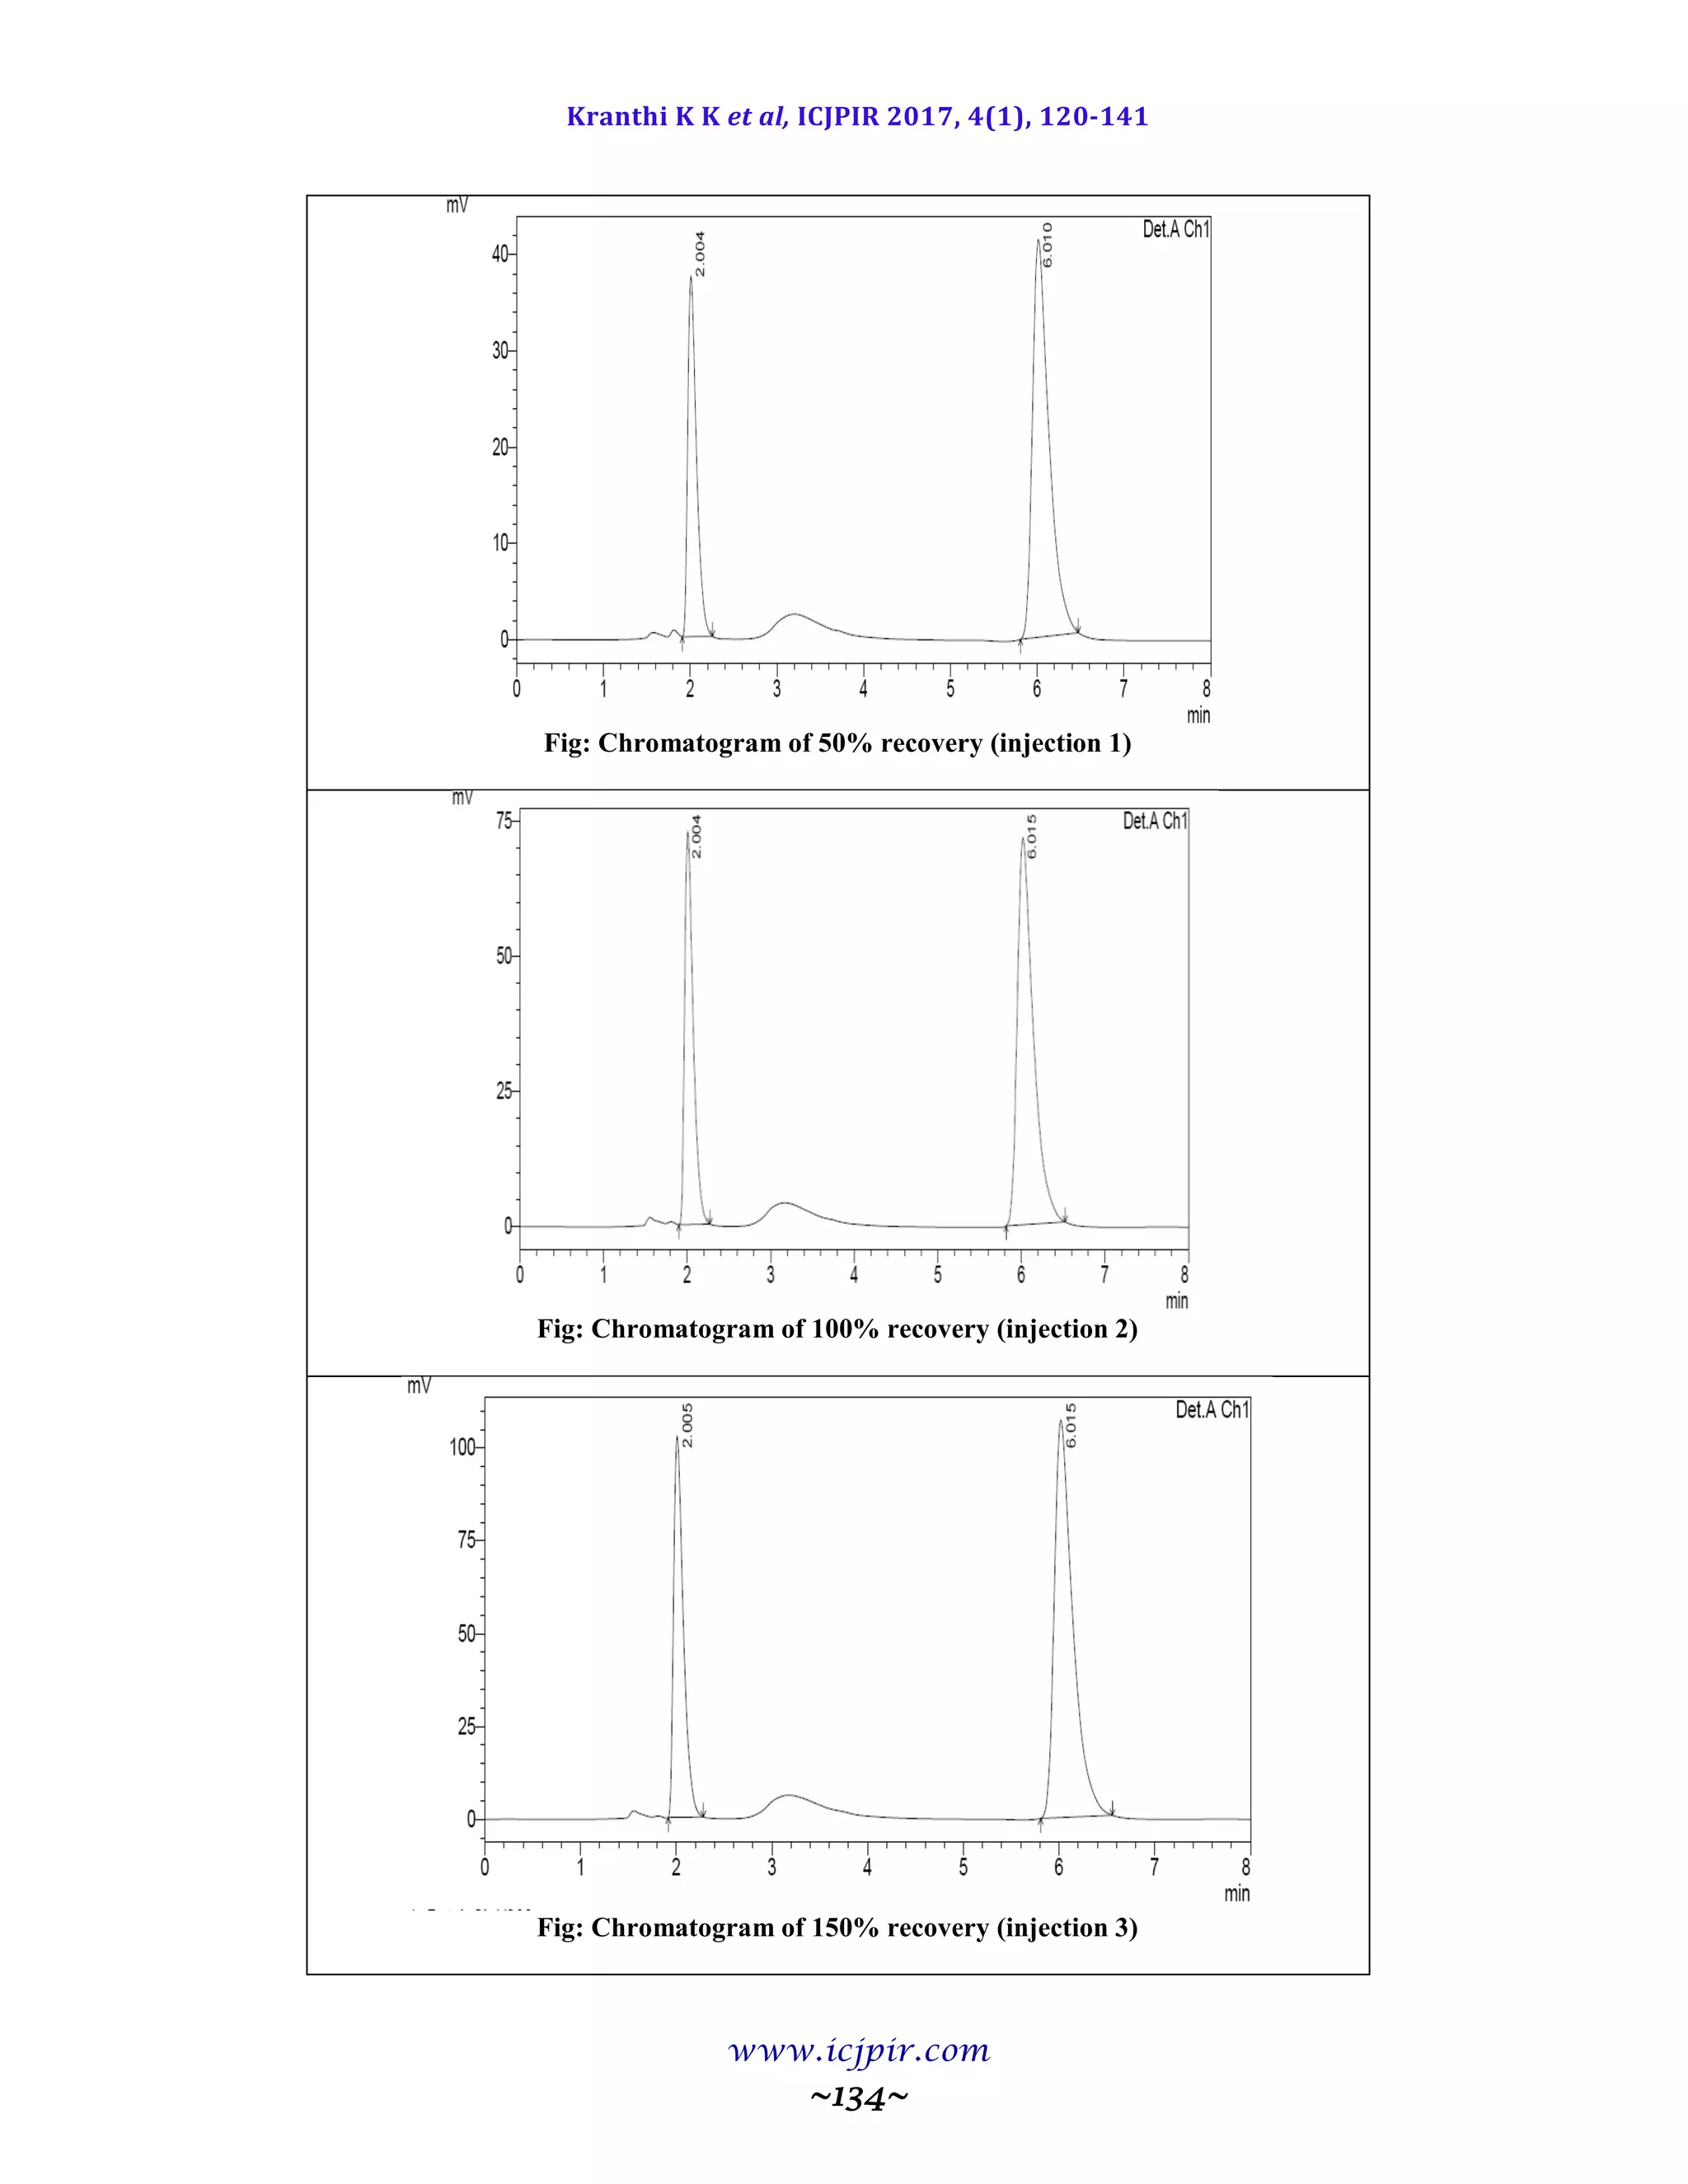
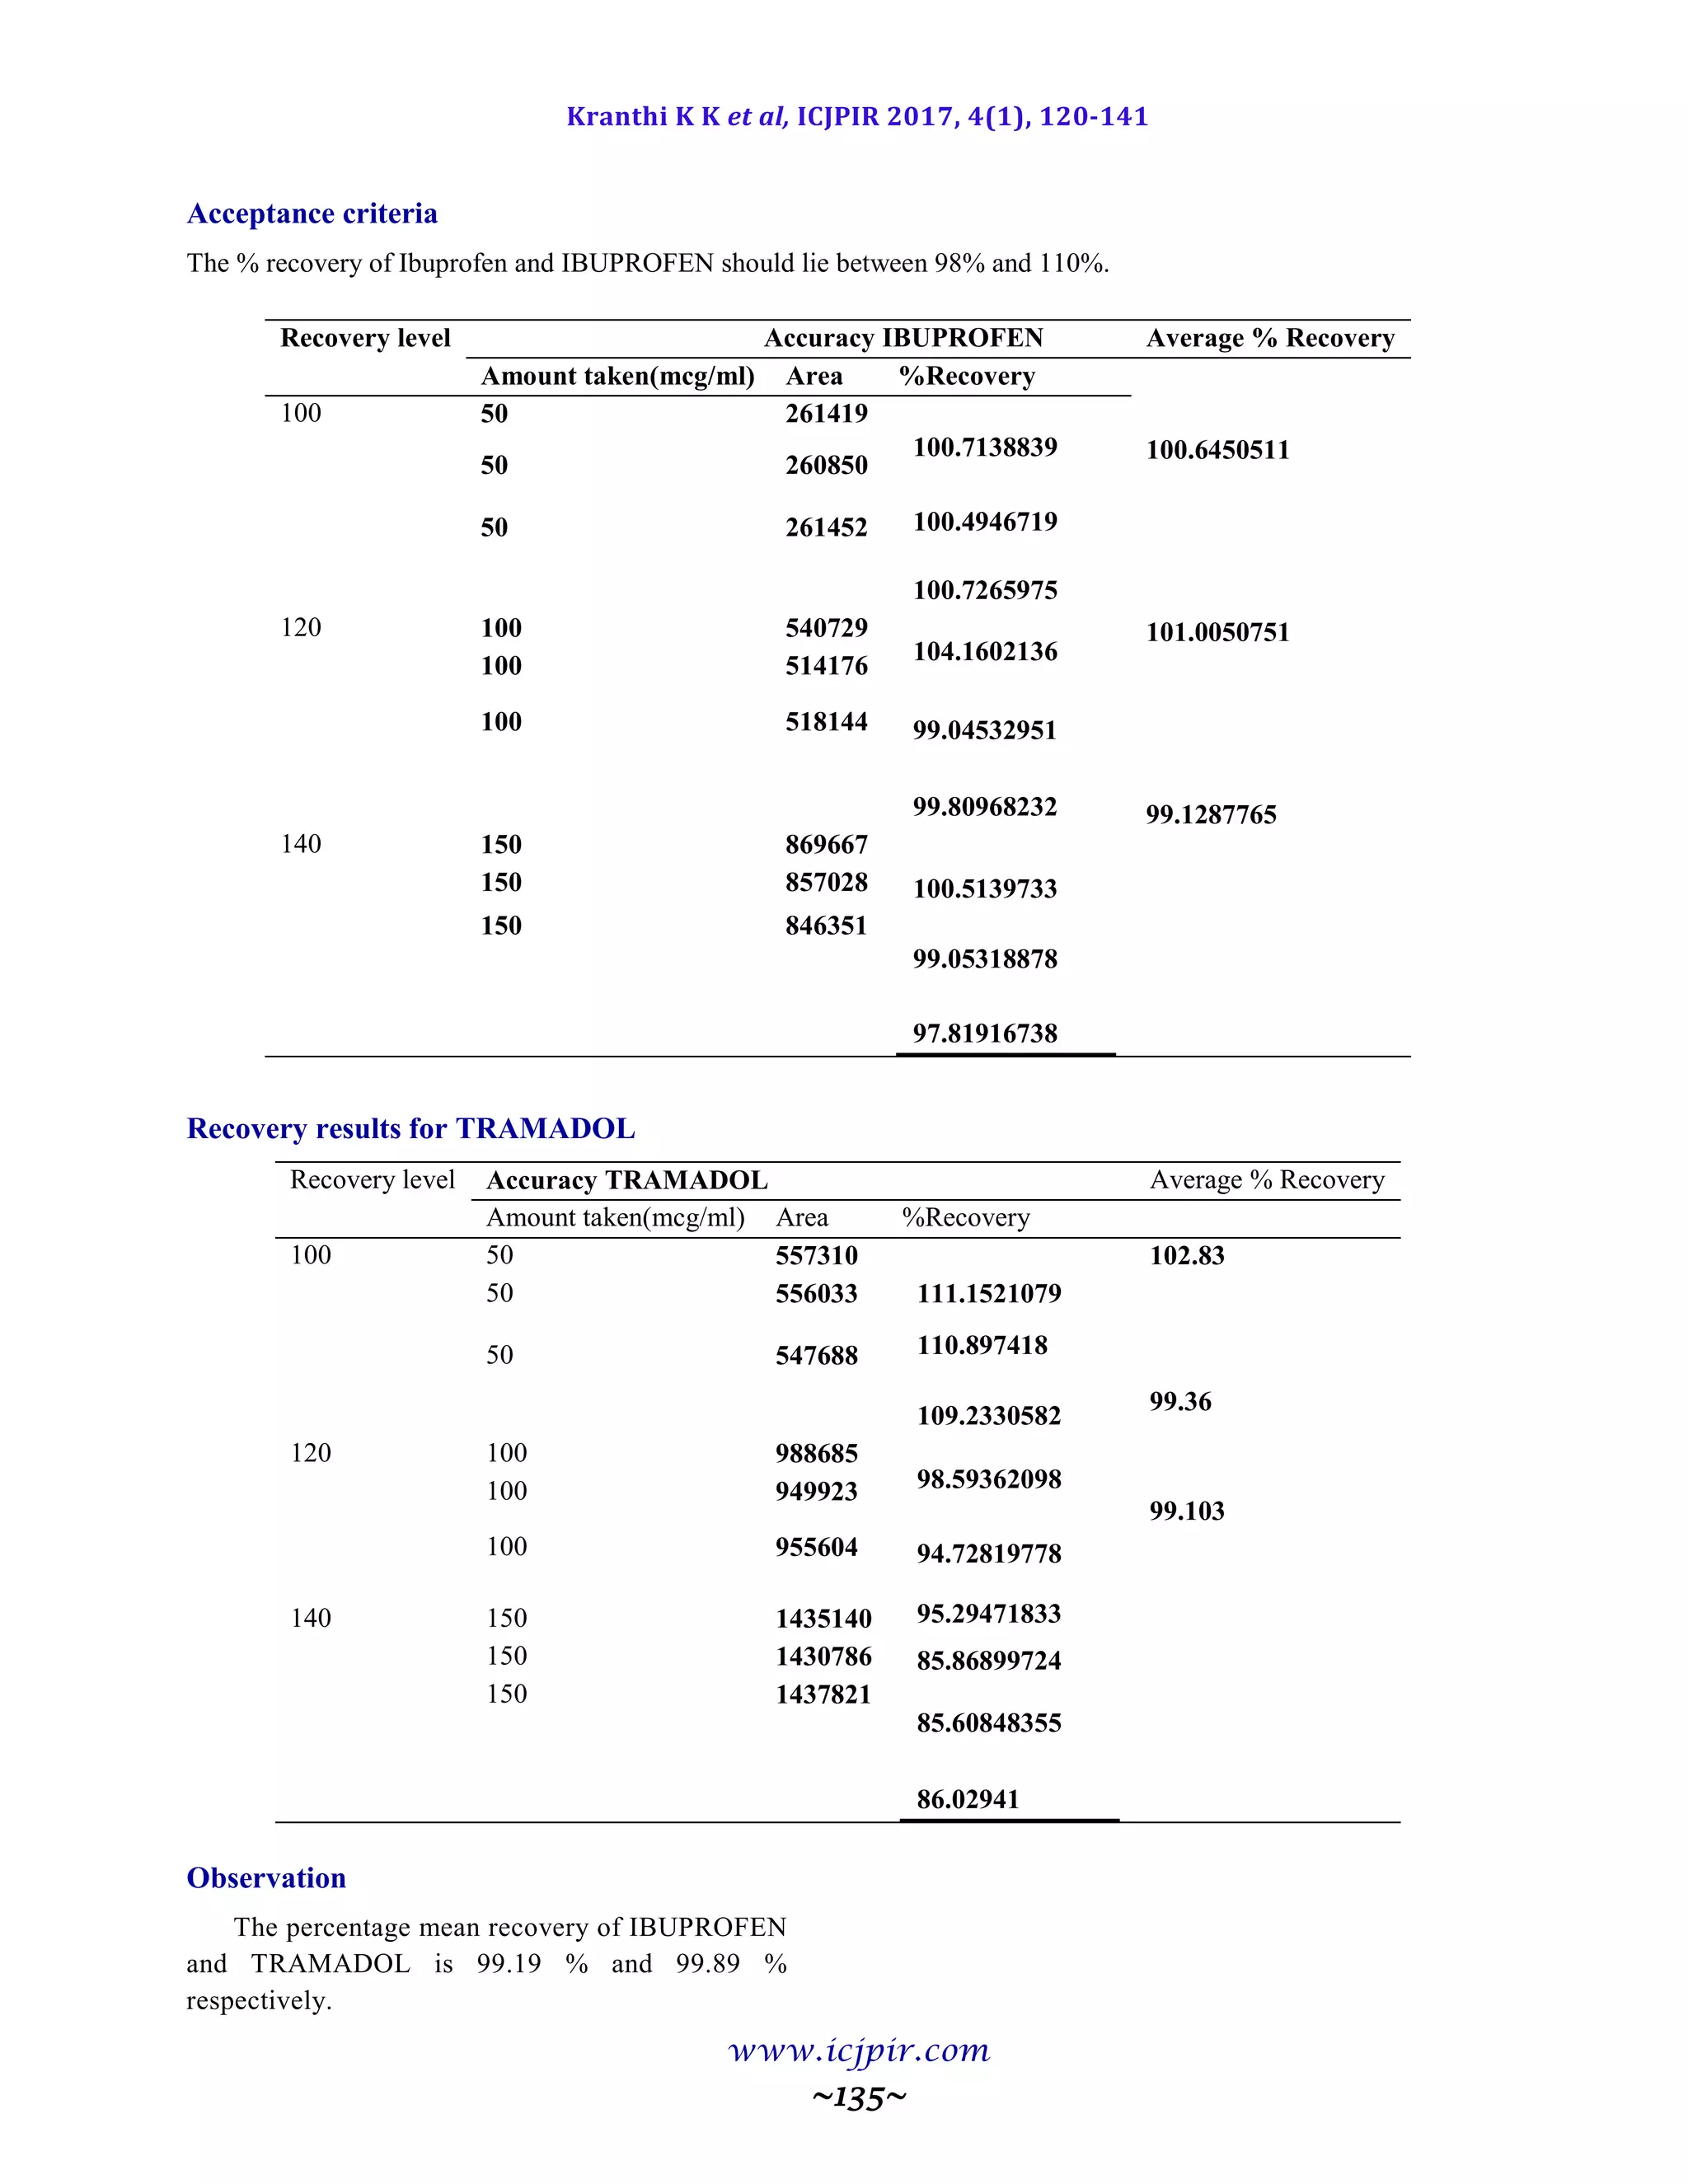
The proposed methods were validated. The accuracy of the methods was assessed by recovery studies at three
different levels. Recovery experiments indicated the absence of interference from commonly encountered
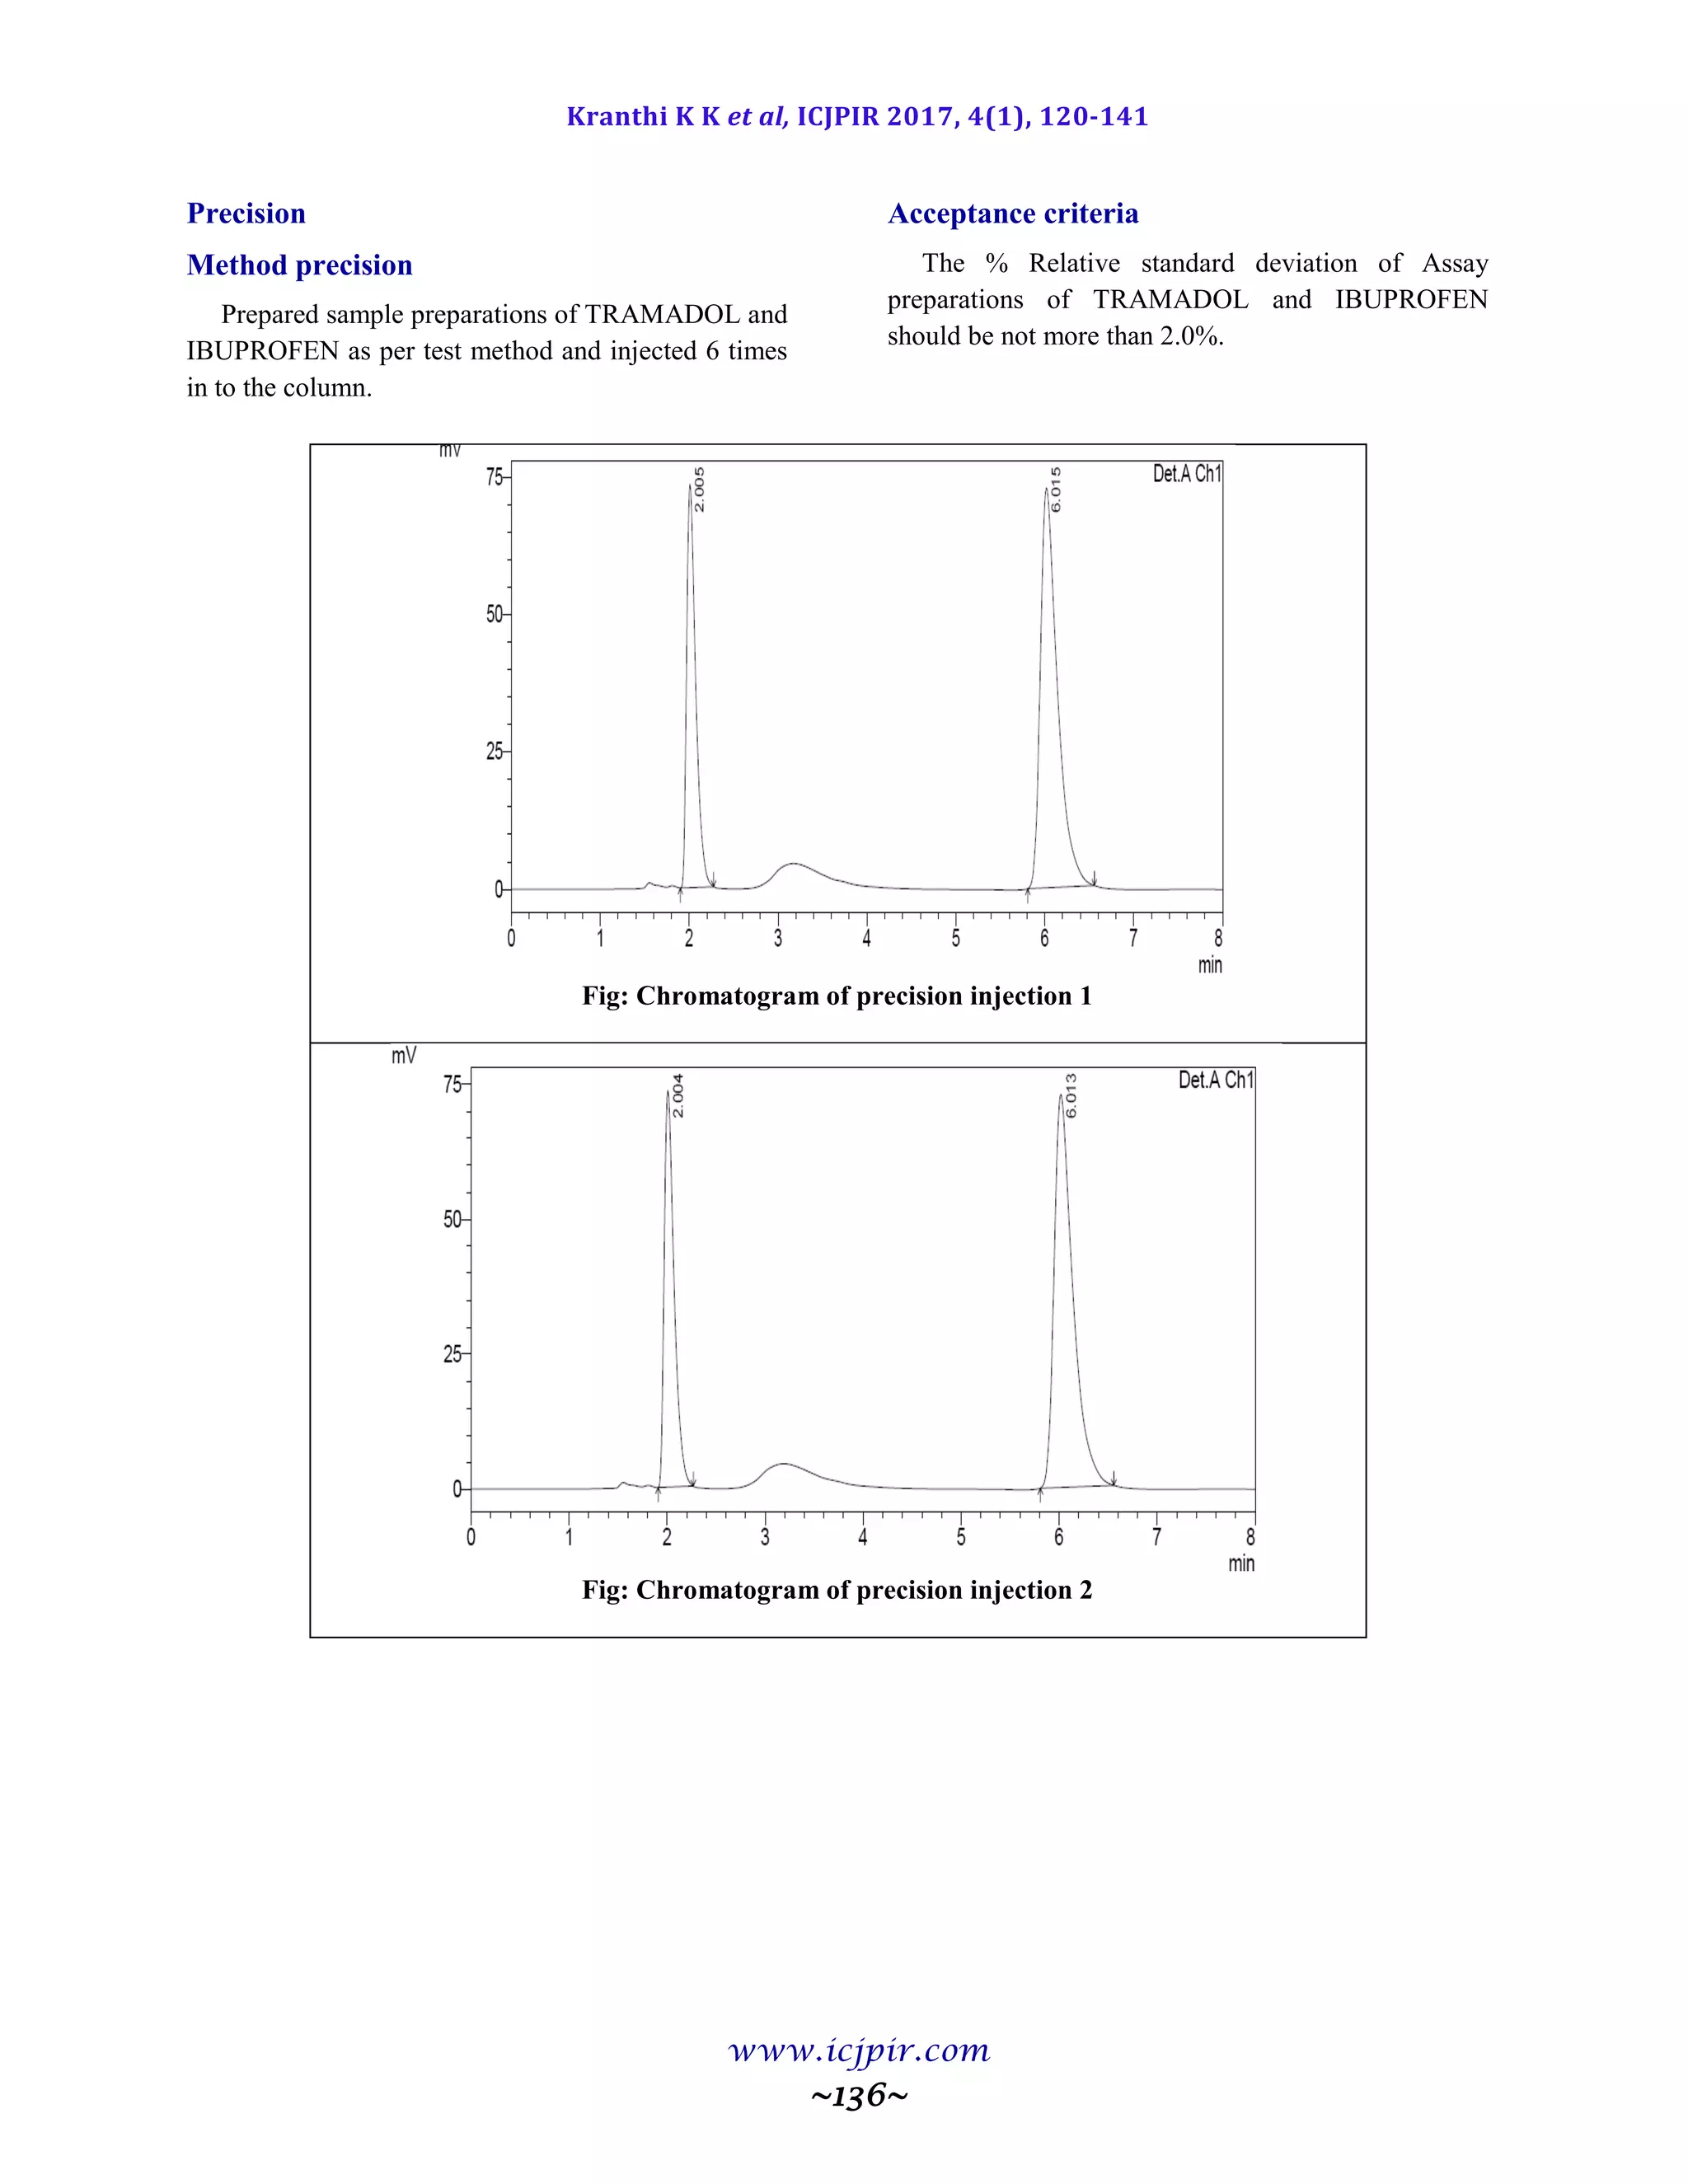
pharmaceutical additives. The method was found to be precise as indicated by the repeatability analysis,
showing %RSD less than 2. All statistical data proves validity of the methods and can be used for routine
analysis of pharmaceutical dosage form.
Keywords: Liquid chromatography (LC), RSD Relative standard deviation, R2
correlation coefficient, Ibuprofen
and tramadol, Reverse phase HPLC.
INTRODUCTION
A drug includes all medicines intended for
internal or external use for or in the diagnosis,
treatment, mitigation or prevention of disease or
disorder in human beings or animals, and
manufactured exclusively in accordance with the
formulae mentioned in authoritative books [1-3].
Pharmaceutical analysis is a branch of
chemistry involving a process of identification,
determination [4-6], quantification, purification and
separation of components in a mixture or
determination of chemical structure of compounds.
There are two main types of analysis – Qualitative
and Quantitative analysis. Qualitative analysis is
performed to establish composition of a substance.](https://image.slidesharecdn.com/icjpir-17-108120-141-191217111818/75/A-new-analytical-method-development-and-validation-for-the-simultaneus-estimation-of-ibuprofen-and-tramadol-using-RP-HPLC-1-2048.jpg)
![Kranthi K K et al, ICJPIR 2017, 4(1), 120-141
www.icjpir.com
~121~
It is done to determine the presence of a compound
or substance in a given sample or not. The various
qualitative tests are detection of evolved gas, limit
tests, color change reactions, determination of
melting point and boiling point, mass spectroscopy,
determination of nuclear half-life etc. [7-10].
AIM AND PLAN OF WORK
Aim
To develop new RP HPLC method for the
simultaneous estimation of Ibuprofen and Tramadol
pharmaceutical dosage form.
PLAN OF WORK
Solubility determination of Ibuprofen and Tramadol
various solvents and buffers.
Determine the absorption maxima of both the
drugs in UV–Visible region in different
solvents/buffers and selecting the solvents for
HPLC method development.
Optimize the mobile phase and flow rates for
proper resolution and retention times.
Validate the developed method as per ICH
guidelines.
METHODOLOGY
A mixture of Triethylamine buffer (pH): ACN
were prepared. The mobile phase was sonicated for
10min to remove gases and filtered through 0.45µ
membrane filter for degassing of mobile phase.
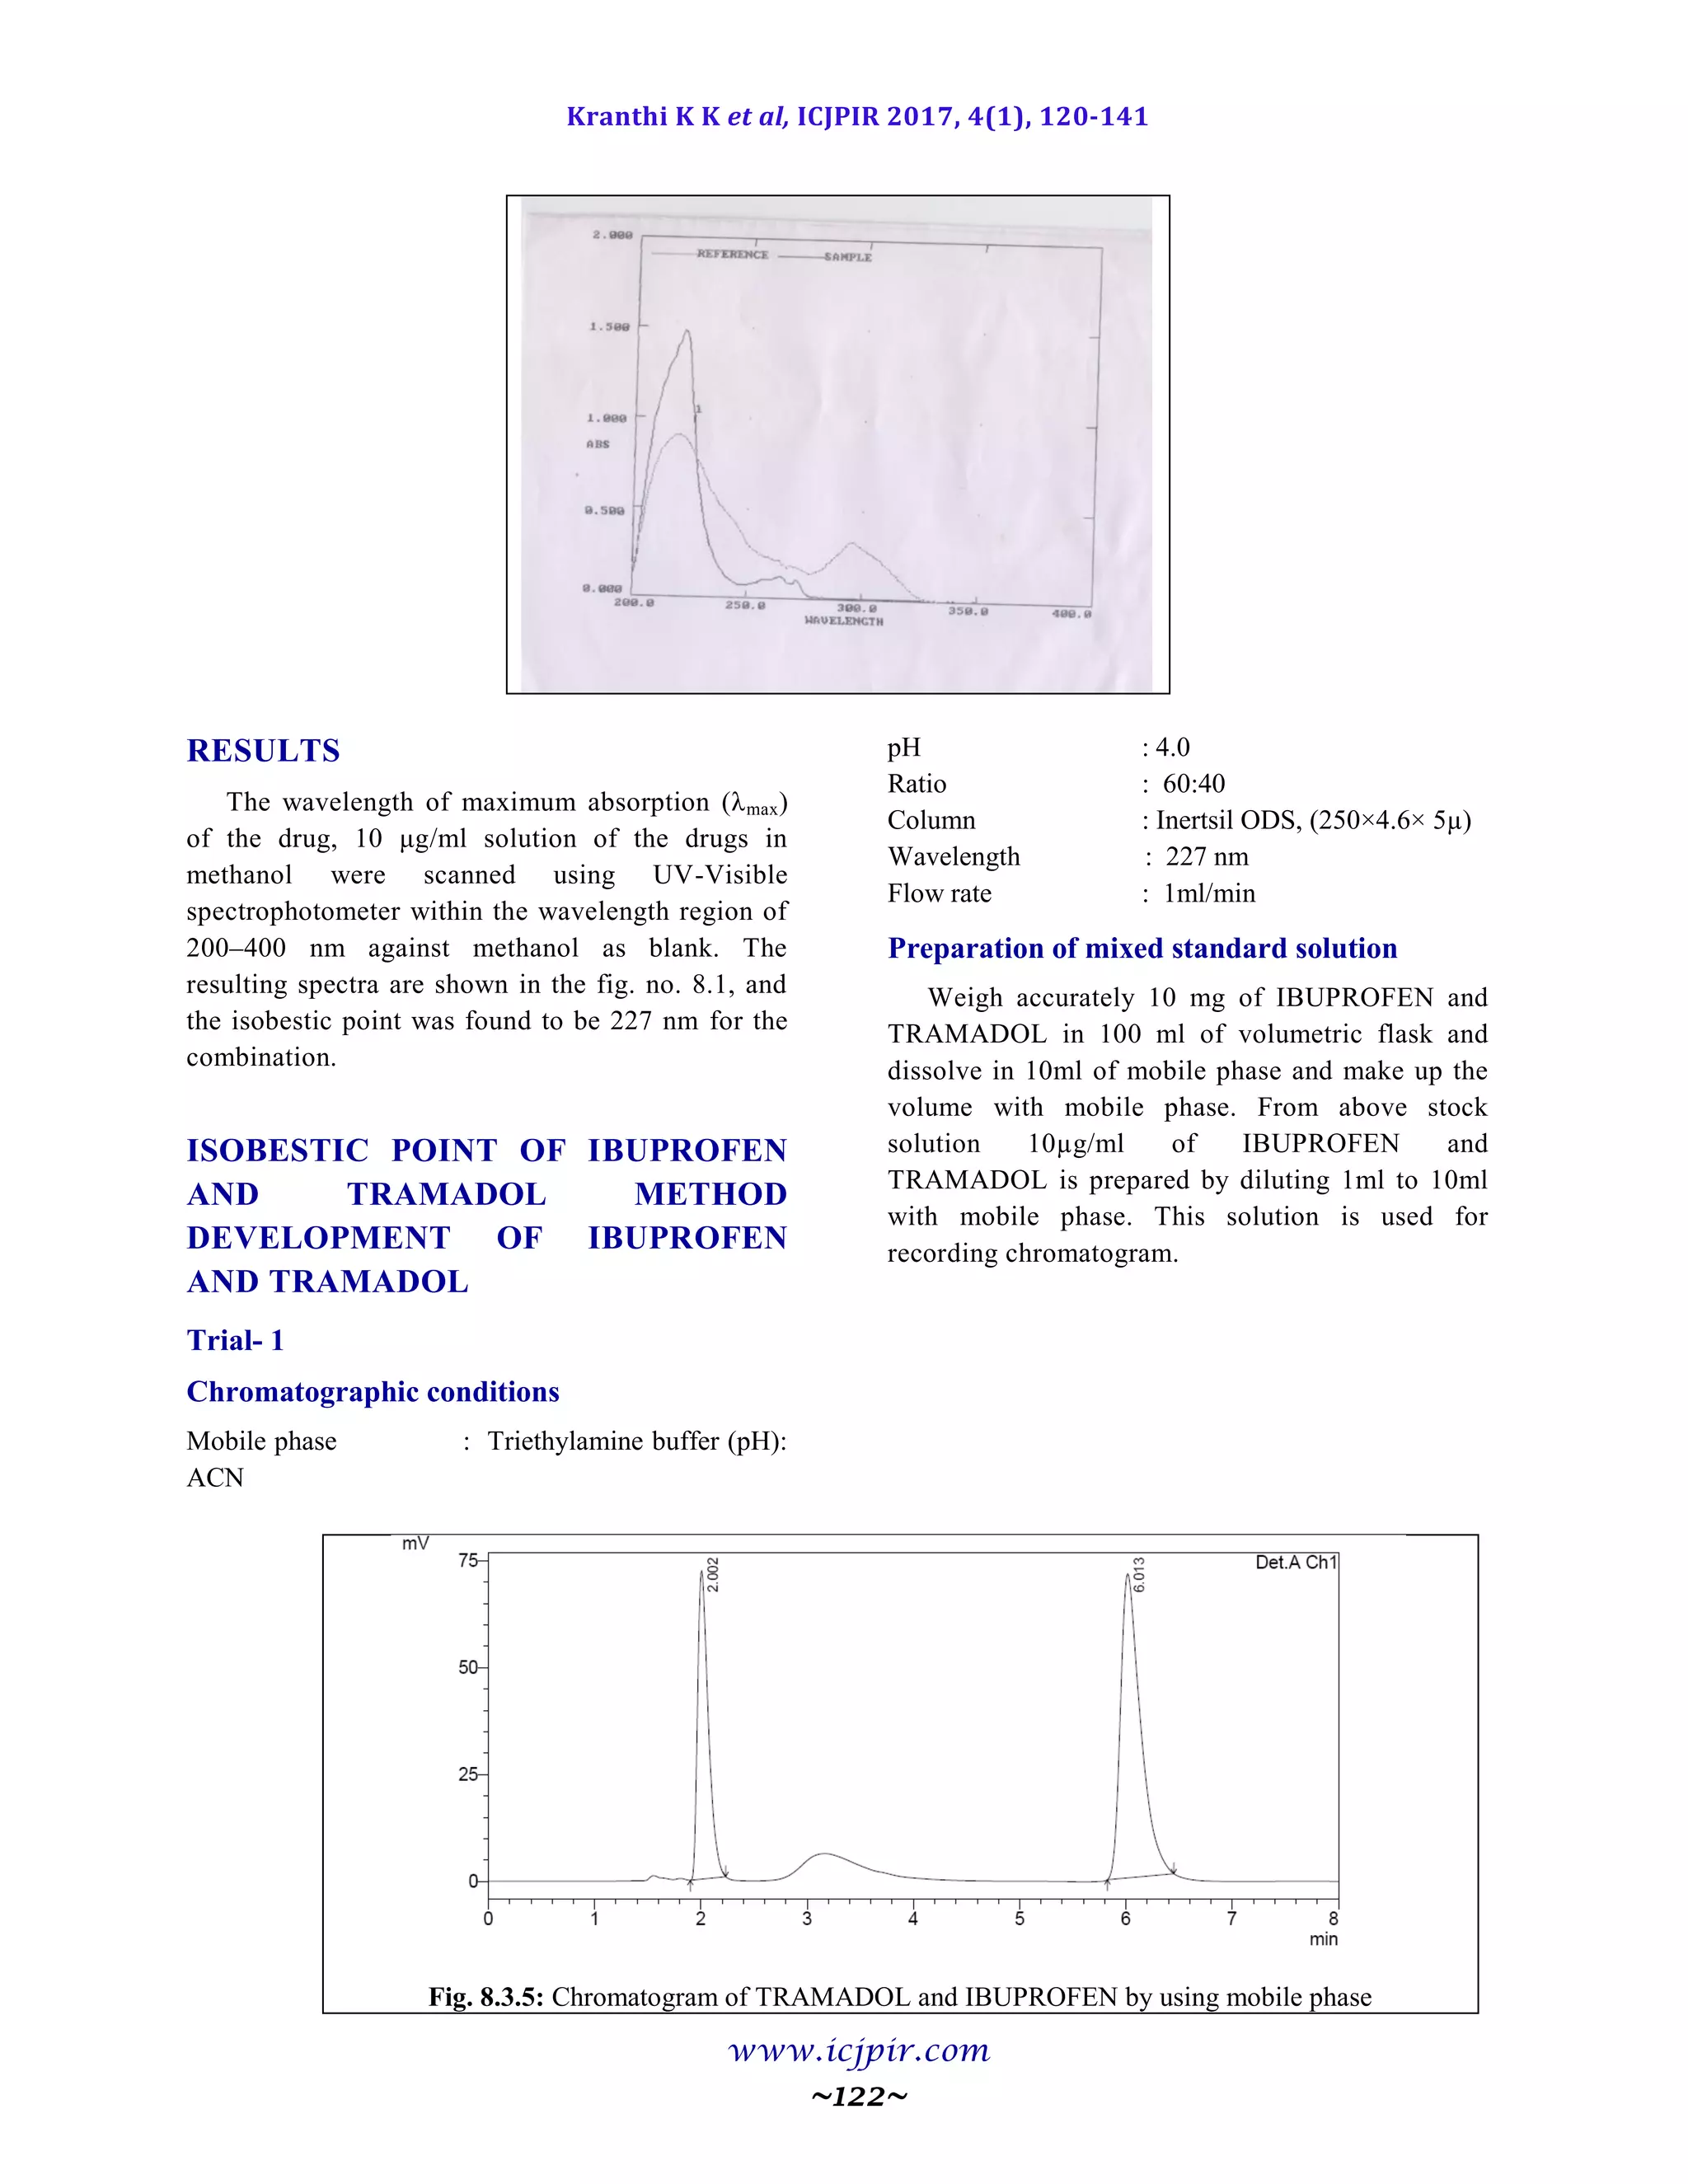
Determination of Working Wavelength
(λmax)
In estimation of drug wavelength maxima is
used.. So this wavelength is used in estimation to
estimate drug accurately.
Determination Of Working Wavelength
(λmax)
In simultaneous estimation of two drugs
isobestic wavelength is used. Isobestic point is the
wavelength where the molar absorptivity is the
same for two substances that are interconvertible.
So this wavelength is used in simultaneous
estimation to estimate both drugs accurately.
Preparation of standard stock solution of
IBUPROFEN
100 mg of IBUPROFEN was weighed and
transferred in to 100ml volumetric flask and
dissolved in water and then make up to the mark
with water and prepare 100 µg /ml of solution by
diluting 1ml to 10ml with water.
Preparation of standard stock solution of
TRAMADOL
100 mg of TRAMADOL was weighed in to
100ml volumetric flask and dissolved in water and
then dilute up to the mark with water and prepare
100 µg /ml of solution by diluting 1ml to 10ml with
water.
RESULTS AND DISCUSSIONS
Solubility Studies
These studies are carried out at 25 0
C
Ibuprofen
Freely soluble in ethanol and methanol, and
slightly soluble in acetone and isopropanol and
very slightly soluble in water.
Tramadol
Freely soluble in methanol and water.](https://image.slidesharecdn.com/icjpir-17-108120-141-191217111818/75/A-new-analytical-method-development-and-validation-for-the-simultaneus-estimation-of-ibuprofen-and-tramadol-using-RP-HPLC-2-2048.jpg)
![Kranthi K K et al, ICJPIR 2017, 4(1), 120-141
www.icjpir.com
~141~
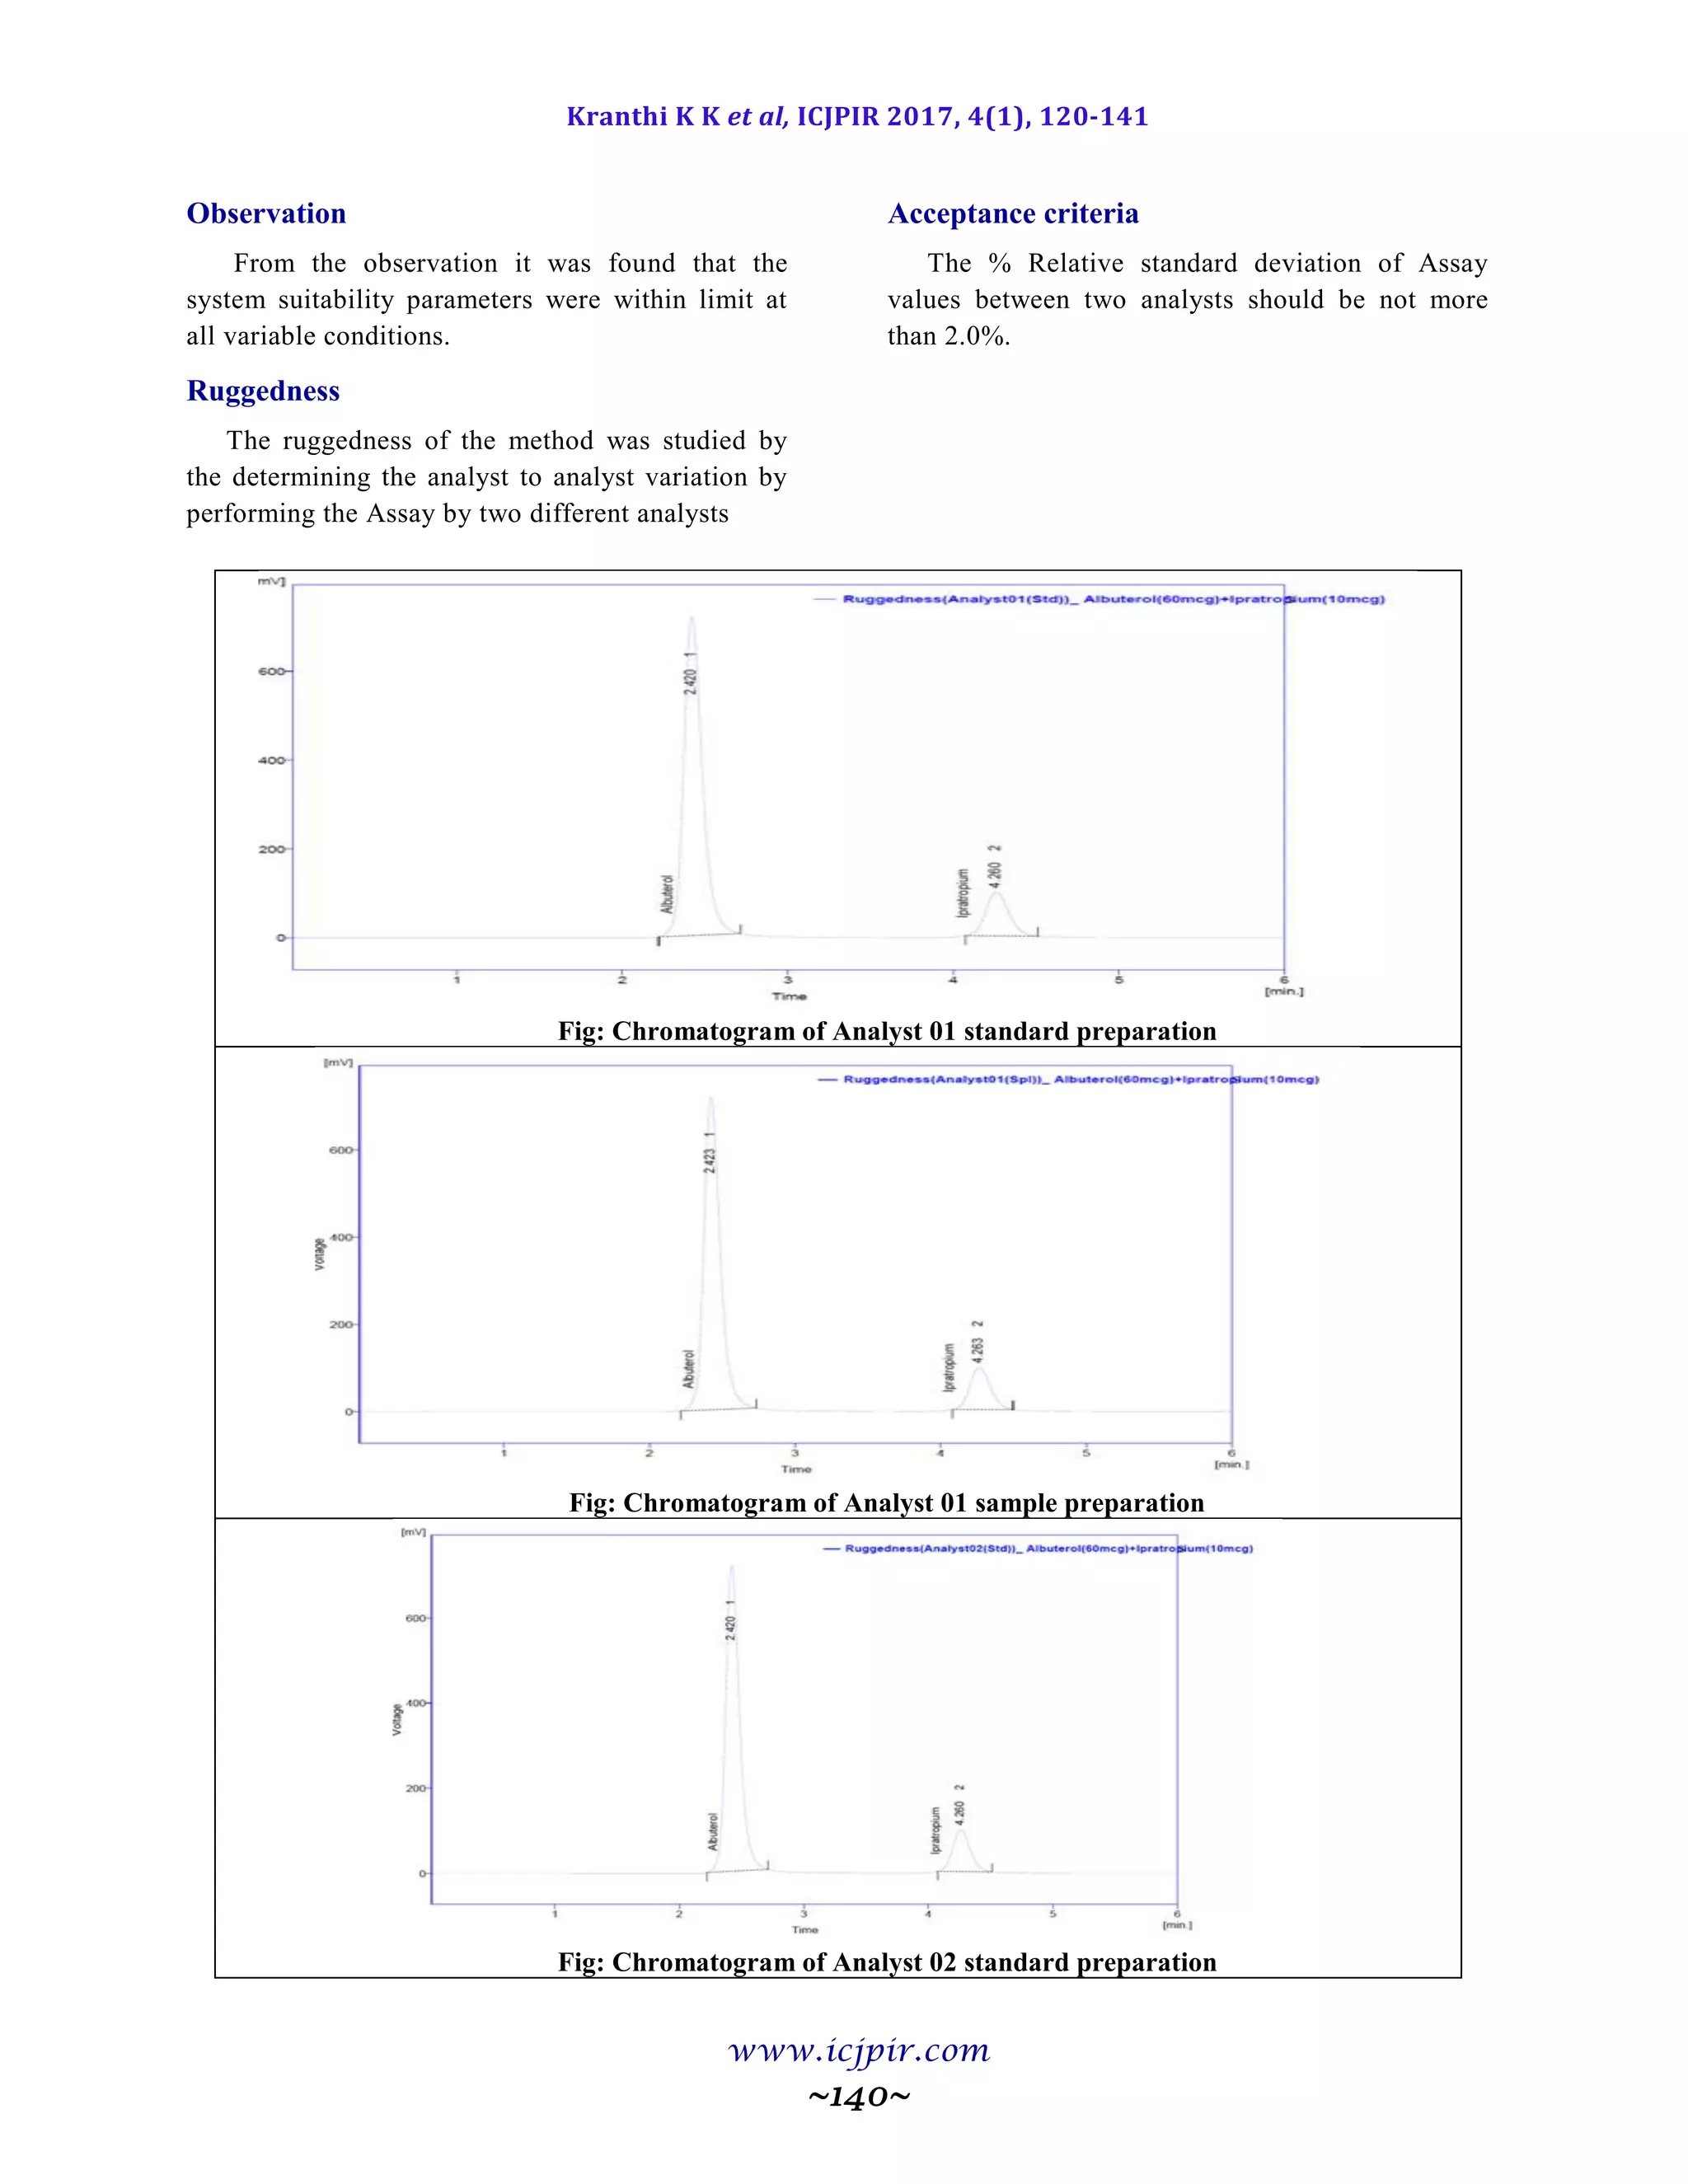
Fig: Chromatogram of Analyst 02 sample preparation
Table 9.9.5: Results for Ruggedness
IBUPROFEN %Assay IBUPROFEN BROMIDE %Assay
Analyst 01 100.53 Analyst 01 98.65
Anaylst 02 100.40 Anaylst 02 100.41
Observation
From the observation the %RSD between two analysts Assay values not greater than 2.0%, hence the
method was rugged.
BIBLIOGRAPHY
[1]. B.K.Sharma, HPLC, Instrumental methods of chemical analysis, Goel publishers; 24, 2005, 286-300.
[2]. Gurudeep.R. Chatwal, Sharm.K. Anand, HPLC, Instrumental methods of chemical analysis; 2010, 624-639.
[3]. ICH, Text on Validation of Analytical Procedures, ICH – Q2A, International Conference on Harmonisation,
IFPMA, Geneva, 2-3, 1995 1 to 3.
[4]. ICH, Validation of Analytical Procedures Methodology, ICH–Q2B, International Conference on
Harmonisation, 1996, 1-3.
[5]. ICH Guidelines, Q2 (R1) Validation of Analytical Procedures Text and Methodology, 2005, 1-6.
[6]. british pharmacopoeia, 1, 2011, 143-144
[7]. United states pharmacopoeia 34 NF29 , 2(1), 1873-1875,1949-1951
[8]. Indian pharmacopoeia – 2, 2010, 806-807,849-850
[9]. The Merck Index, An Encyclopedia of Chemical, Drugs and Biologicals, Maryadele J.O. Neil.Eds, Published
by Merck Research Lab, Division of Merck and co. Inc., Whitehouse Station, NJ: 13, 2006, 148. NJ: 2006:86.
[10]. Detectors – http://lipidlibrary.aocs.org/topics/detect92/file.pdf](https://image.slidesharecdn.com/icjpir-17-108120-141-191217111818/75/A-new-analytical-method-development-and-validation-for-the-simultaneus-estimation-of-ibuprofen-and-tramadol-using-RP-HPLC-22-2048.jpg)