The document presents an analytical method for the simultaneous estimation of aspirin and omeprazole in tablet dosage forms using reverse phase high-performance liquid chromatography (RP-HPLC). It outlines the method's development, validation, and results, showing good accuracy and precision, with recoveries indicating no interference from common additives. The findings confirm the method's effectiveness for routine pharmaceutical analysis, achieving linearity and validation standards as per ICH guidelines.
![Kranthi K K et al, ICJPIR 2017, 4(1), 044-071
www.icjpir.com
~44~
Available online at www.icjpir.com ISSN: 2349-5448
Intercontinental journal of pharmaceutical
Investigations and Research
ICJPIR |Volume 4 | Issue 1 | Jan – Mar- 2017 Research Article
Analytical method development and validation for the estimation of
aspirin and omeprazole using RP-HPLC method
K.Kranthi Kiran, D.Supriya, D.Divya, D.Rani, G.Neelima Munni
Associate Professor & Jogaiah Institute of Technology & Sciences College of Pharmacy,
Kalagampudi. A.P India
Corresponding Author: K.Kranthi Kiran
Email: kothapallikranthikiran@gmail.com
ABSTRACT
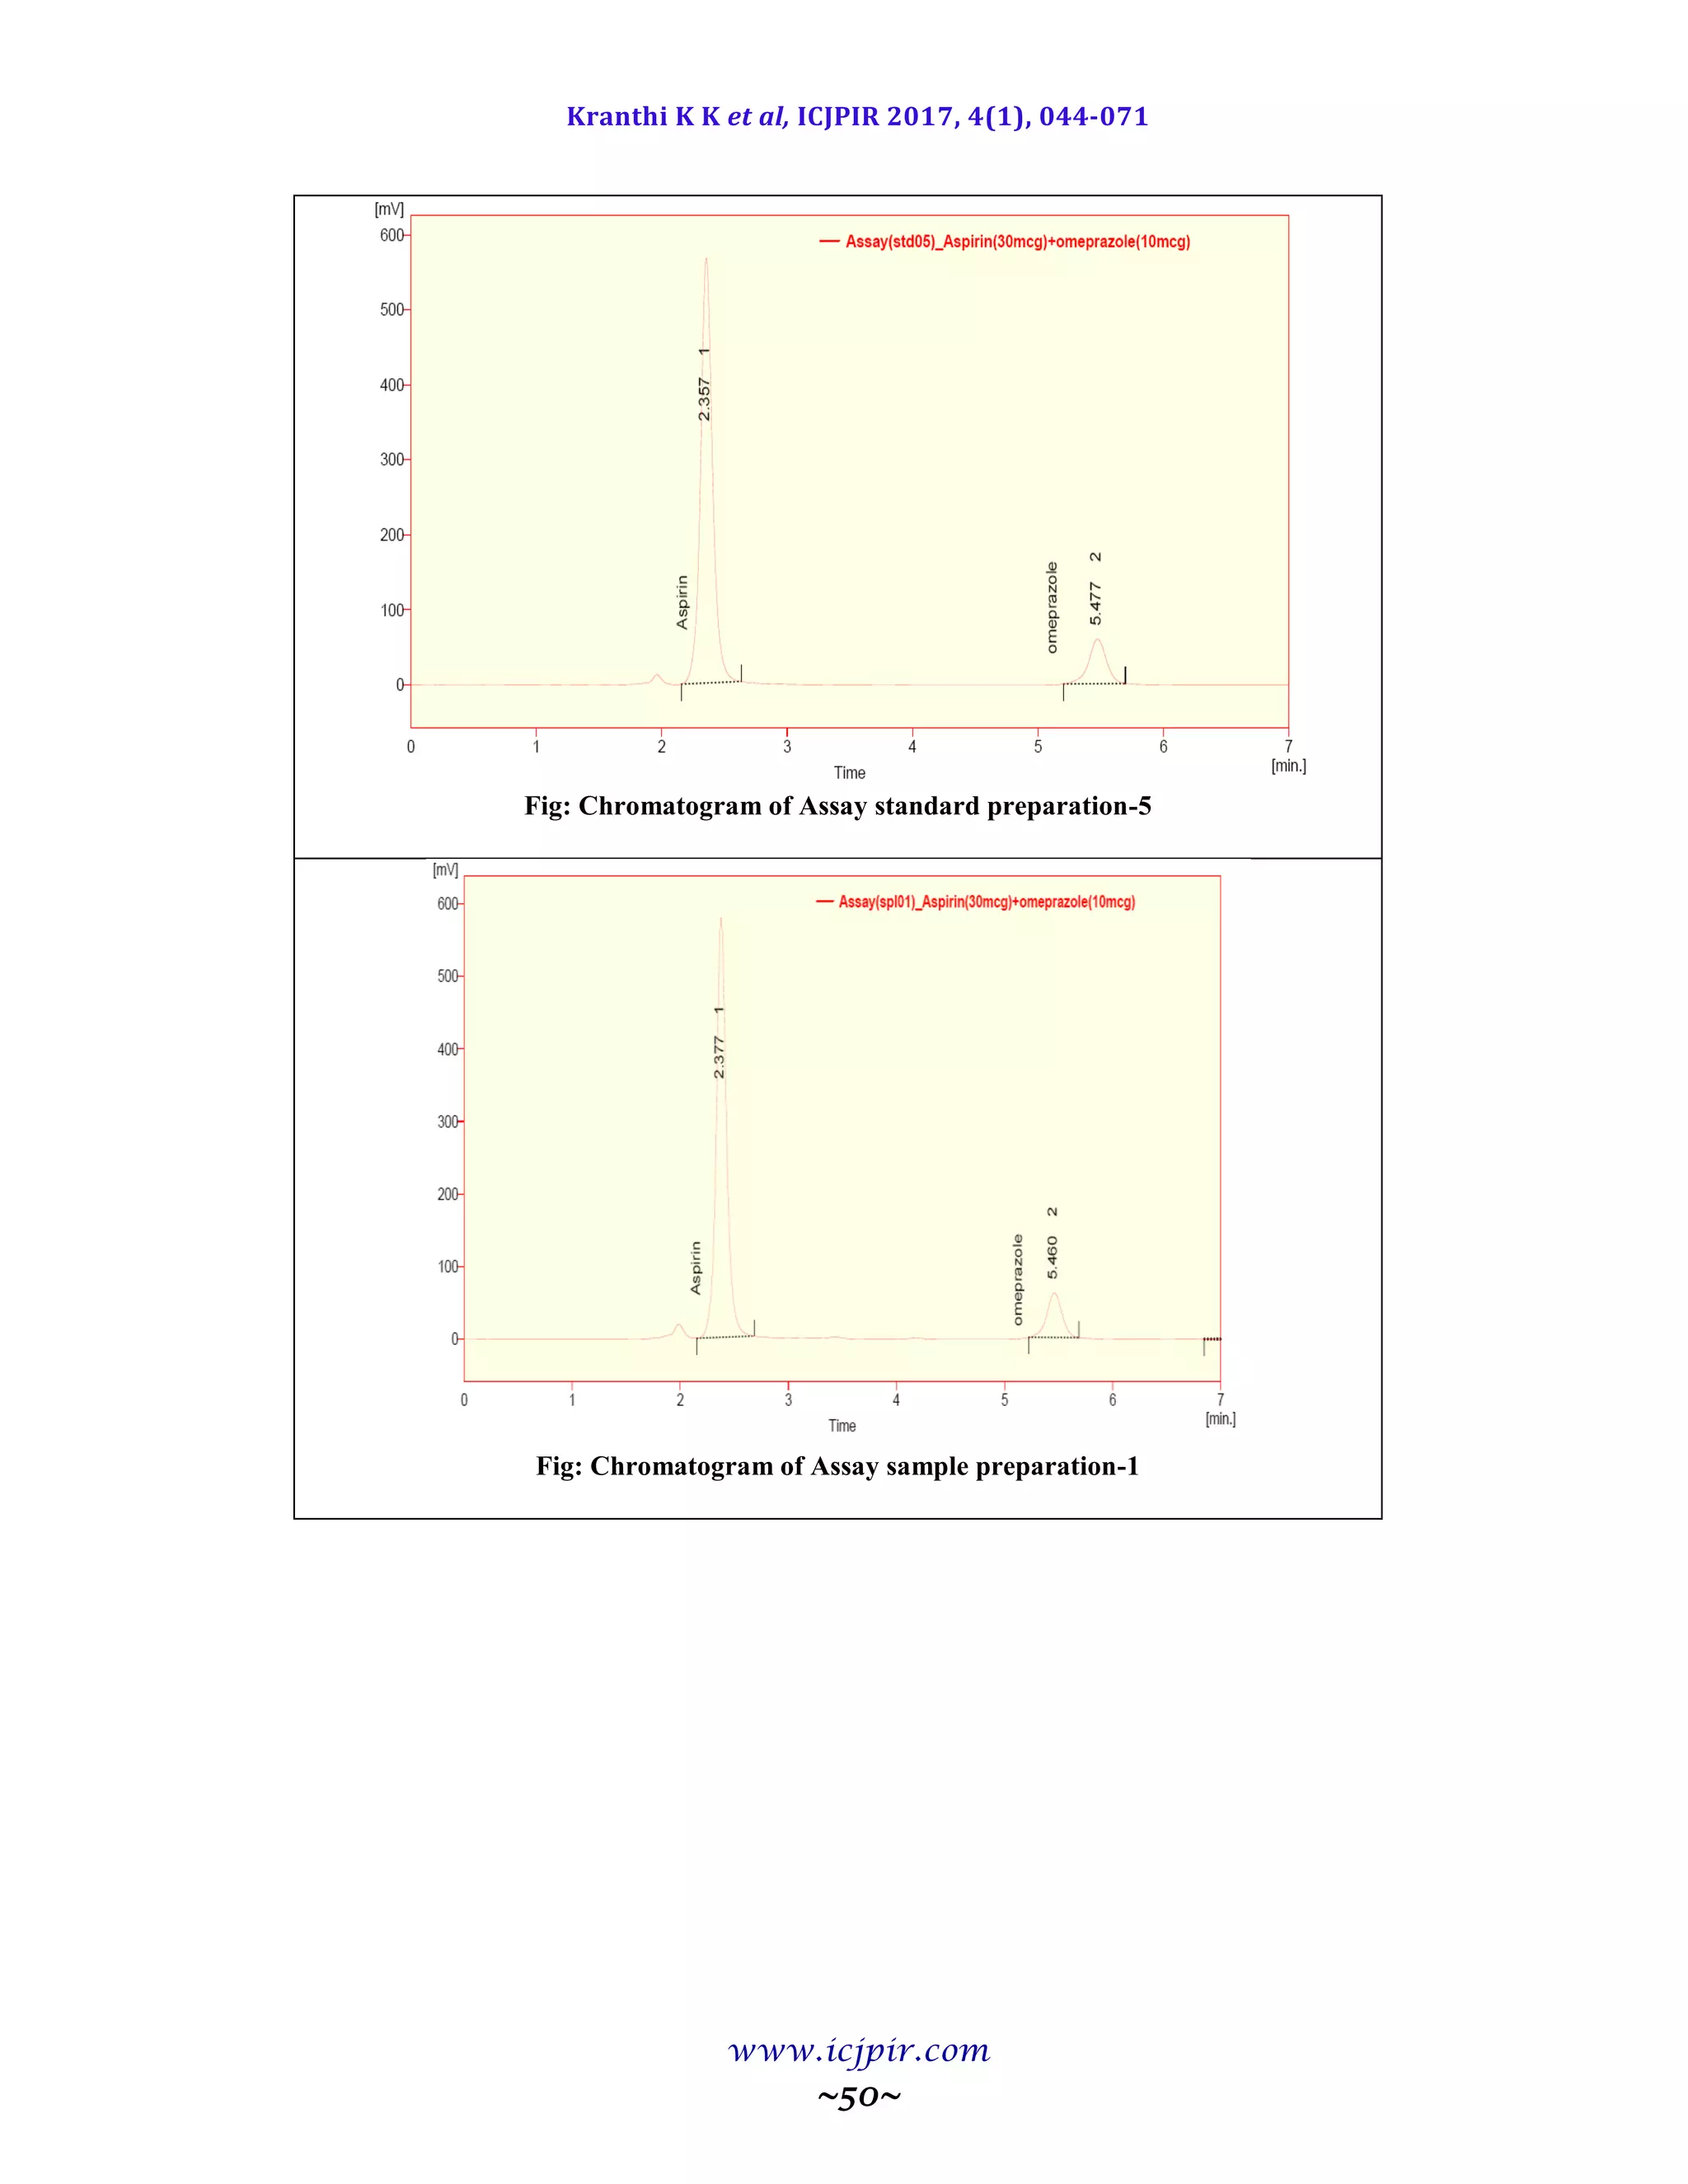
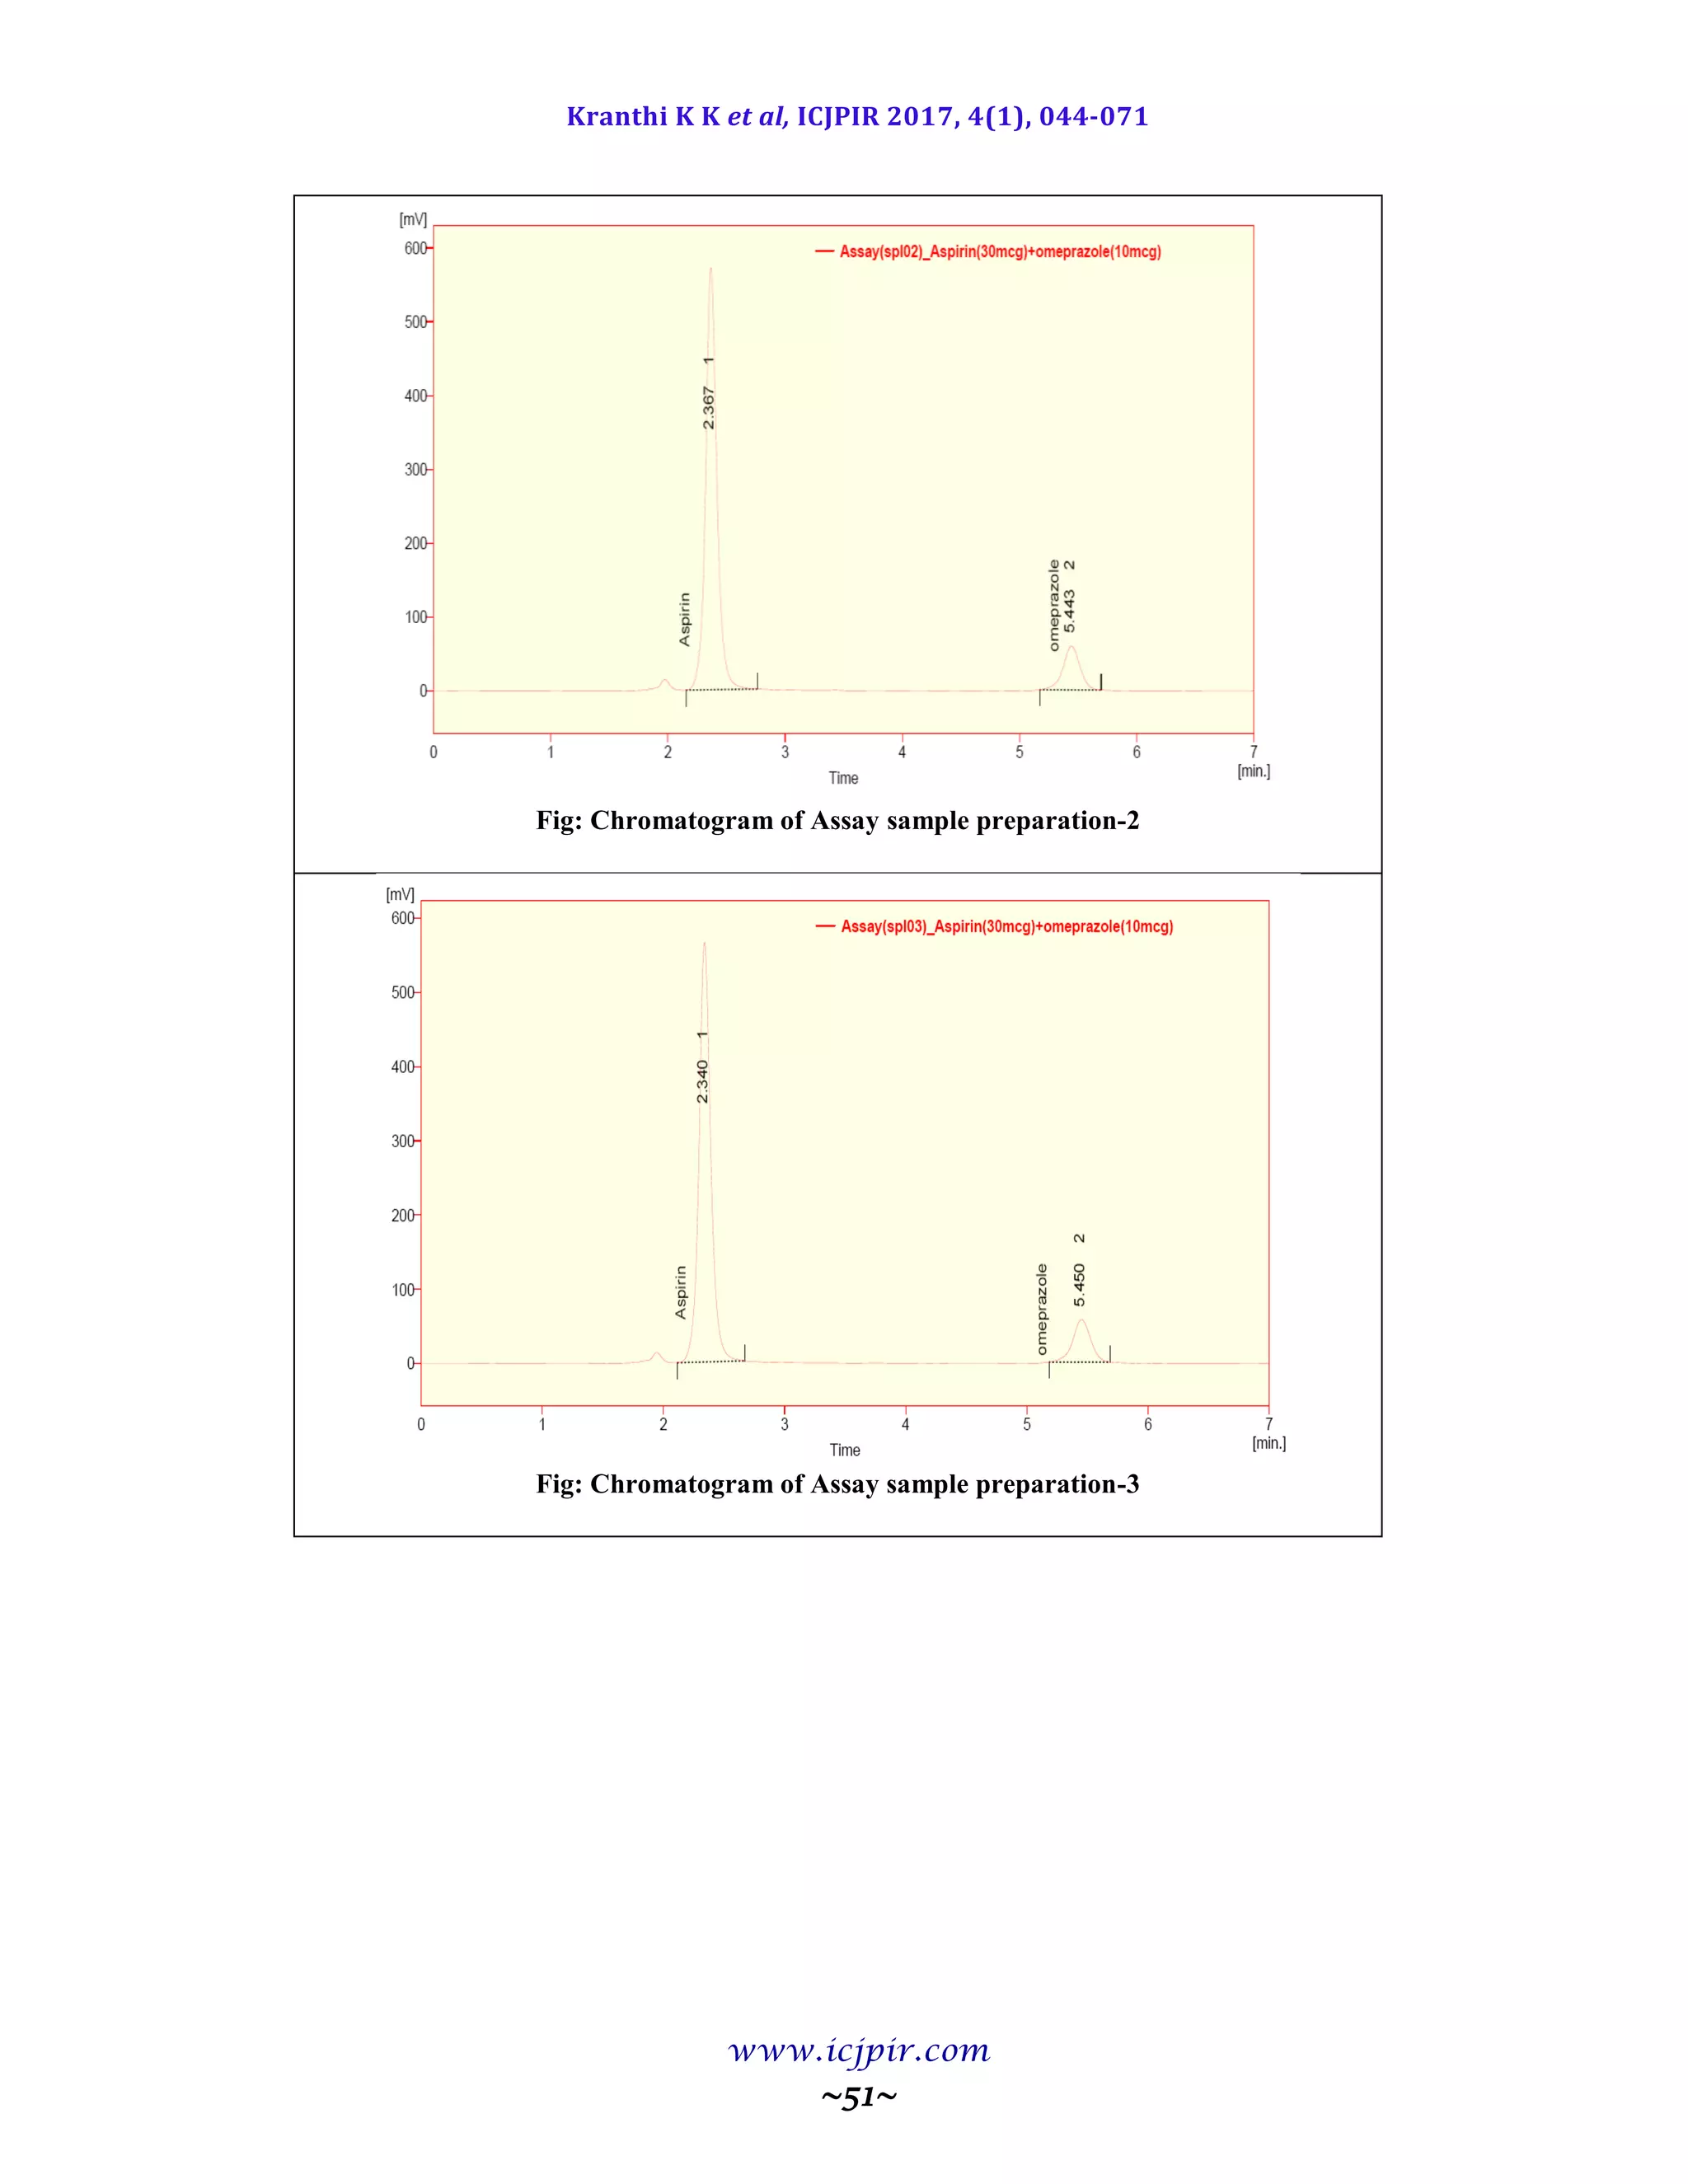
A simple and selective LC method is described for the determination of Aspirin and Omeprazole in tablet dosage
forms. Chromatographic separation was achieved on a c18 column using mobile phase consisting of a mixture of 30
volumes of ammonium acetate buffer, 40 volumes of acetonitrile and 30 volumes of Methanol with detection of 233
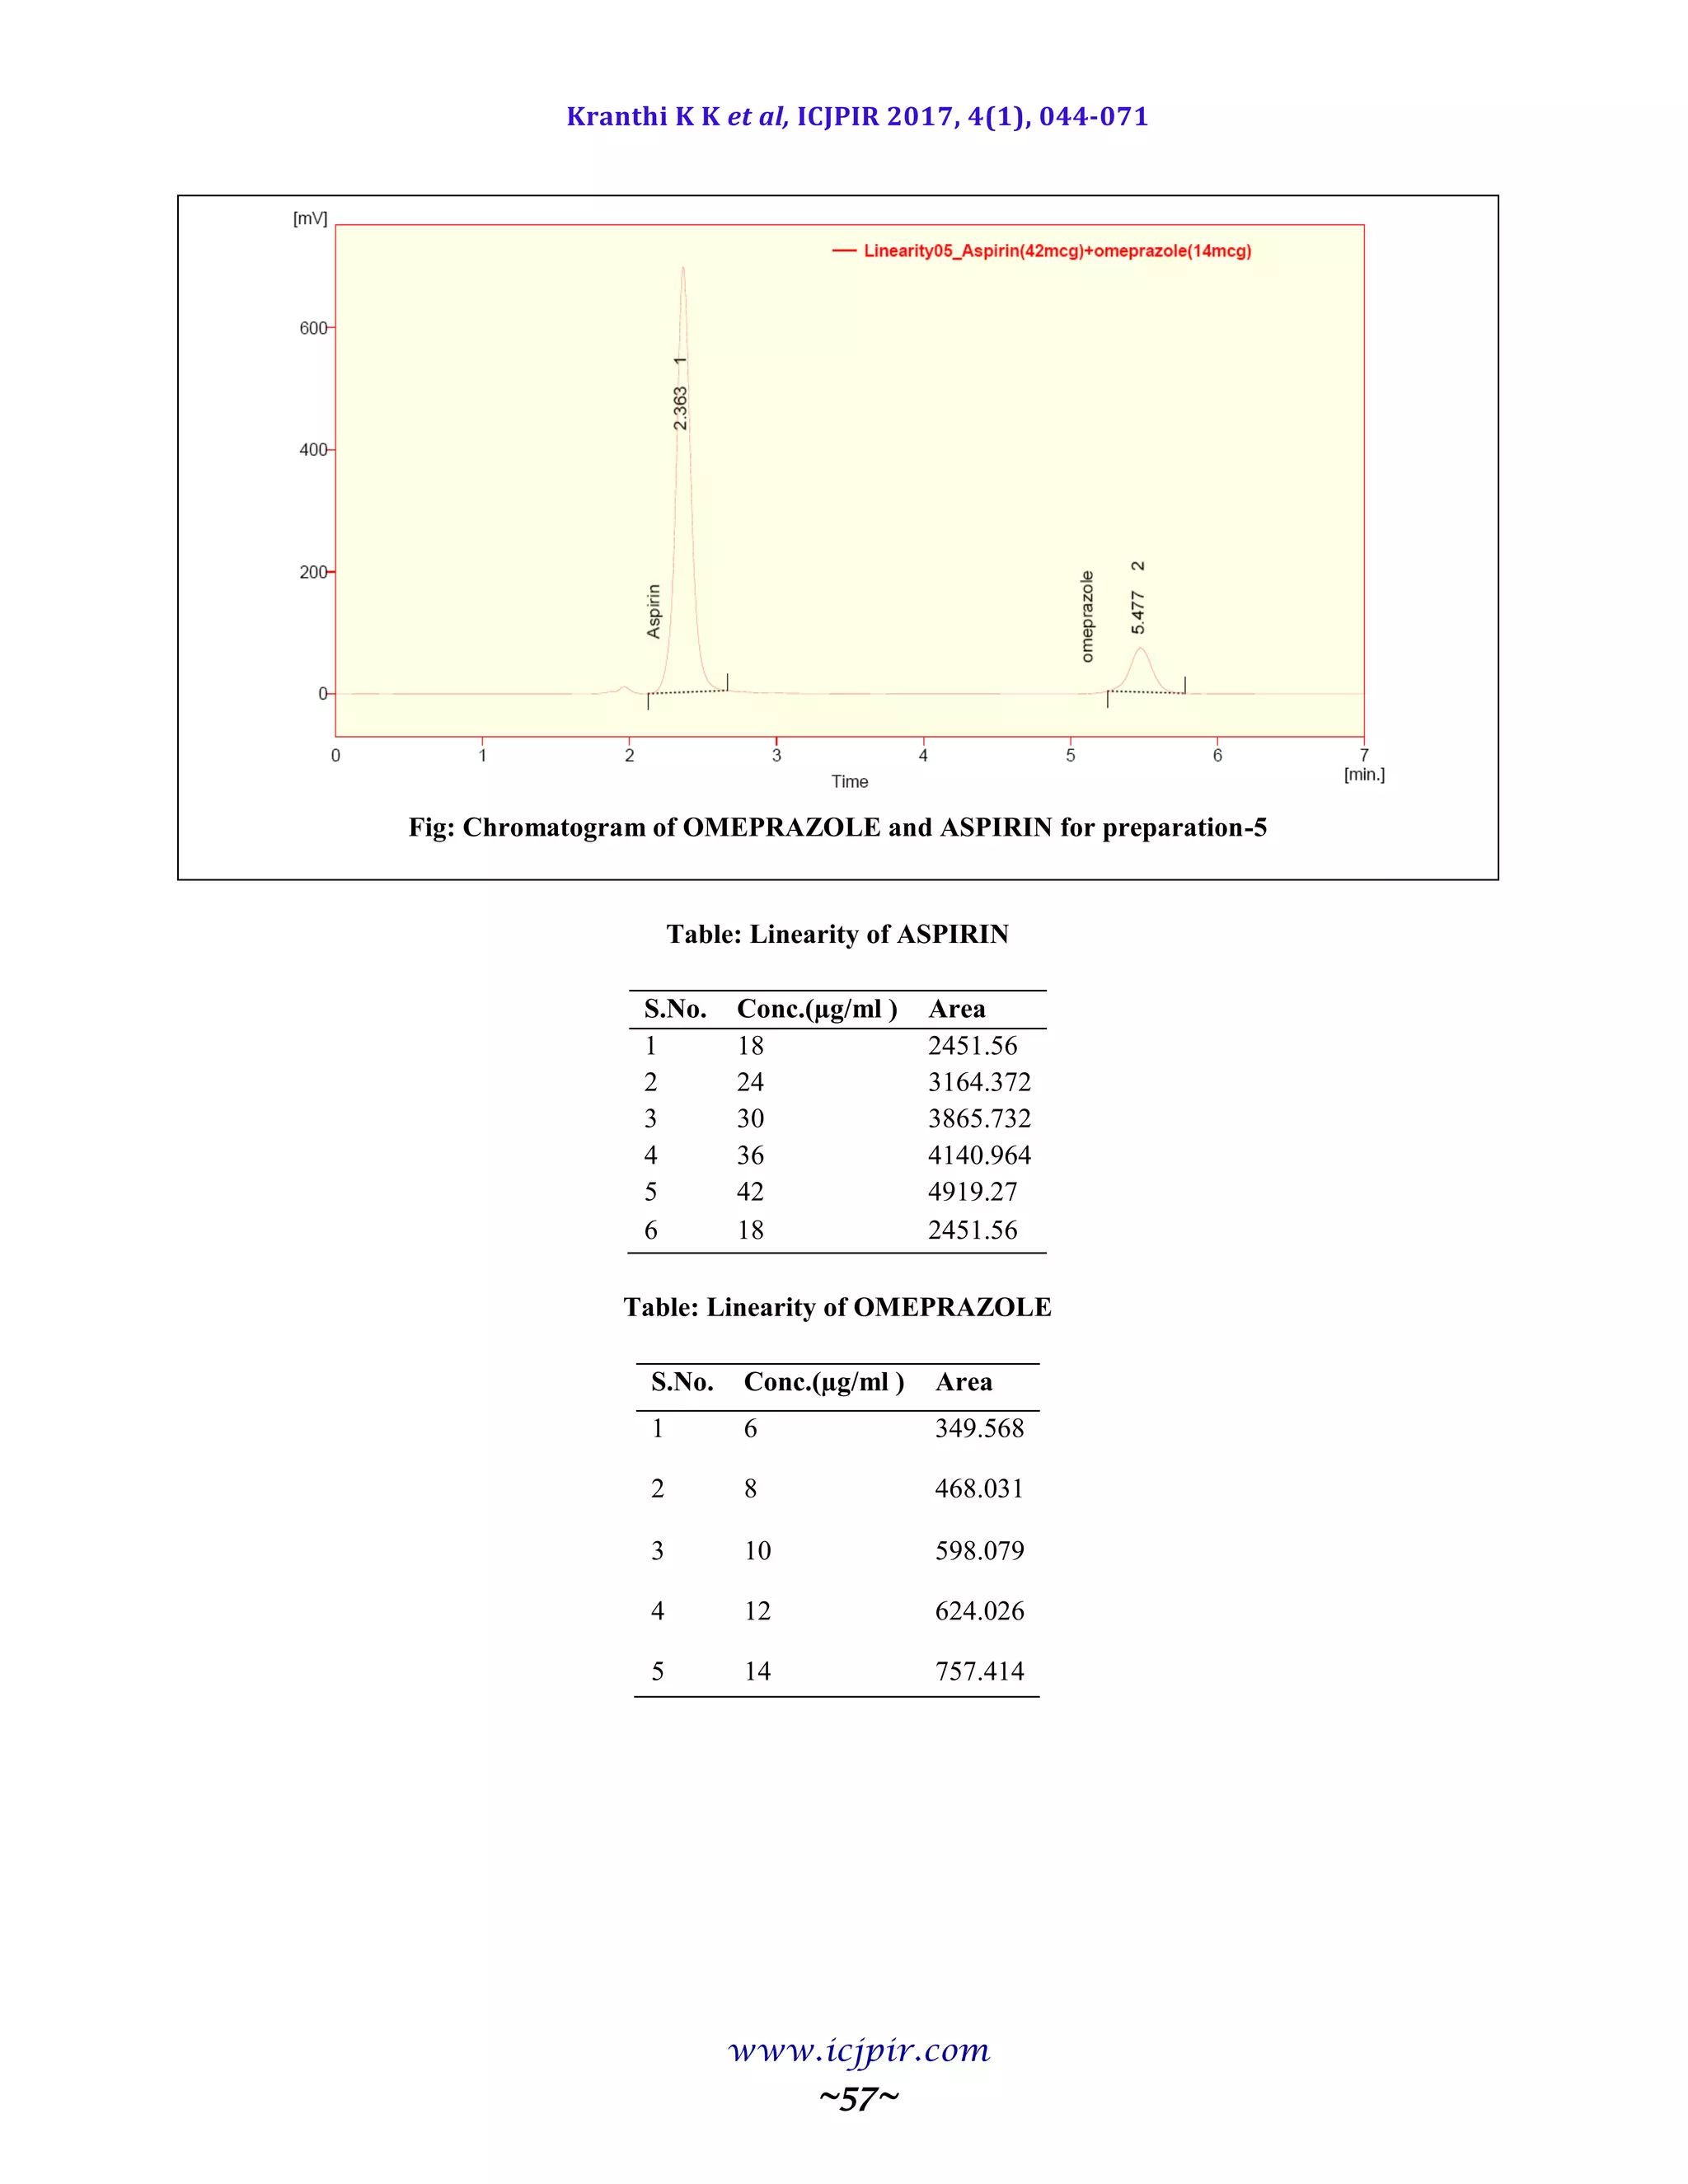
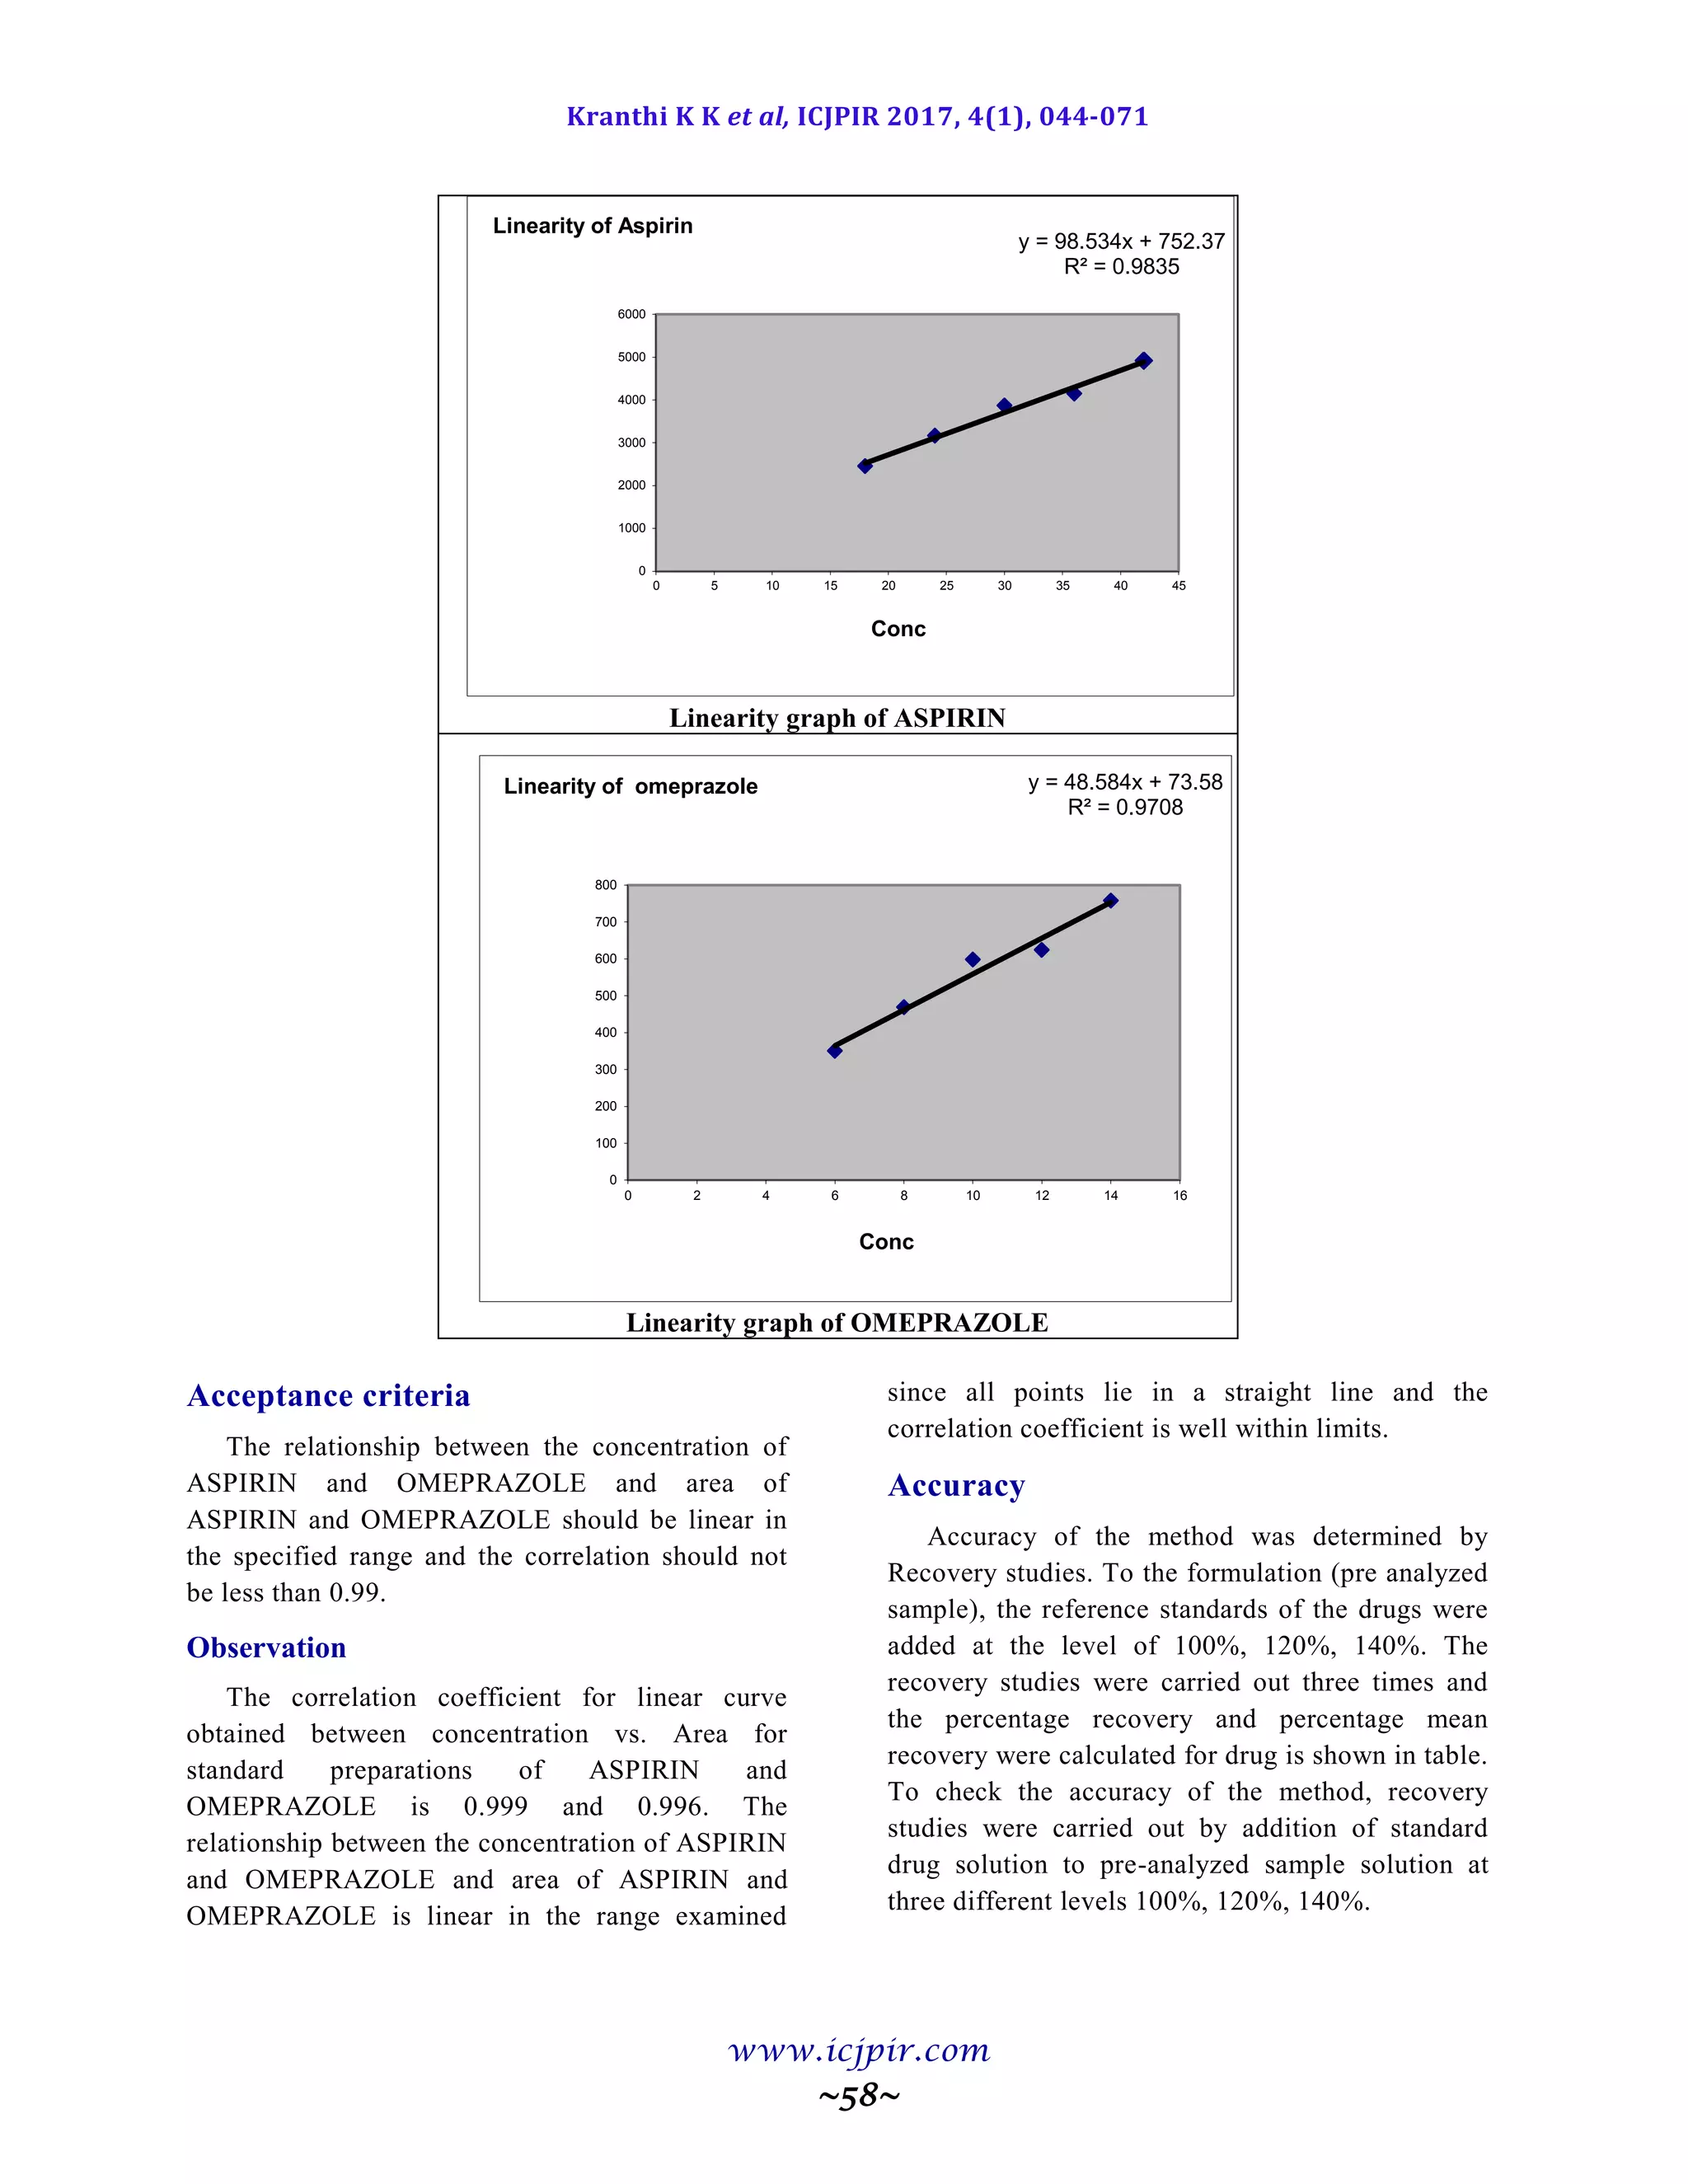
nm. Linearity was observed in the range 18-42 µg/ml for Aspirin (r2
=0.983) and 6-14 µg /ml for Omeprazole (r2
=0.970) for the amount of drugs estimated by the proposed methods was in good agreement with the label claim.
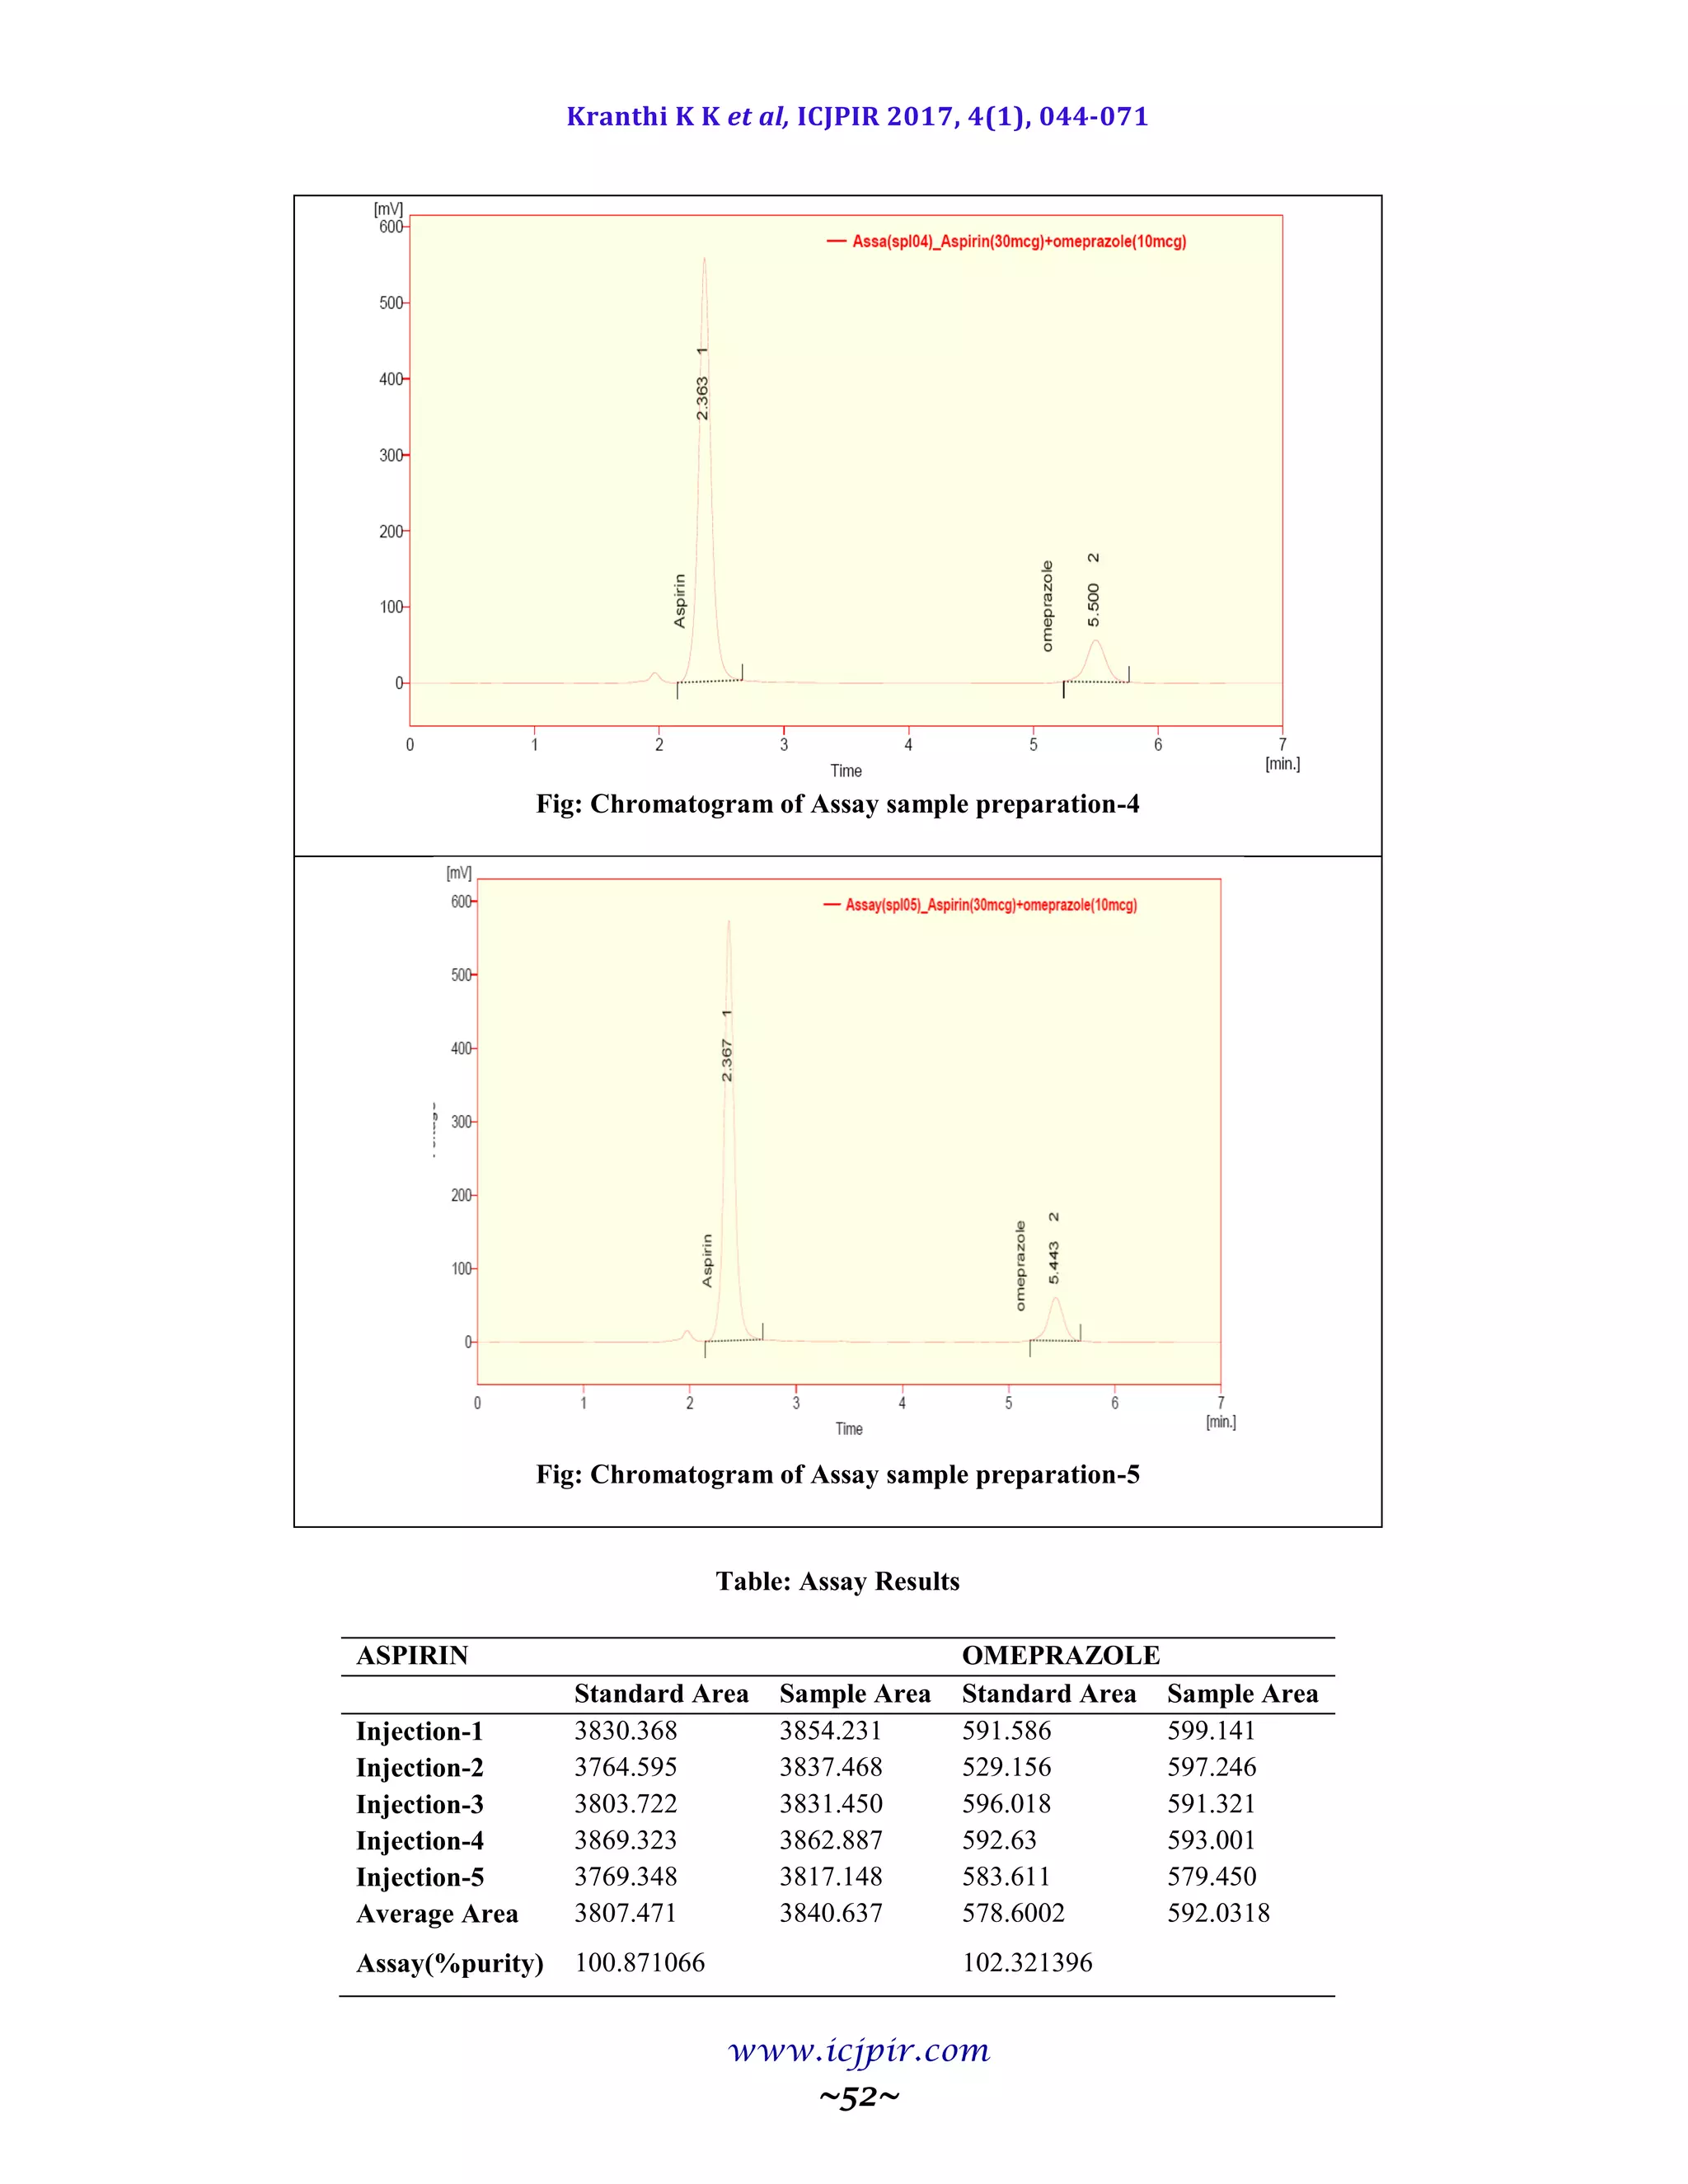
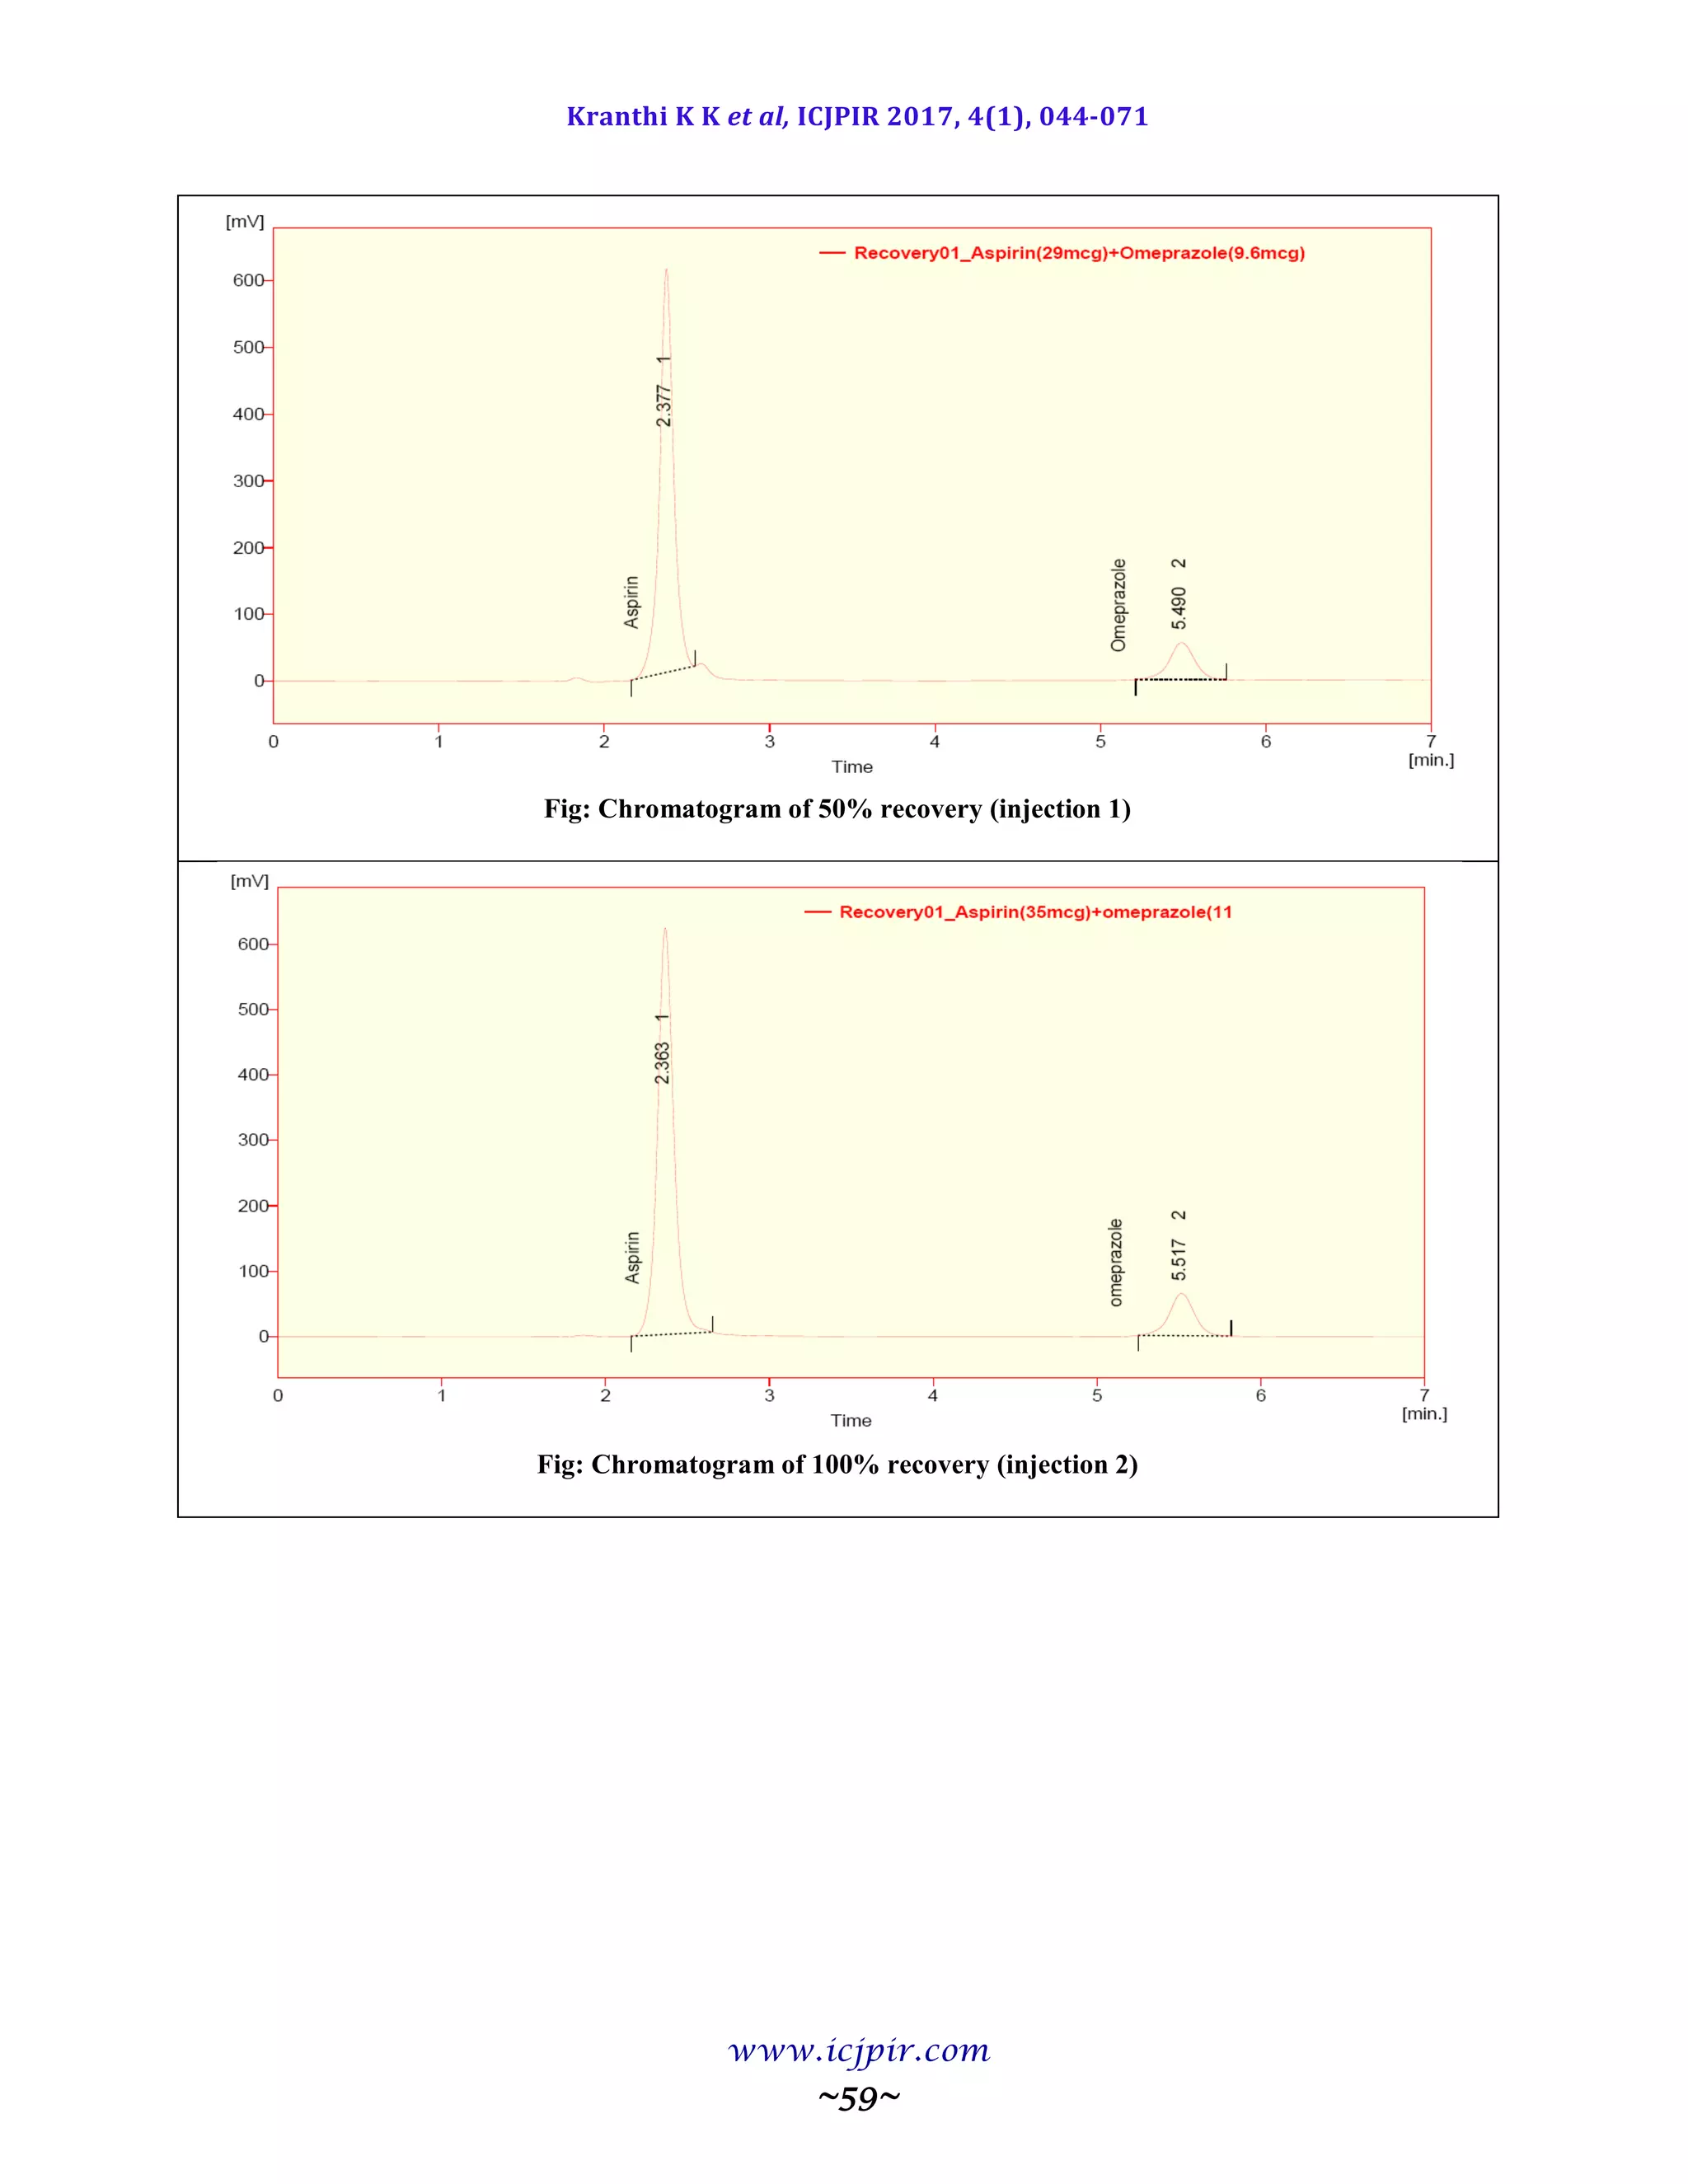
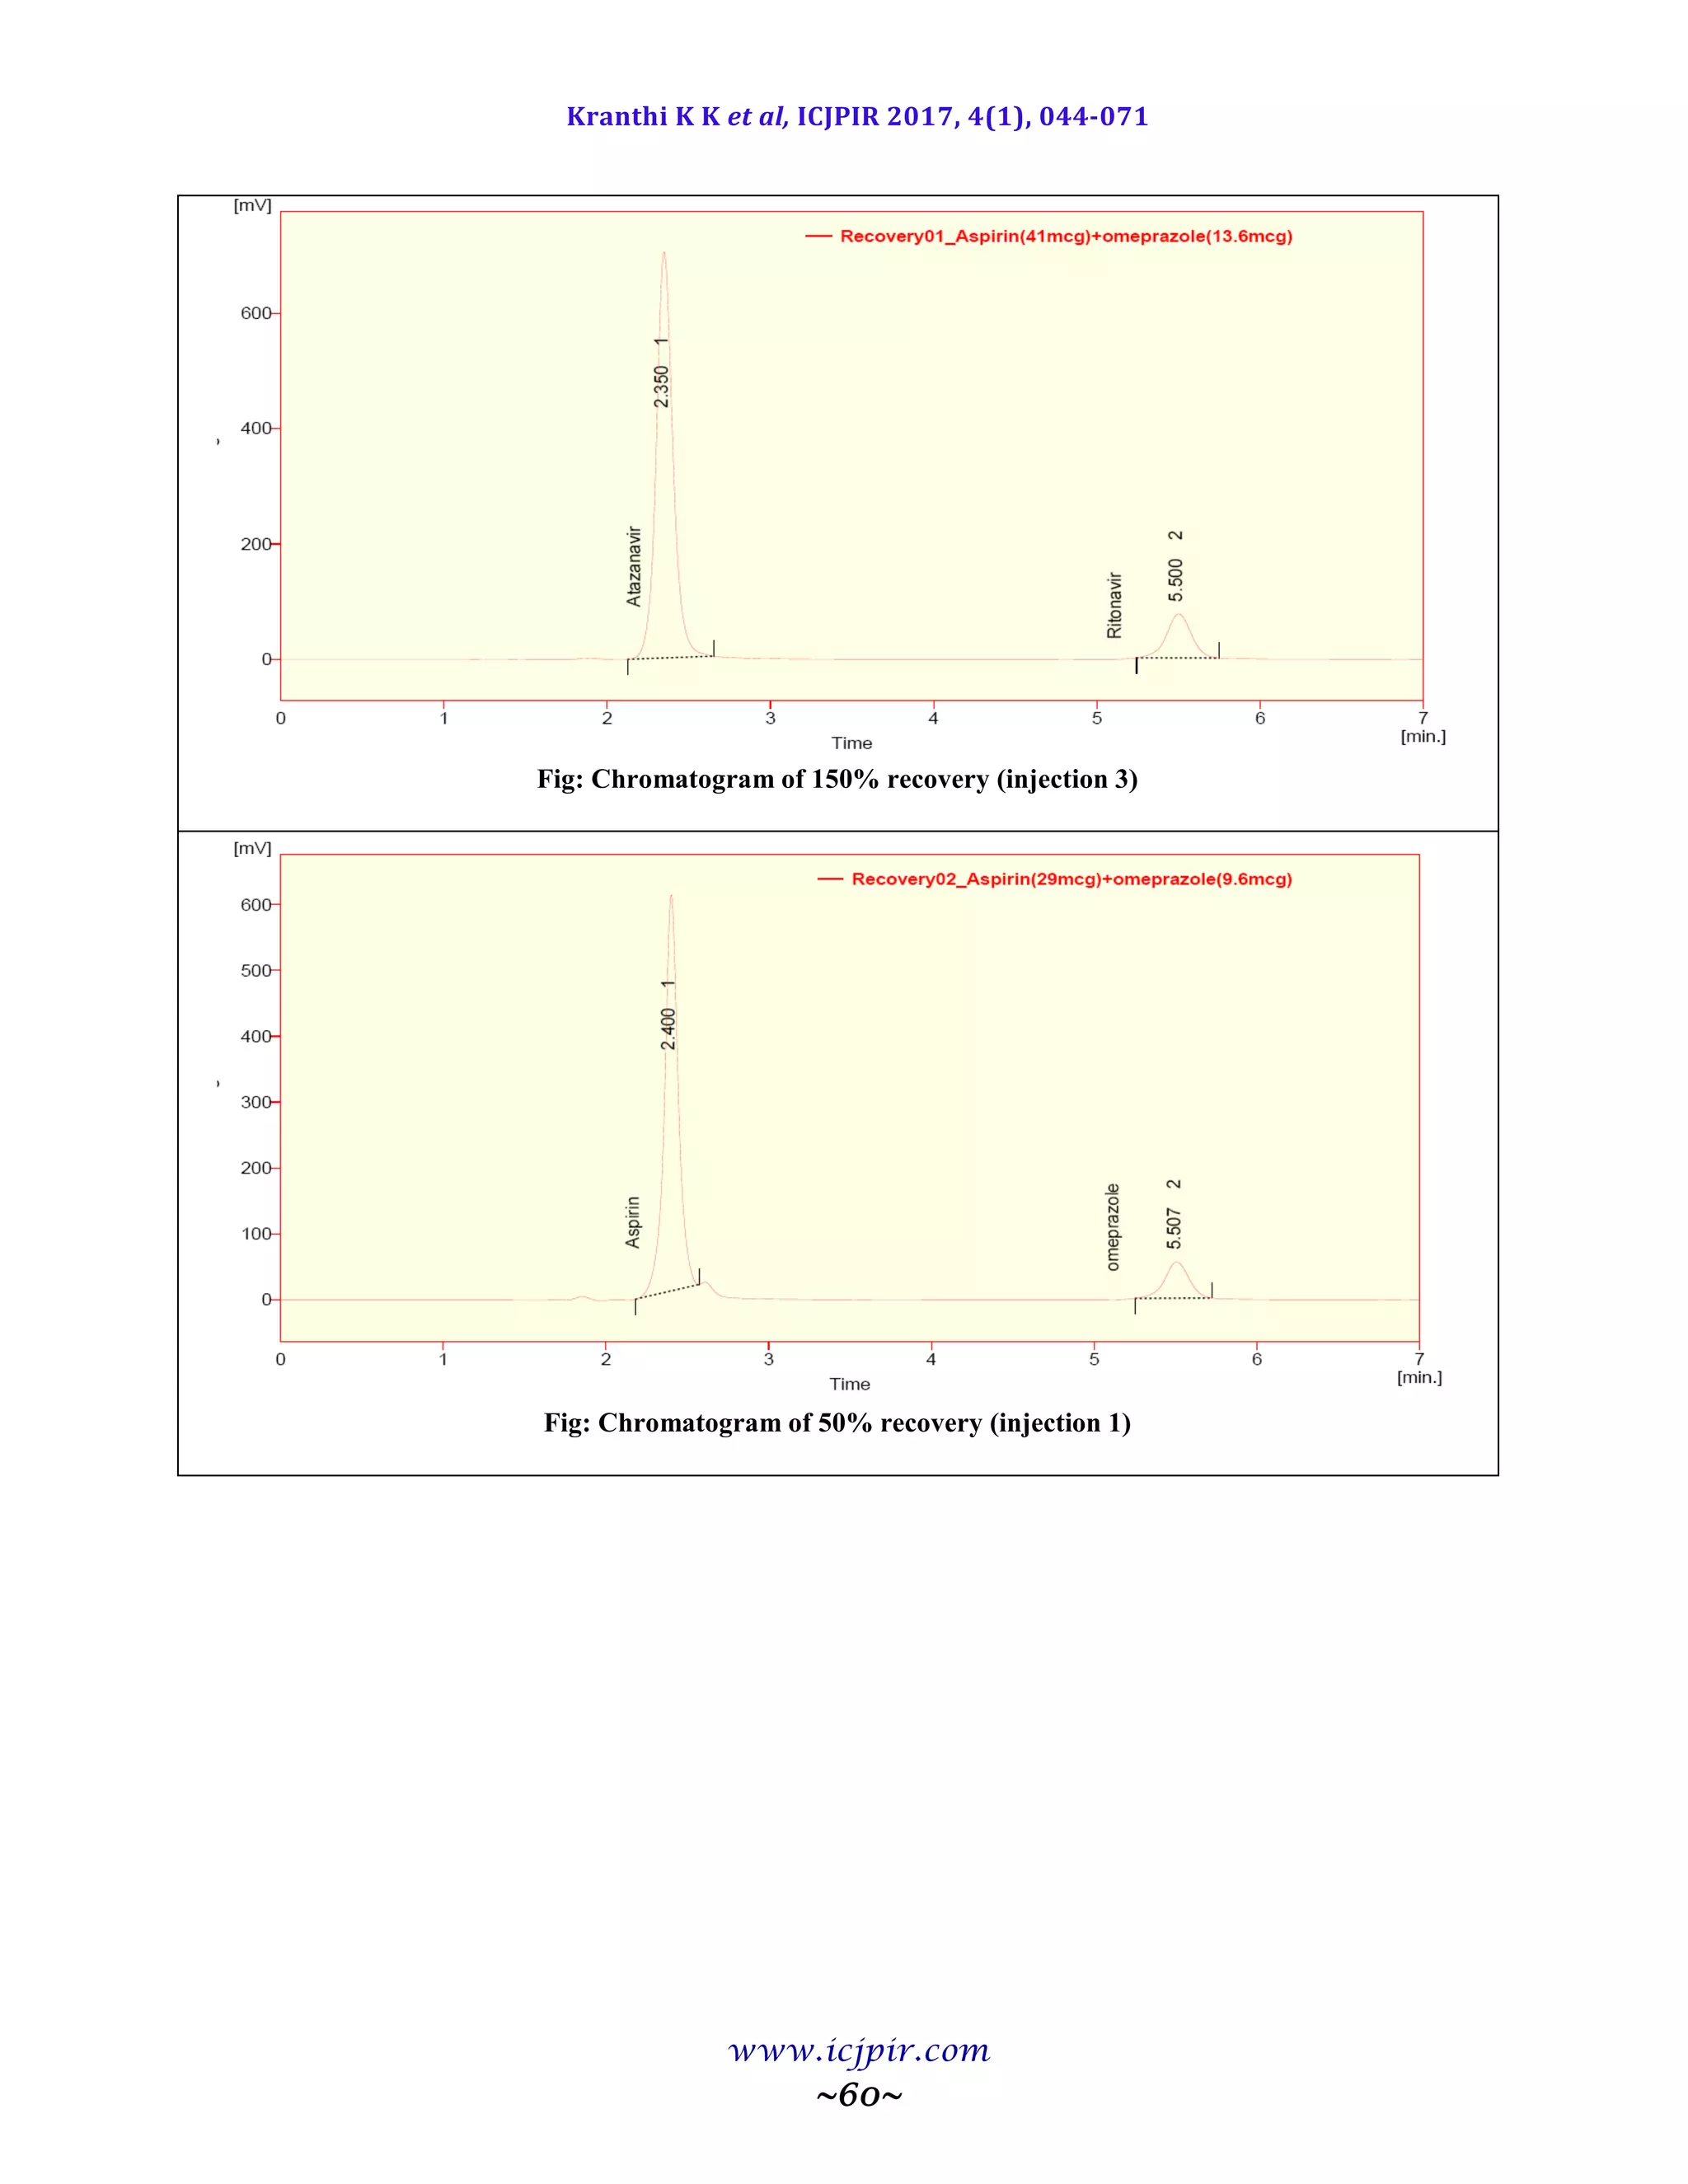
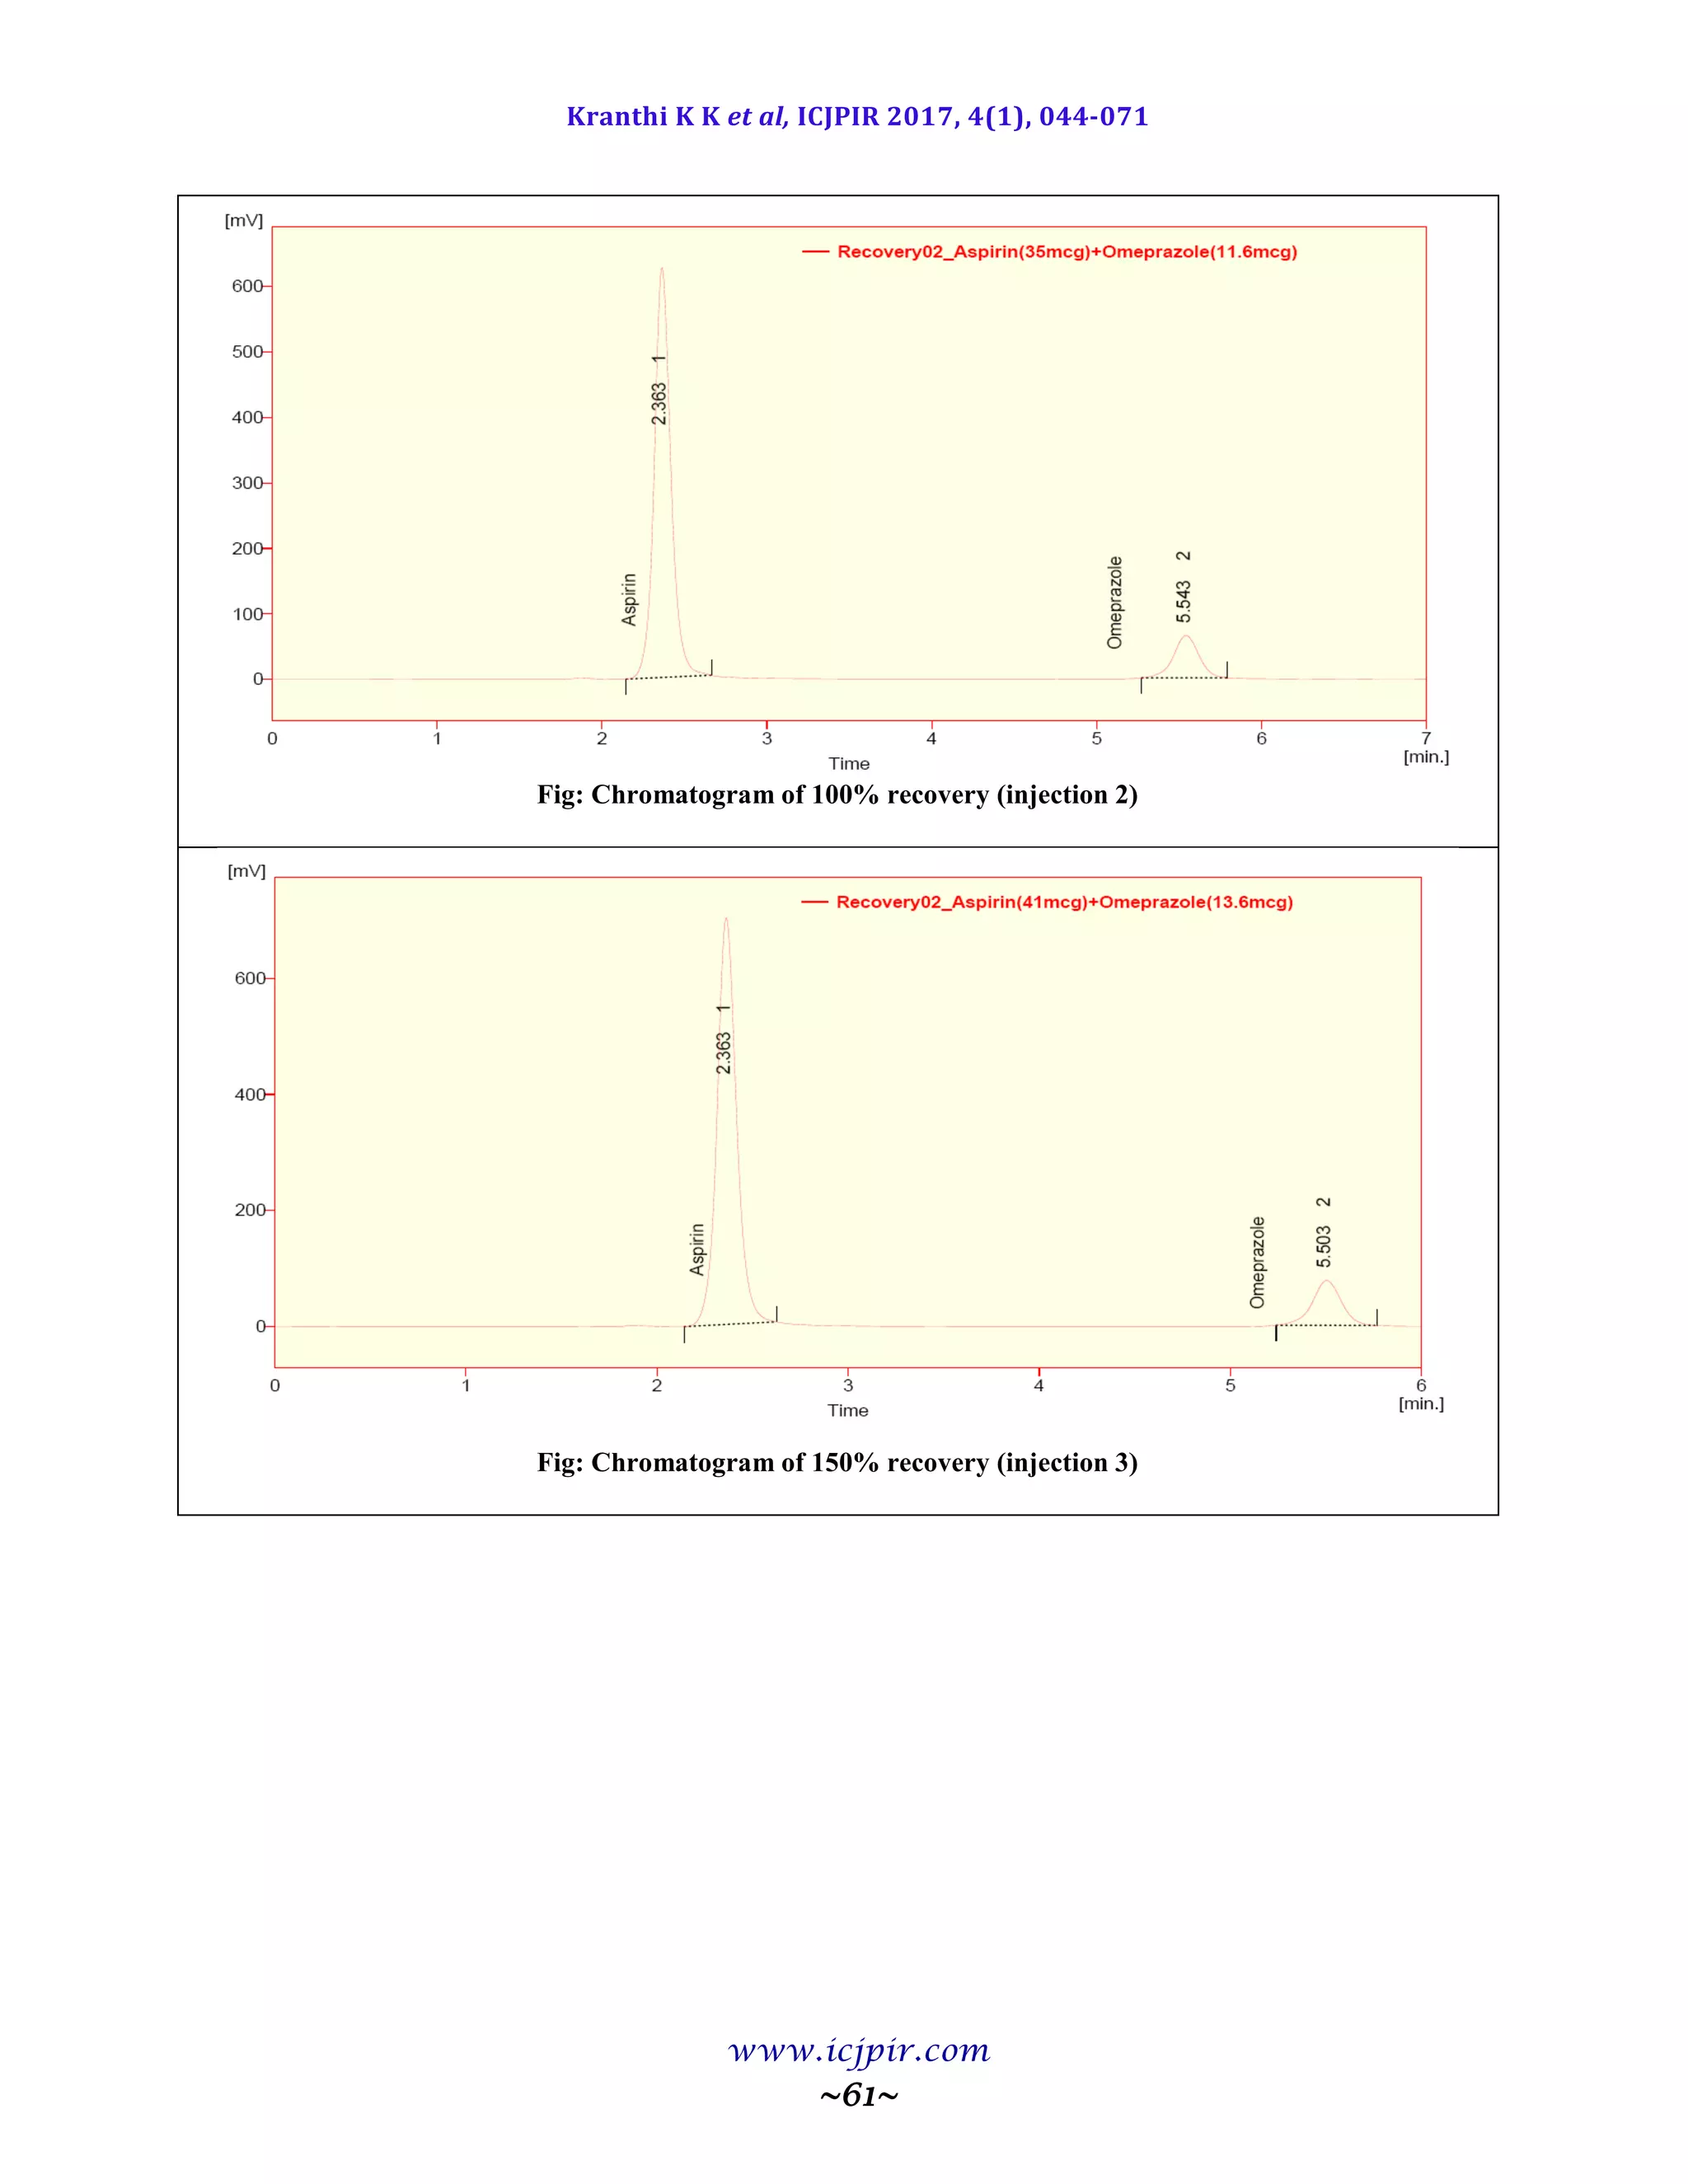
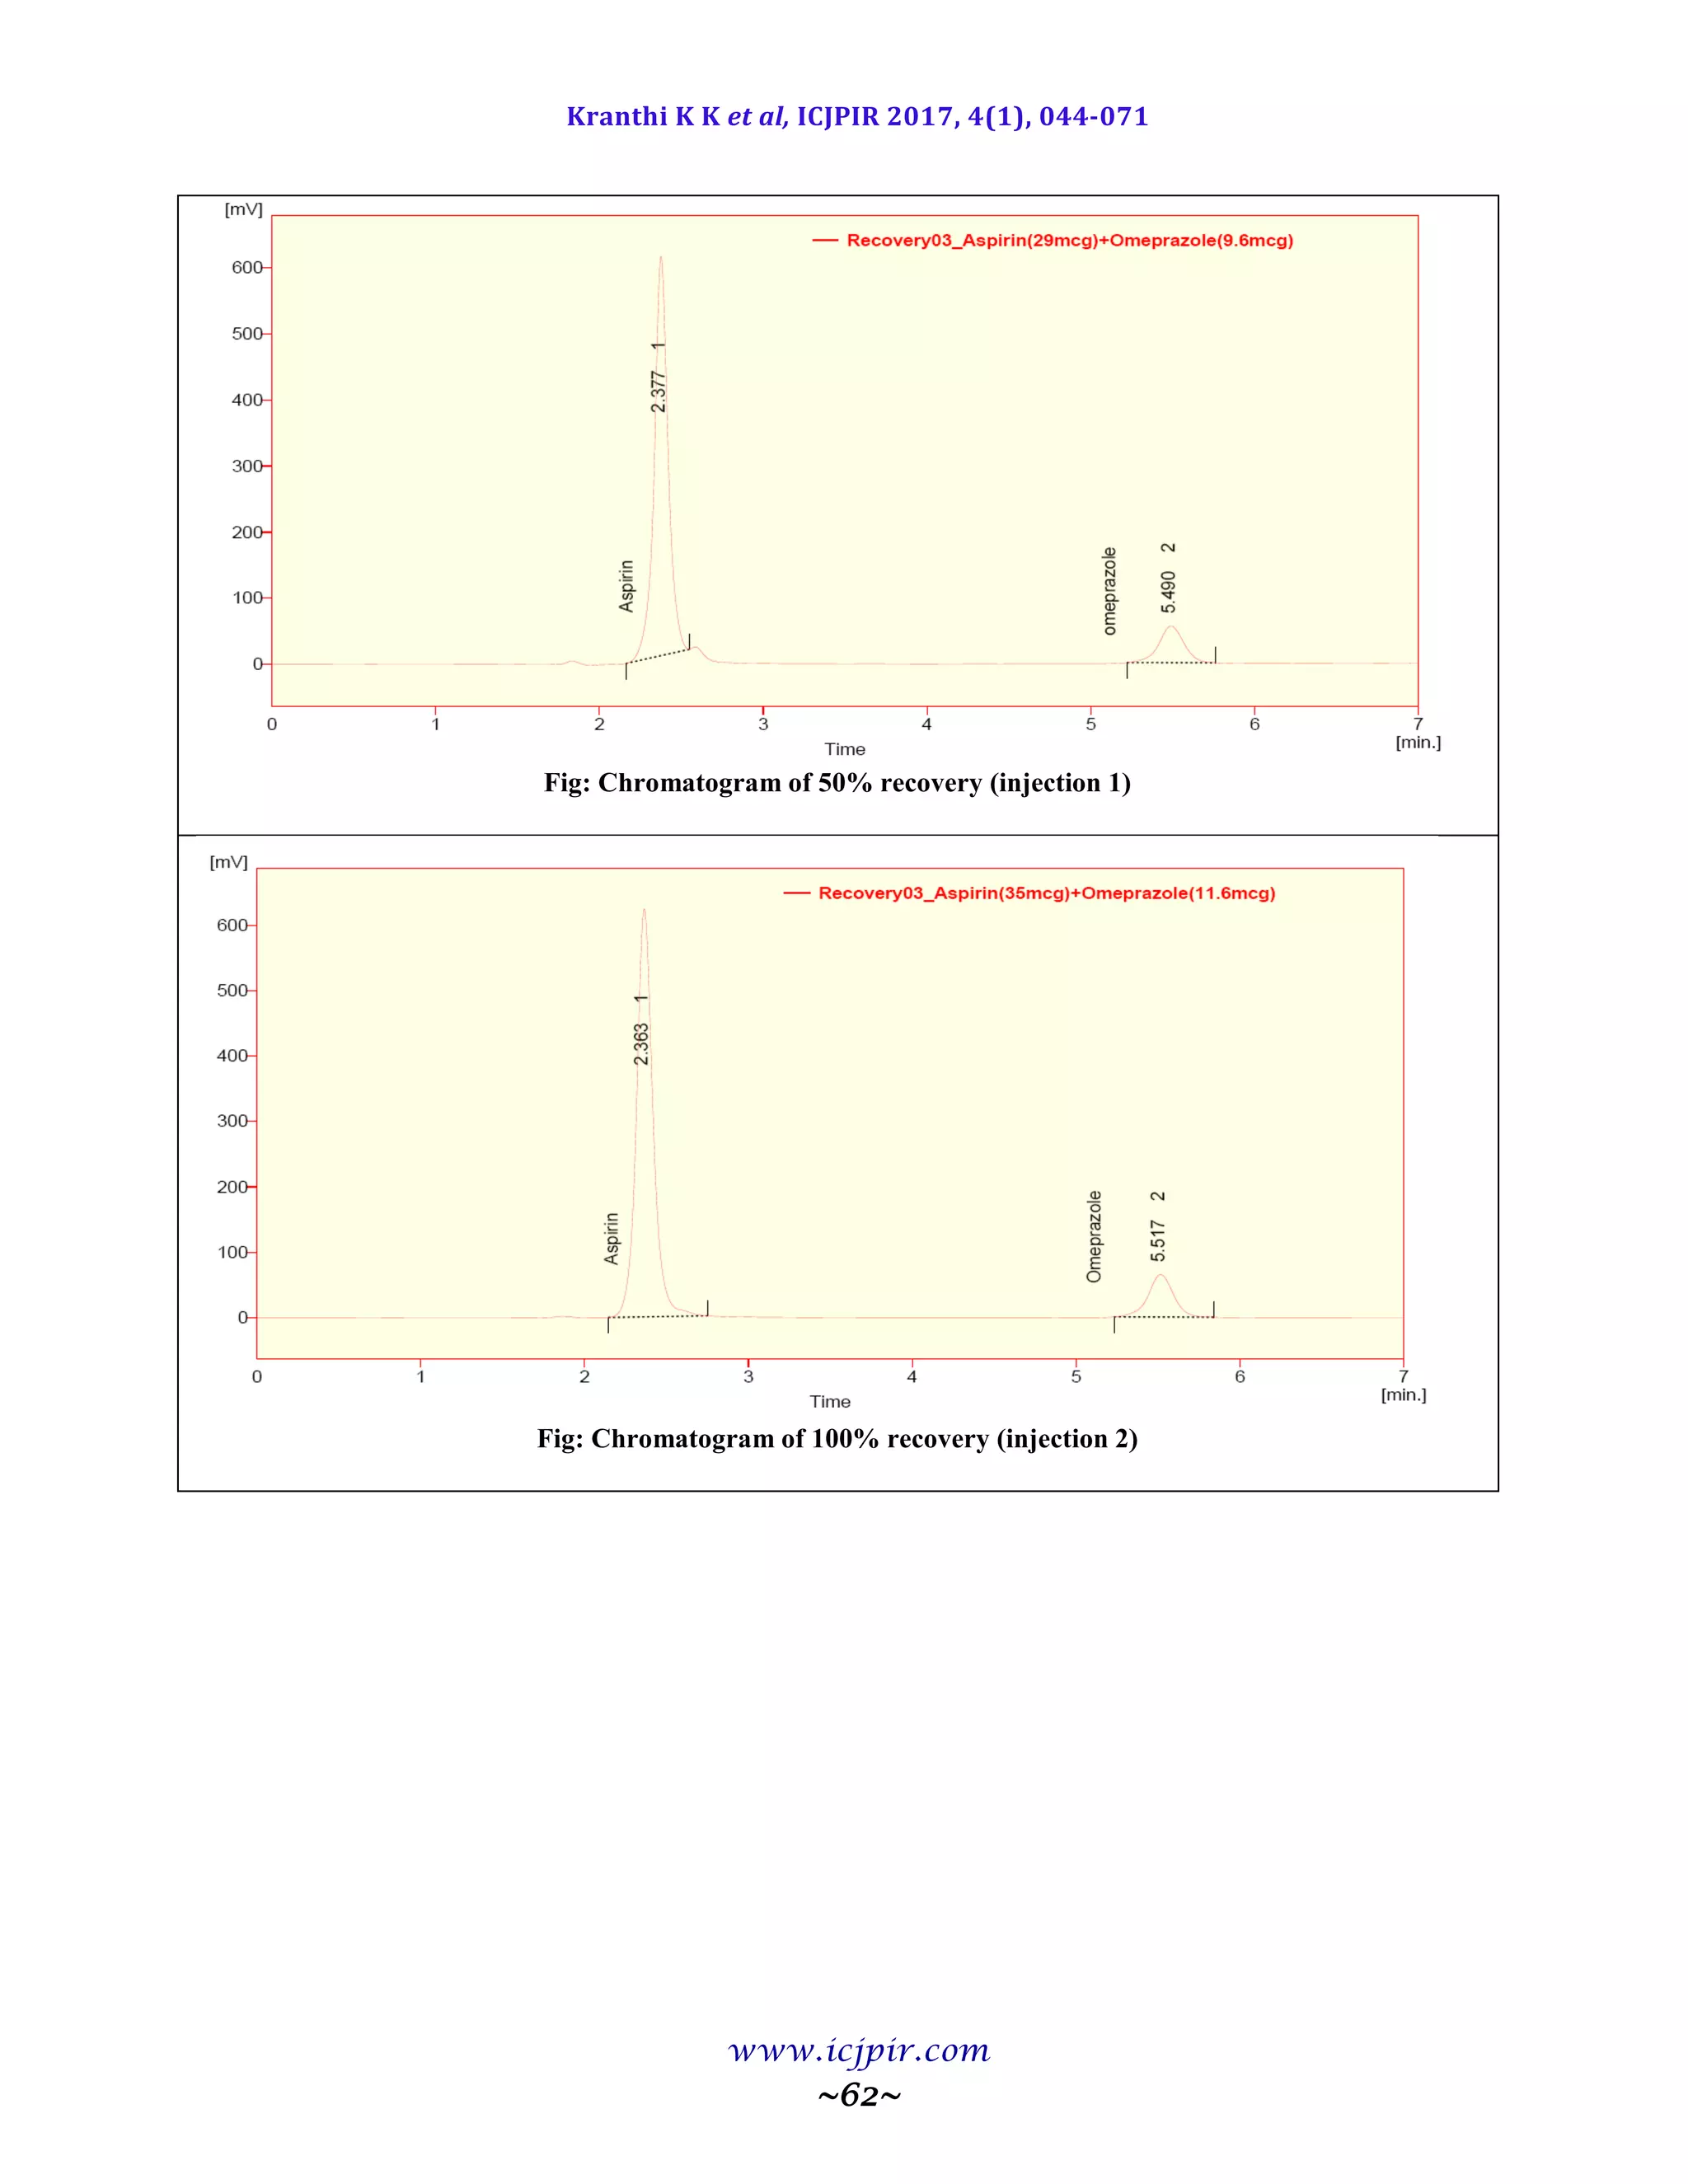
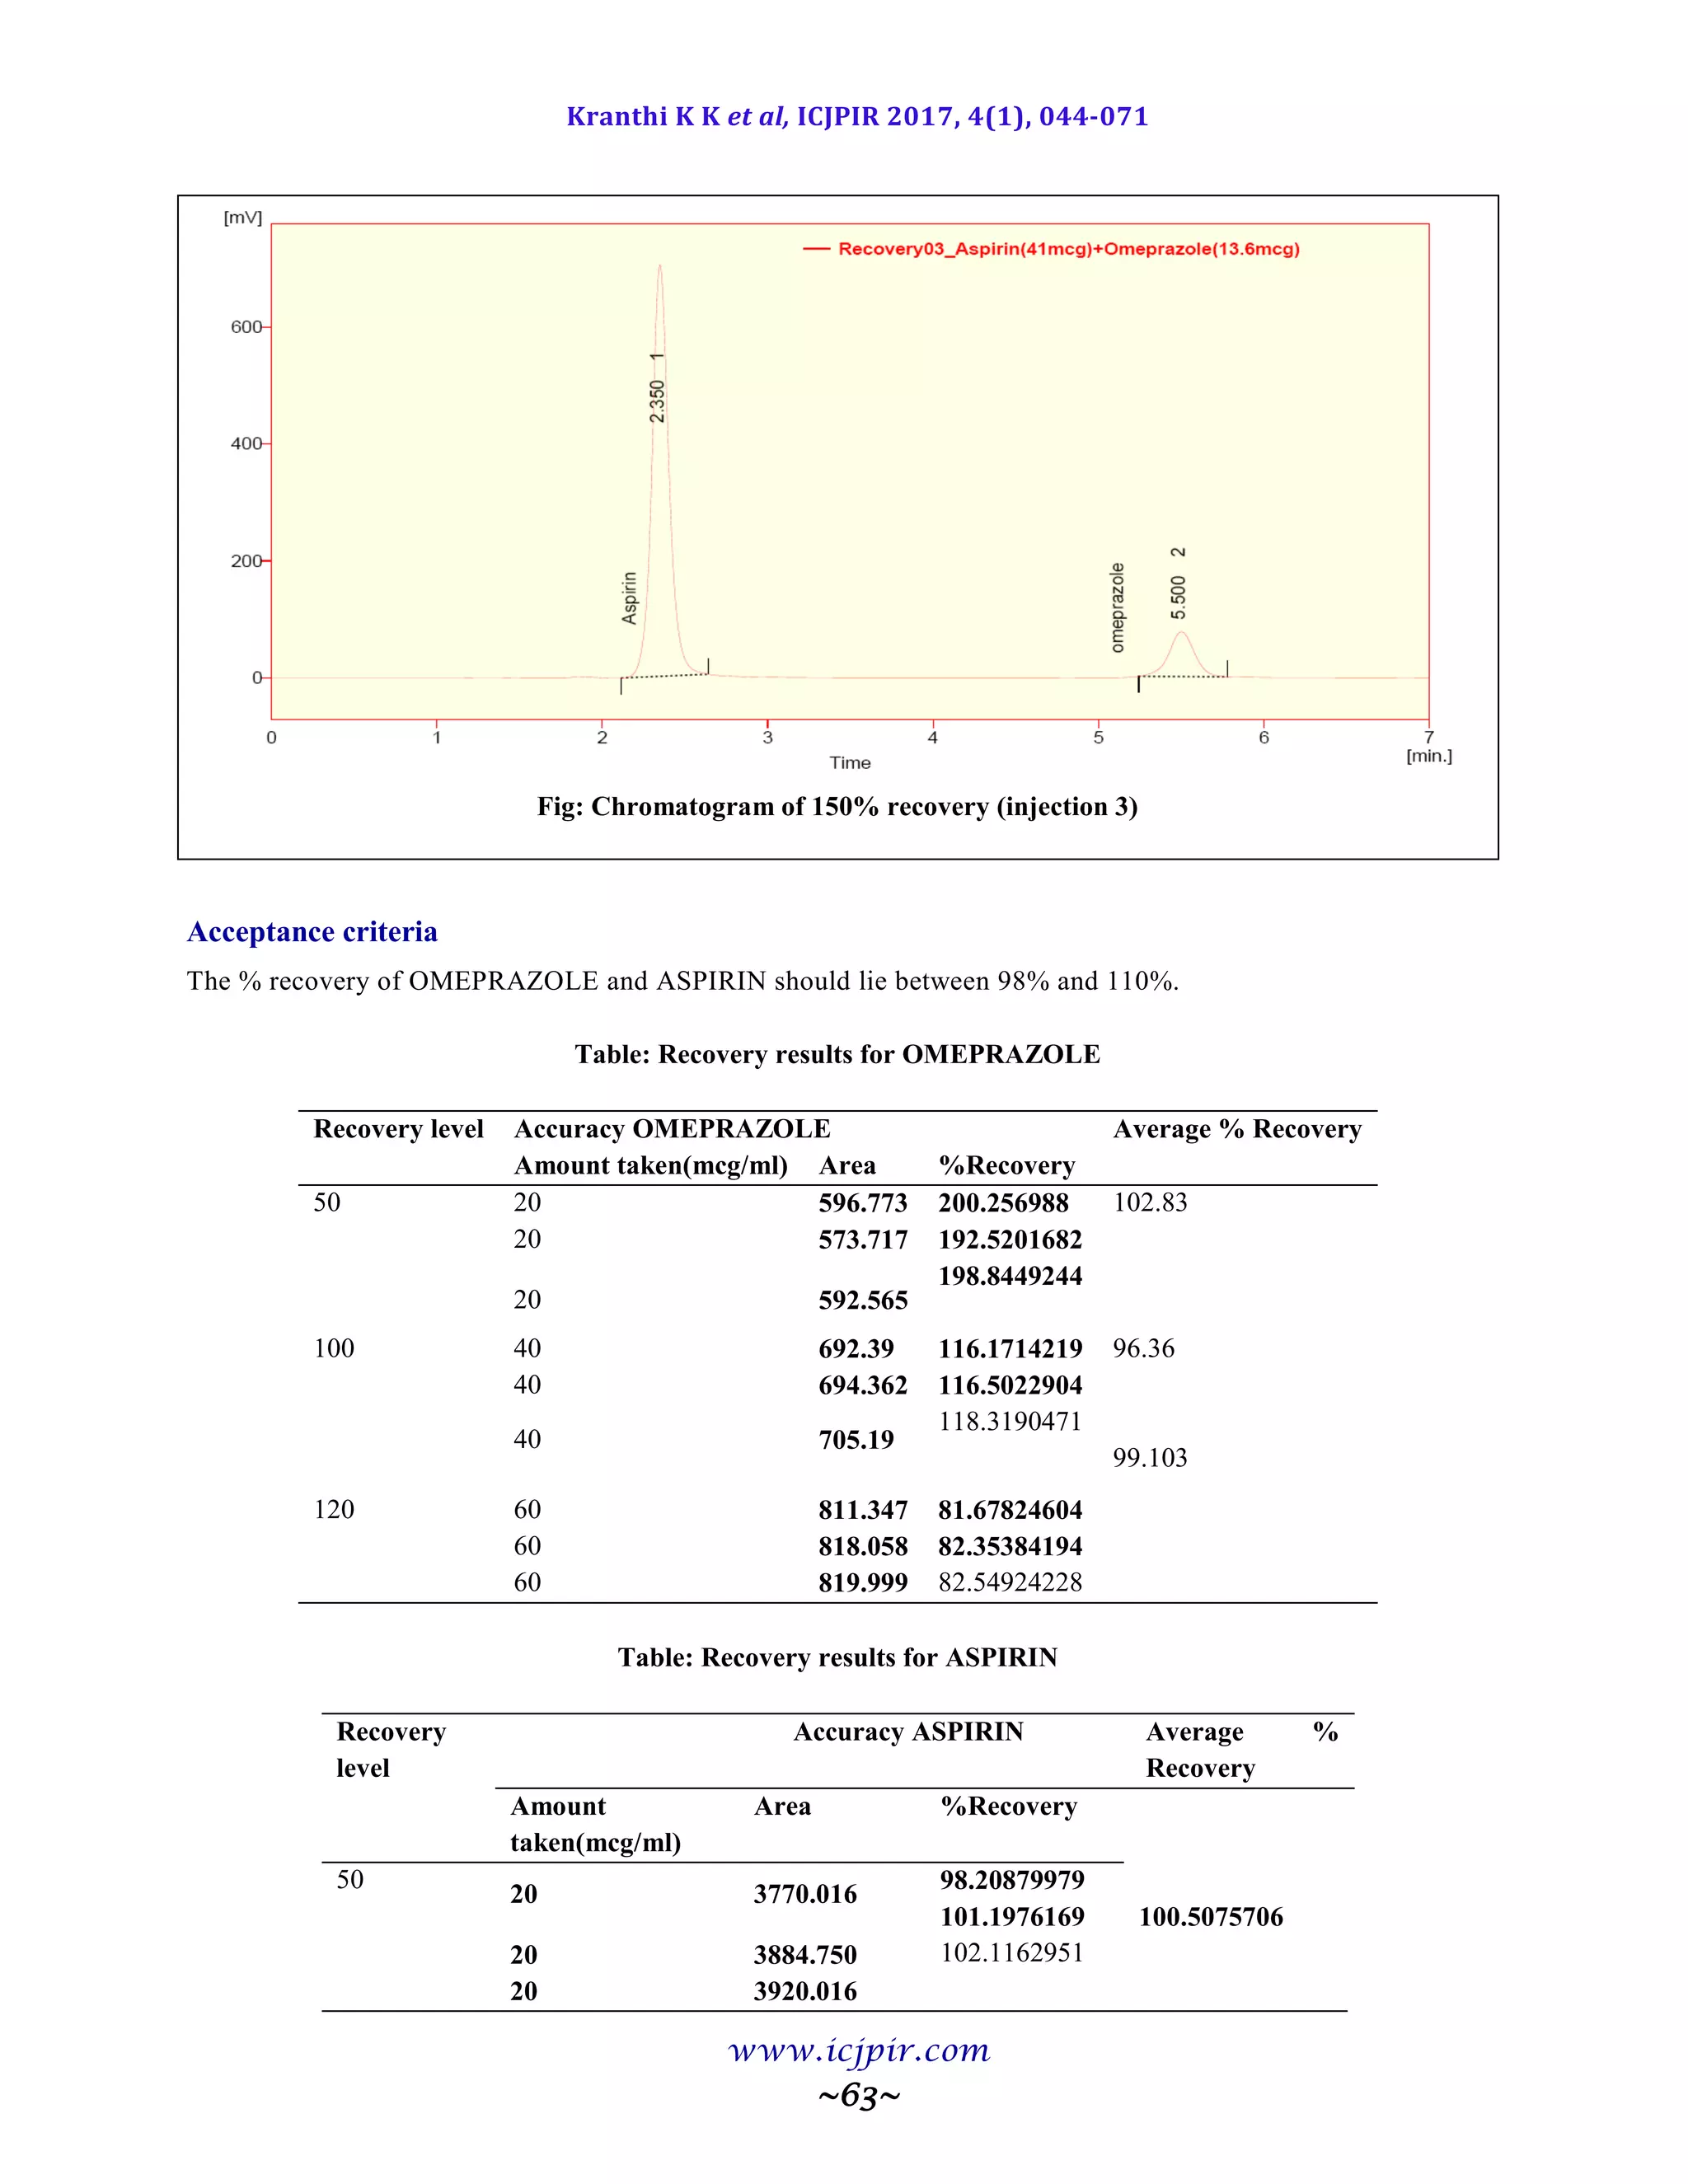
The proposed methods were validated. The accuracy of the methods was assessed by recovery studies at three
different levels. Recovery experiments indicated the absence of interference from commonly encountered
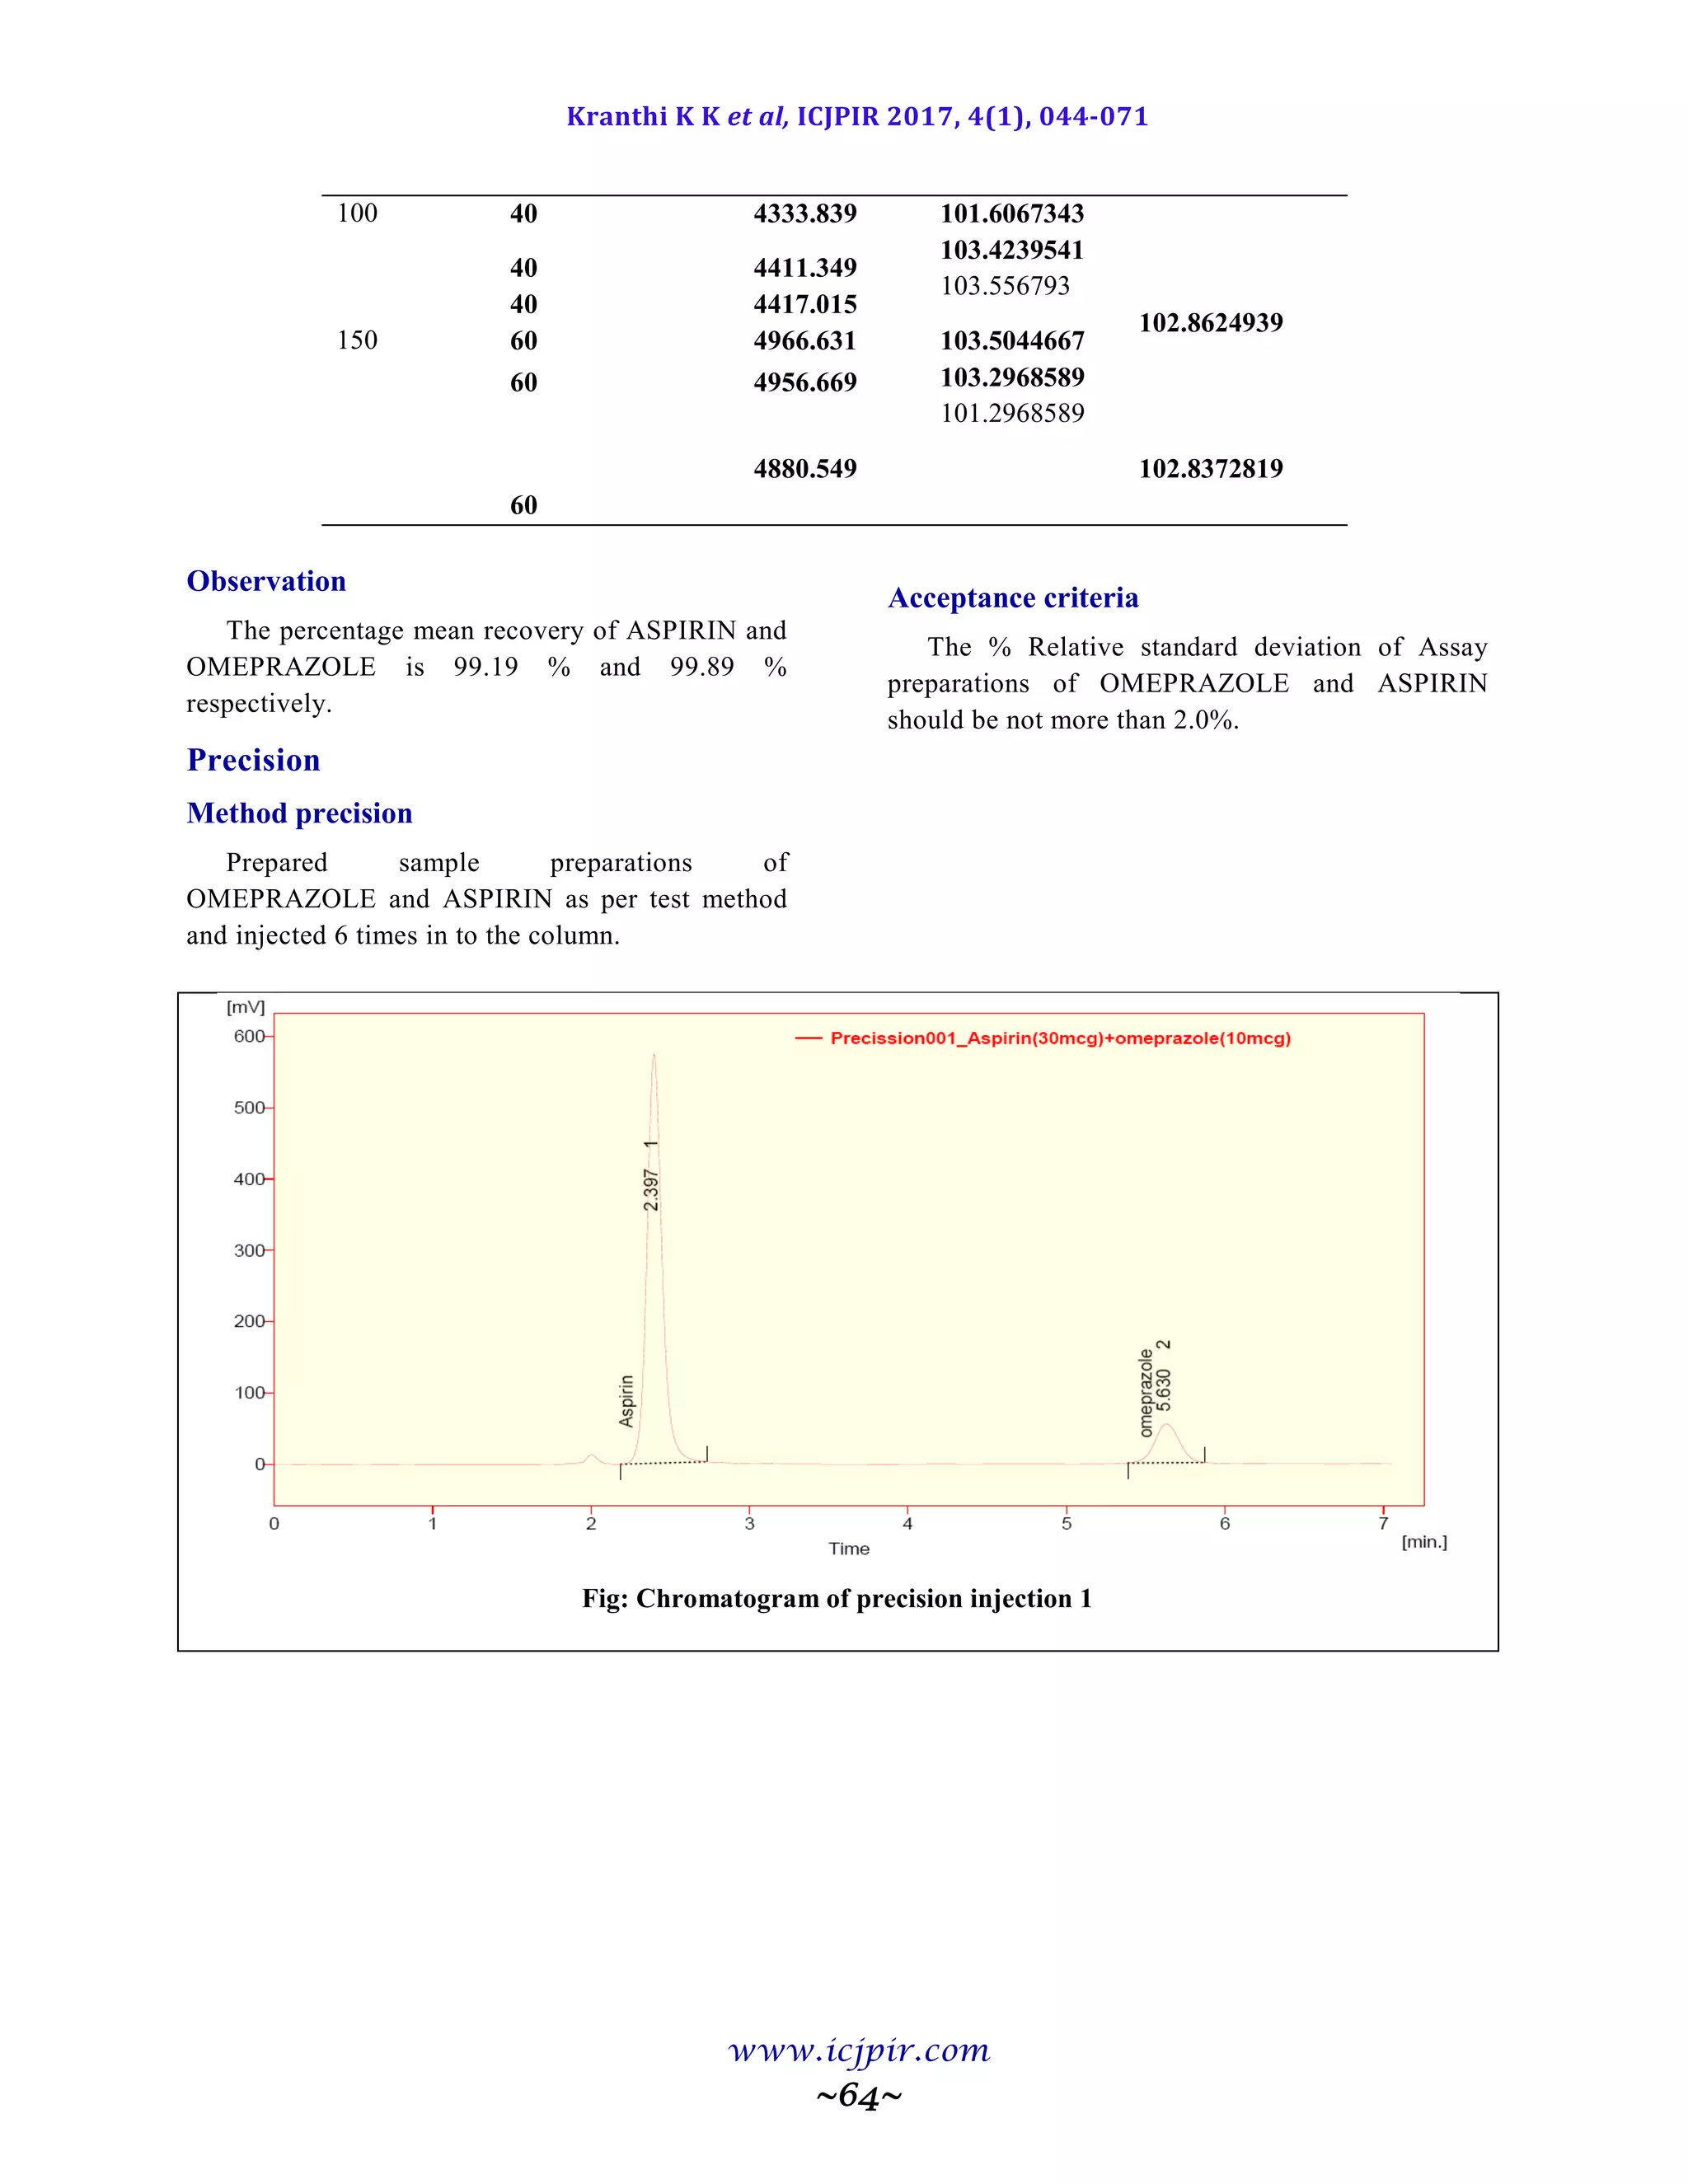
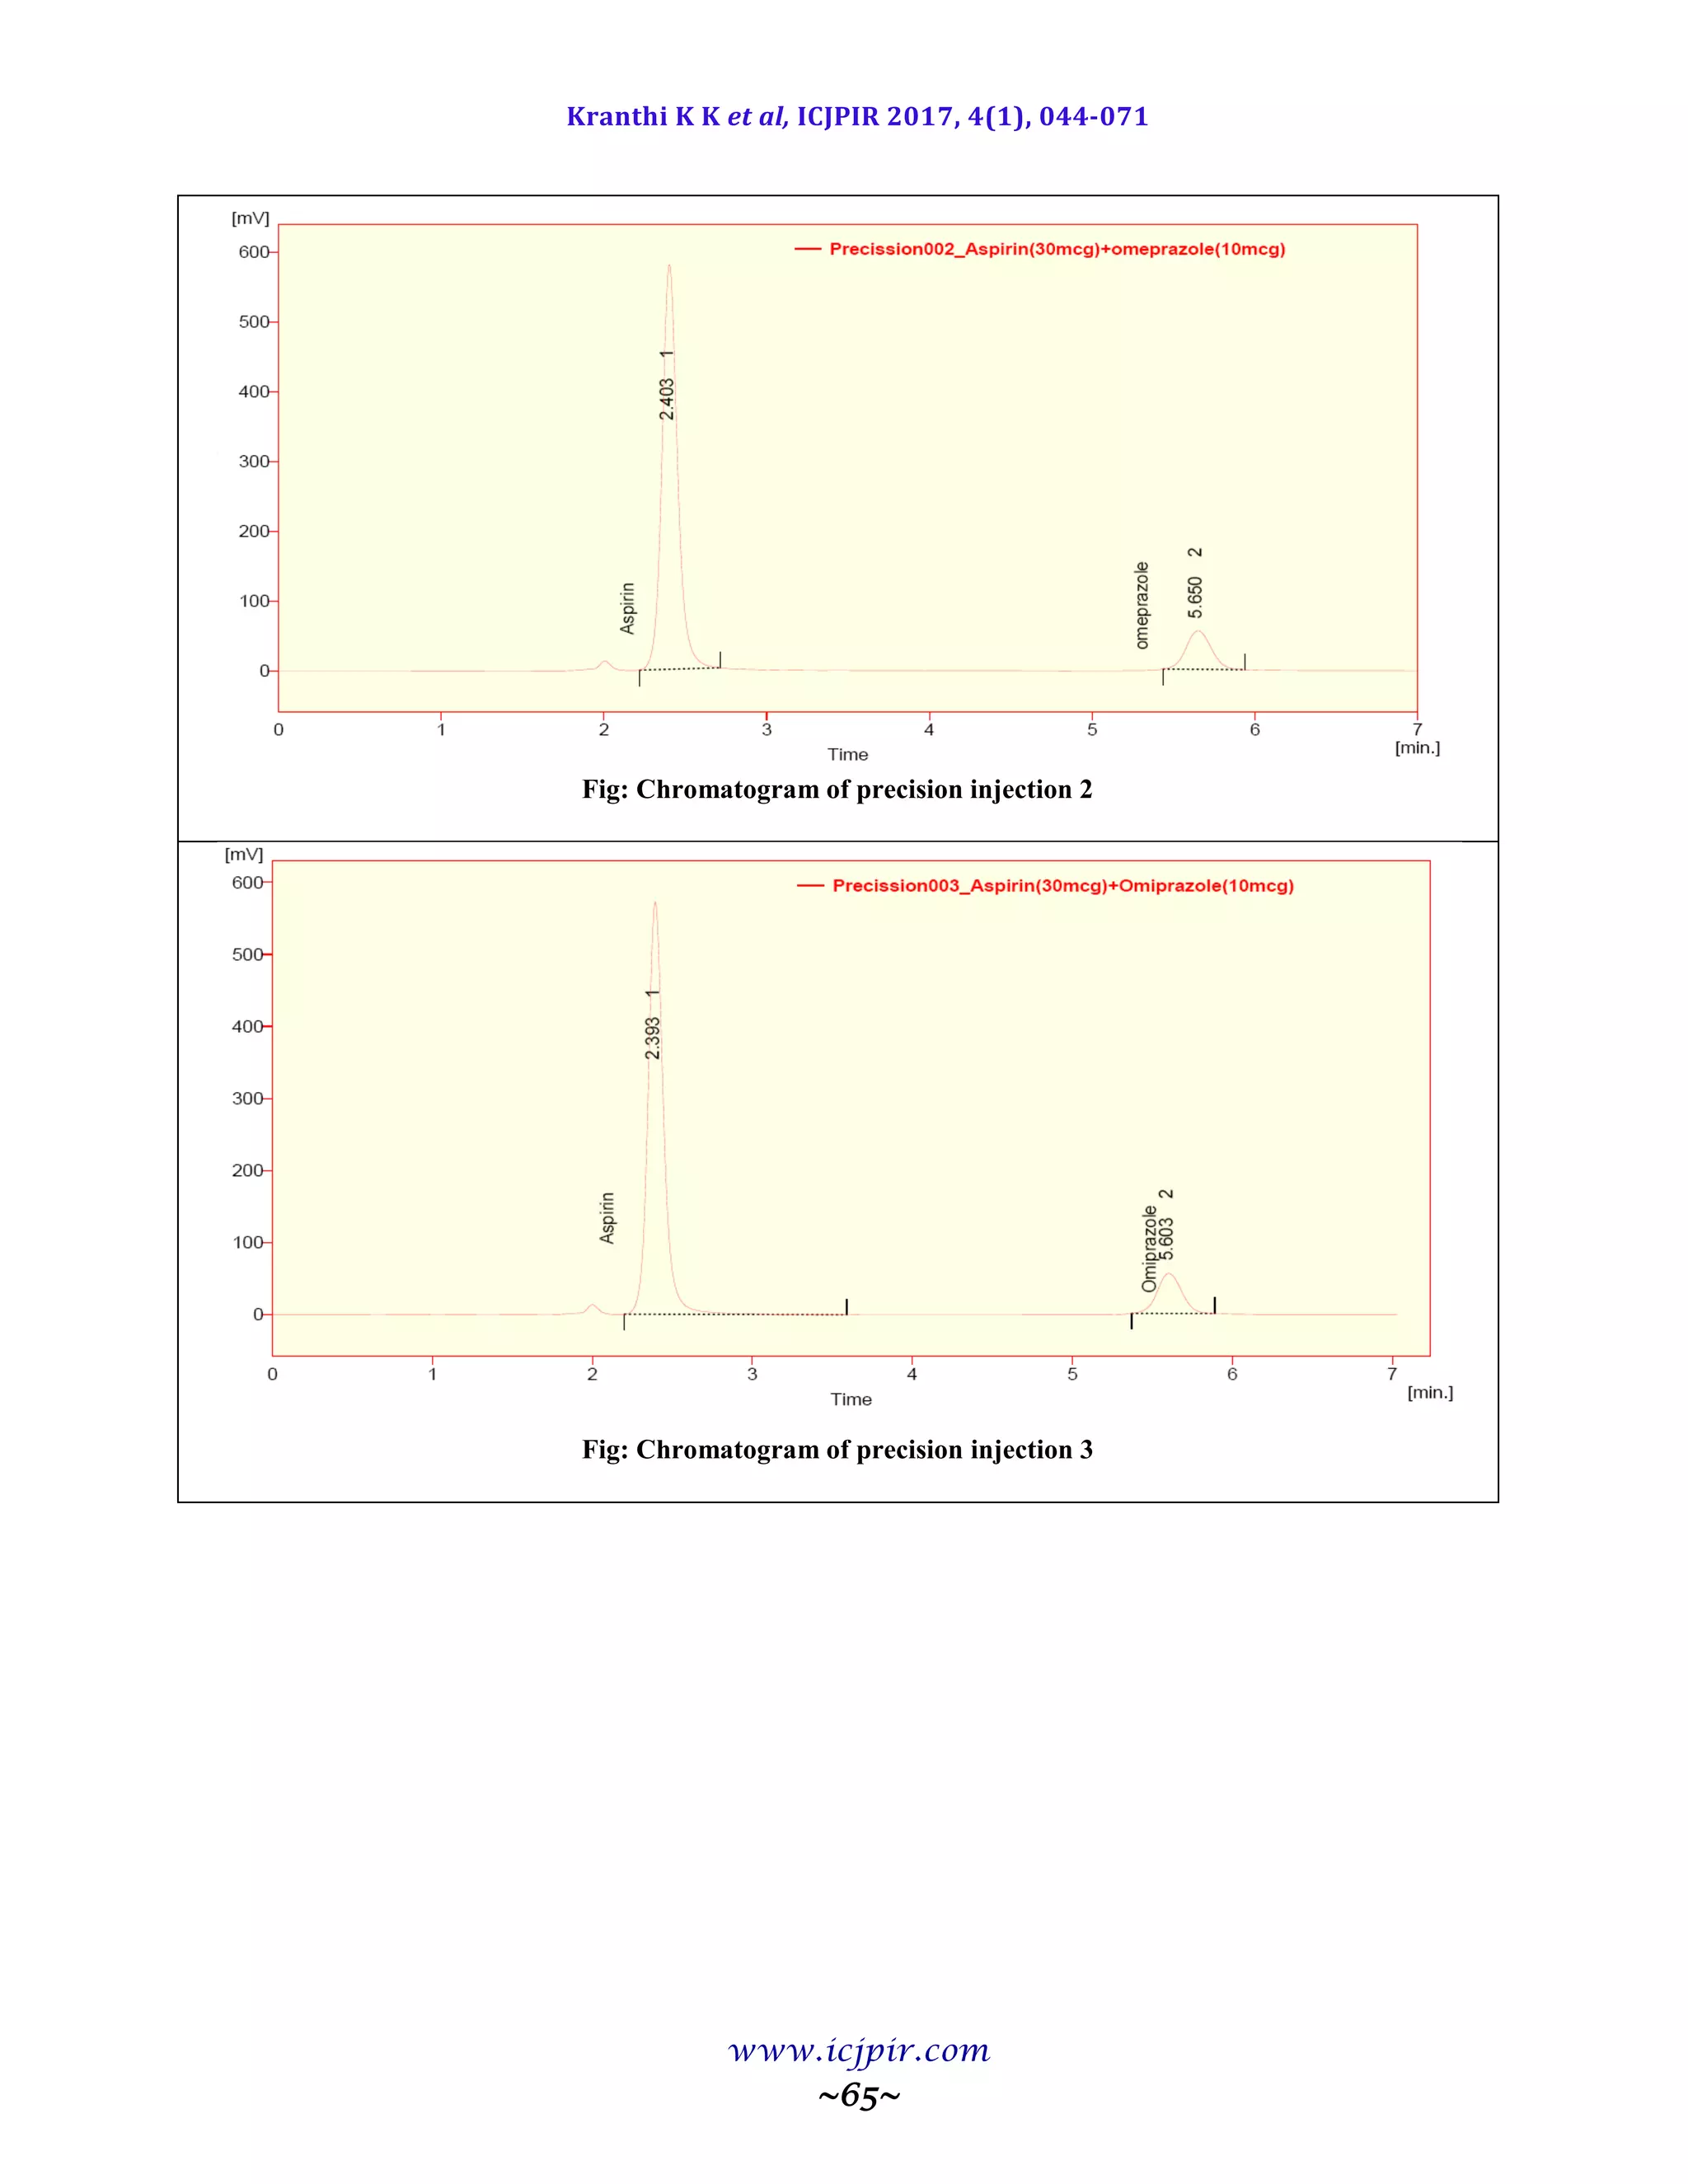
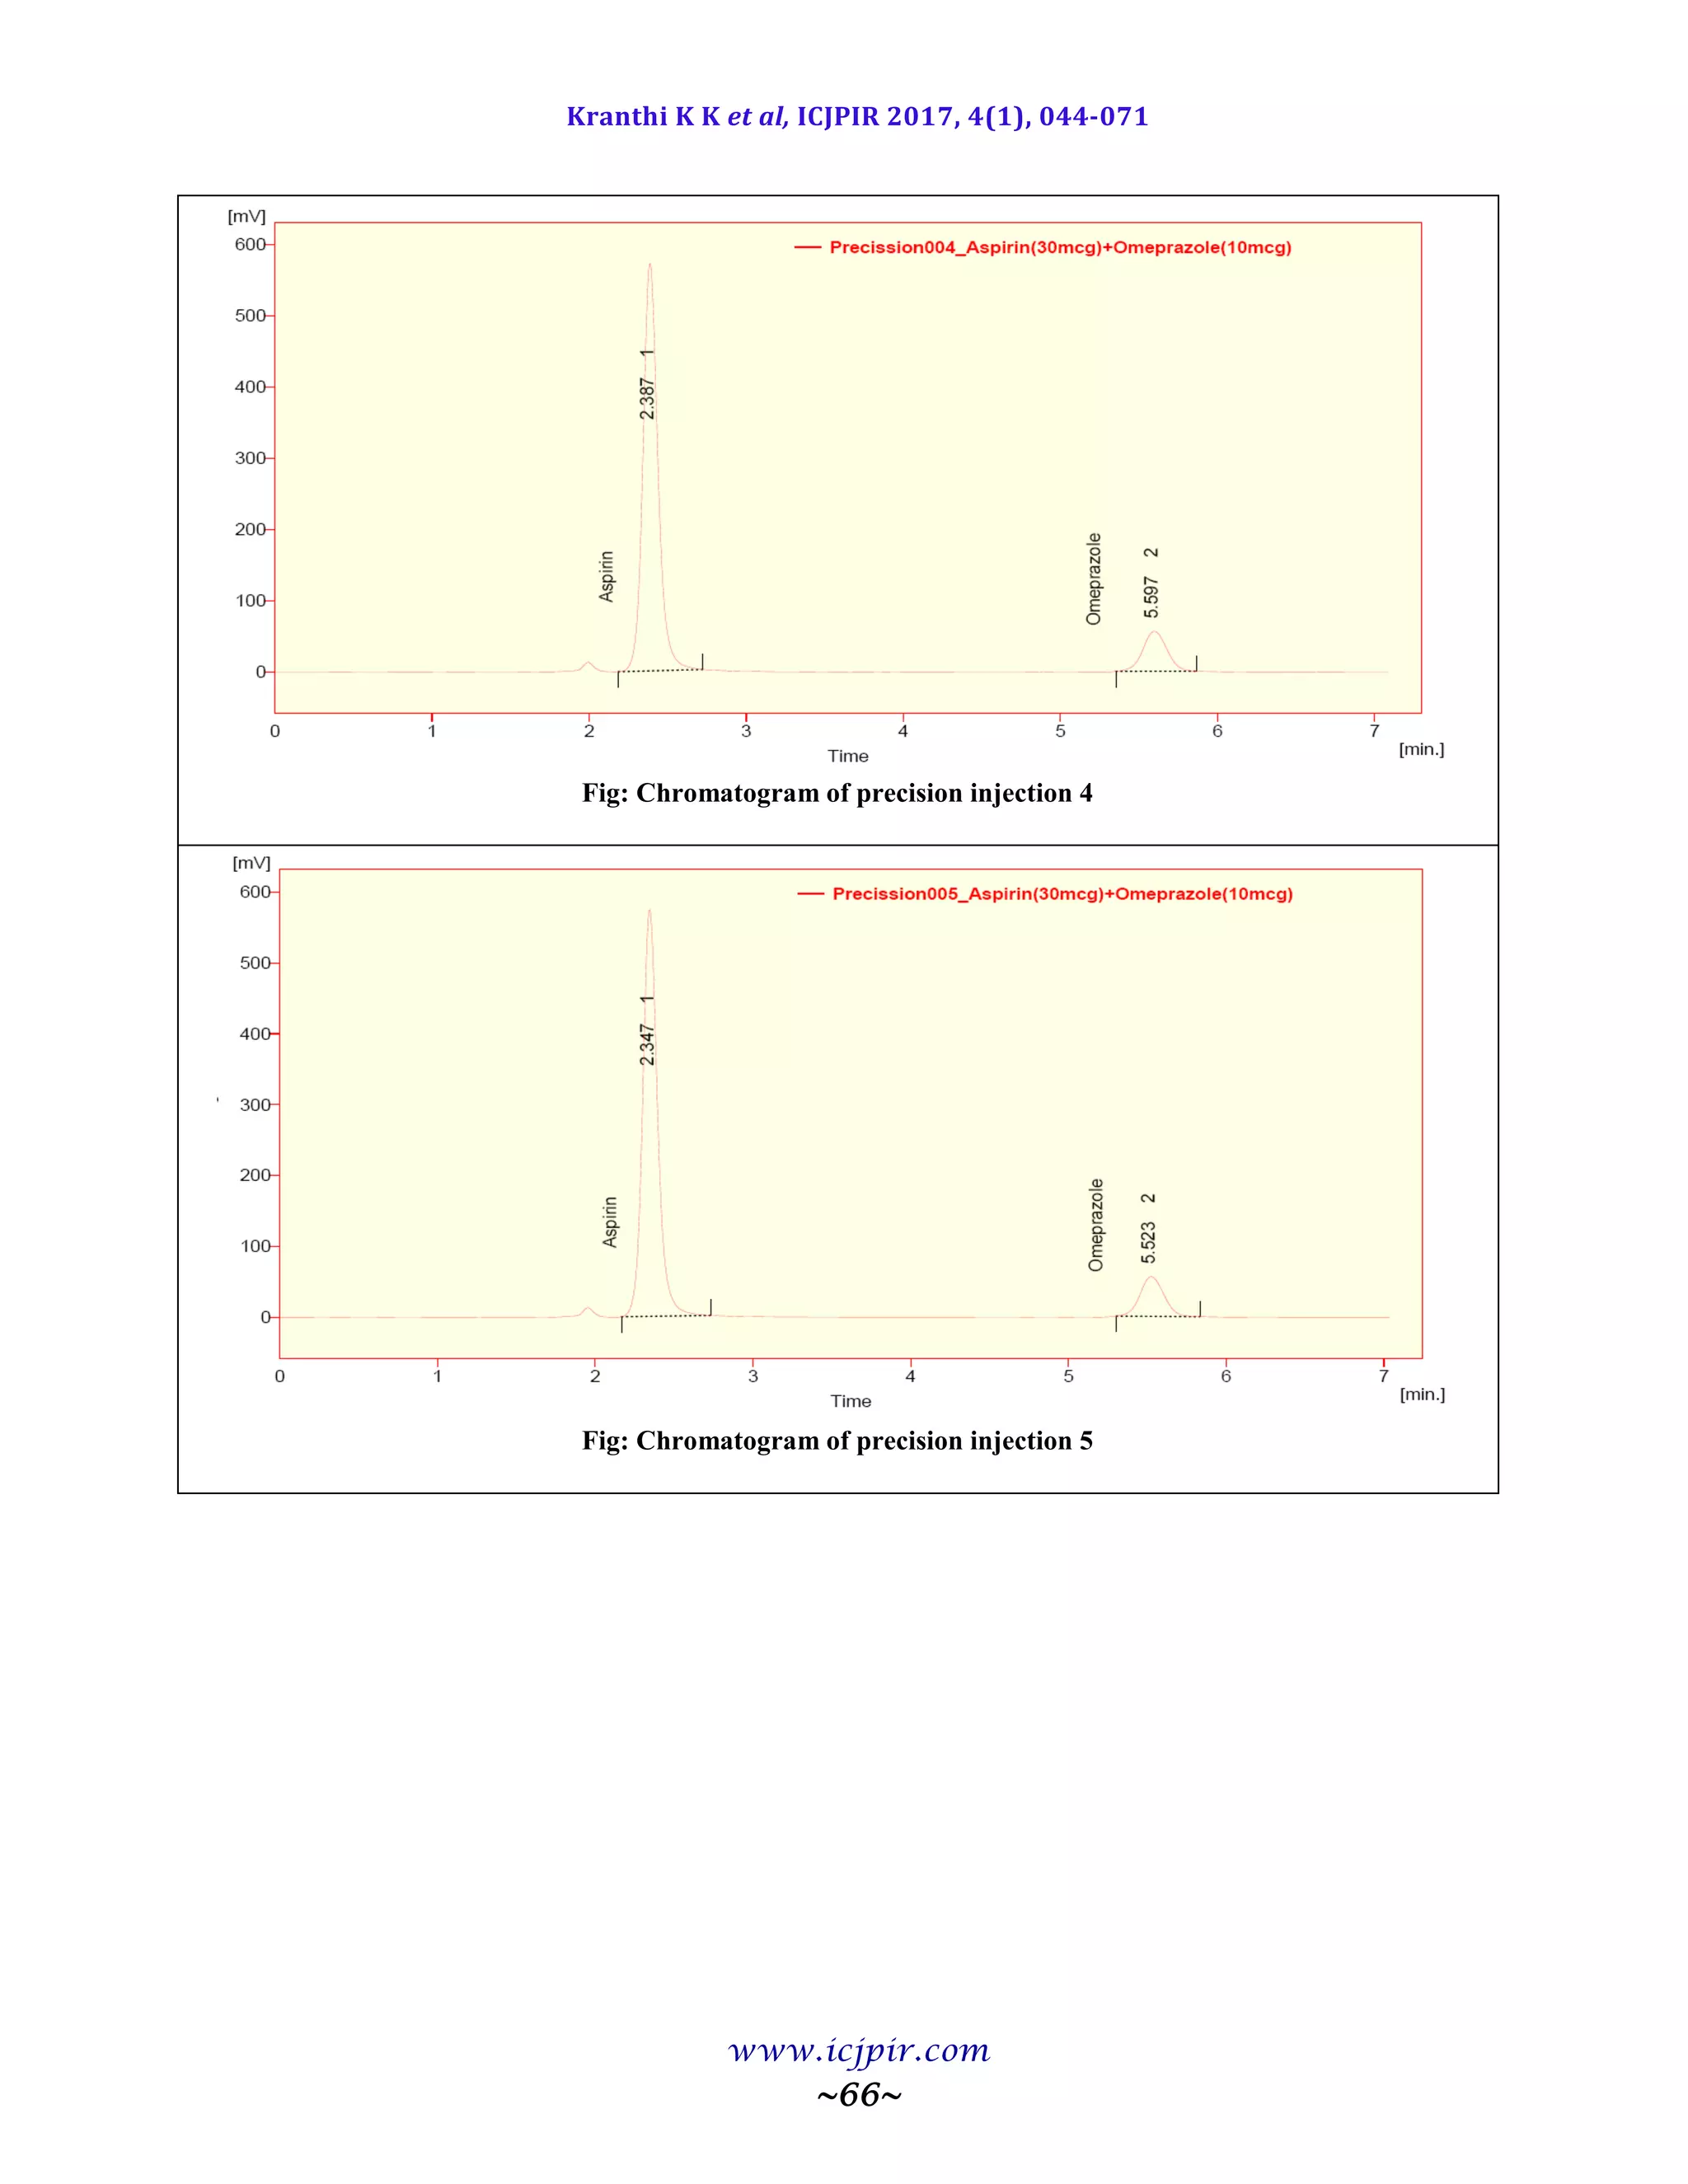
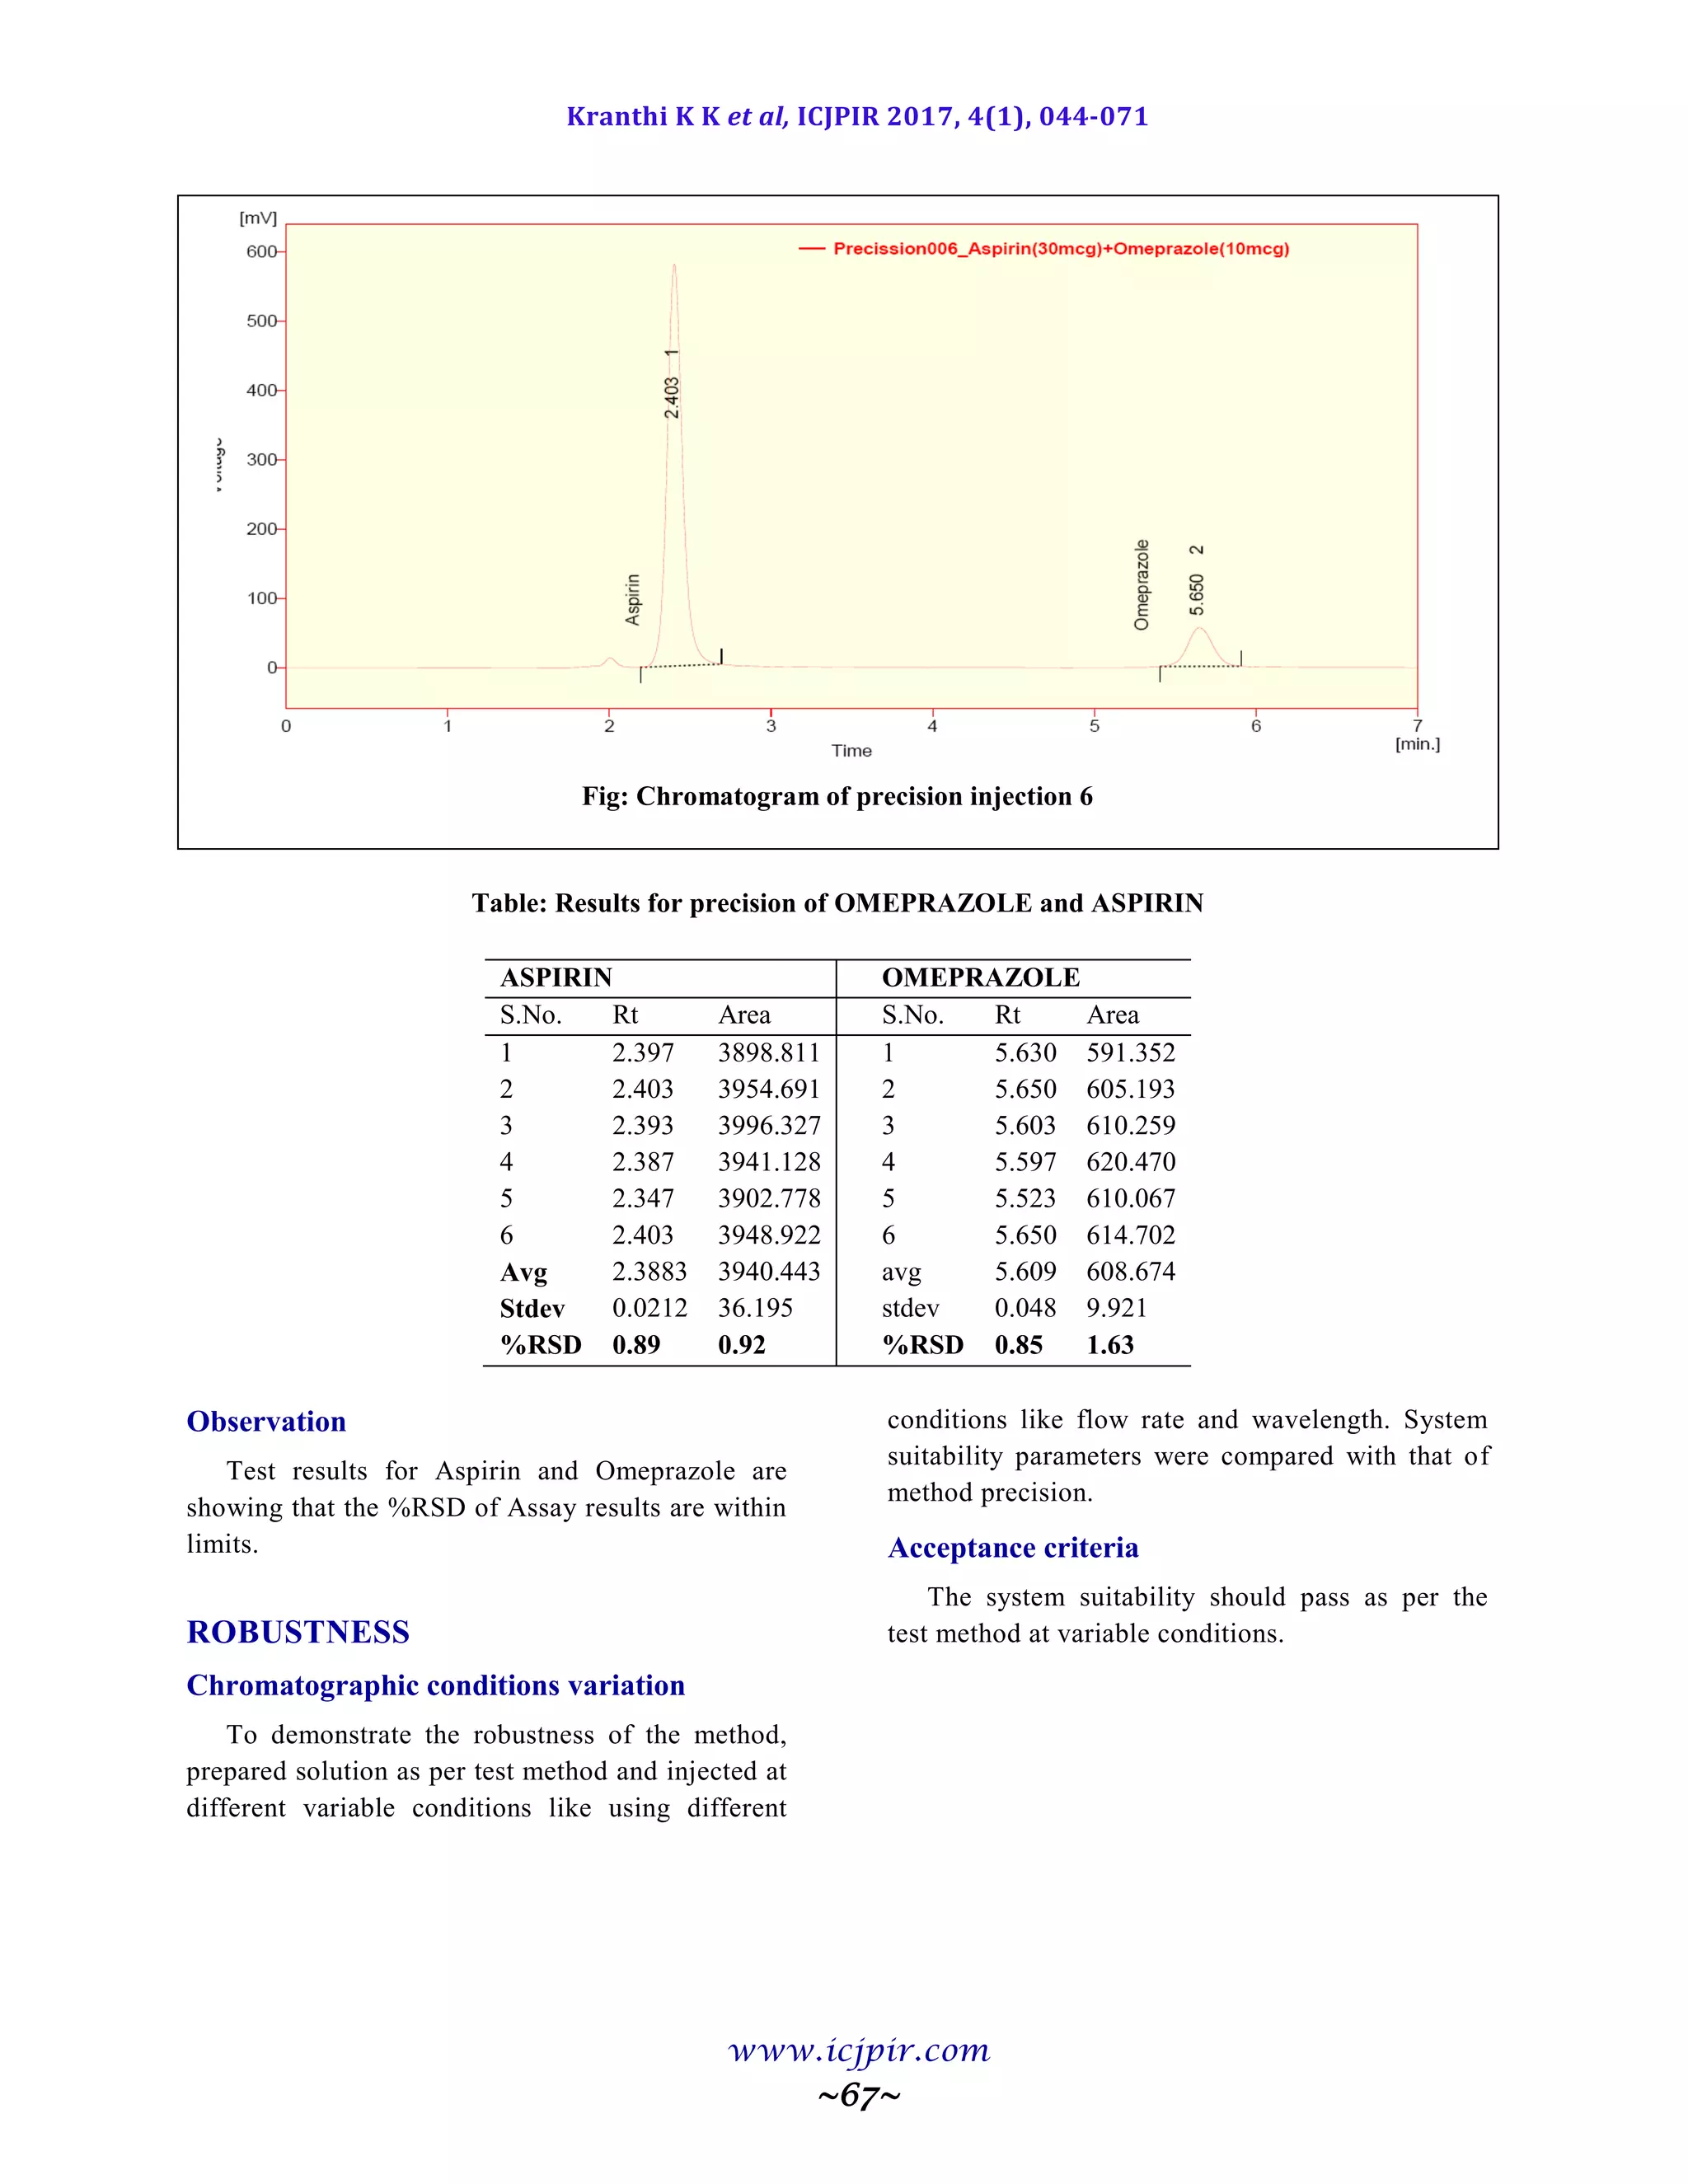
pharmaceutical additives. The method was found to be precise as indicated by the repeatability analysis, showing
%RSD less than 2. All statistical data proves validity of the methods and can be used for routine analysis of
pharmaceutical dosage form.
Keywords: Aspirin and Omeprazole, Reverse phase HPLC.
INTRODUCTION
A drug includes all medicines intended for
internal or external use for or in the diagnosis,
treatment, mitigation or prevention of disease or
disorder in human beings or animals, and
manufactured exclusively in accordance with the
formulae mentioned in authoritative books [1].
Pharmaceutical analysis is a branch of
chemistry involving a process of identification,
determination, quantification, purification and
separation of components in a mixture or
determination of chemical structure of compounds.
There are two main types of analysis – Qualitative
and Quantitative analysis [2].
Qualitative analysis is performed to establish
composition of a substance. It is done to determine
the presence of a compound or substance in a given
sample or not [4-6]. The various qualitative tests](https://image.slidesharecdn.com/icjpir-17-10544-71-191217111801/75/Analytical-method-development-and-validation-for-the-estimation-of-aspirin-and-omeprazole-using-RP-HPLC-method-1-2048.jpg)
![Kranthi K K et al, ICJPIR 2017, 4(1), 044-071
www.icjpir.com
~45~
are detection of evolved gas, limit tests [7-10],
color change reactions, determination of melting
point and boiling point, mass spectroscopy,
determination of nuclear half-life etc [3].
AIM AND PLAN OF WORK
Aim
To develop new RP HPLC method for the
simultaneous estimation of Aspirin and
Omeprazole pharmaceutical dosage form.
Plan of work
Solubility determination of Aspirin and Omeprazole
various solvents and buffers.
Determine the absorption maxima of both the
drugs in UV–Visible region in different
solvents/buffers and selecting the solvents for
HPLC method development.
Optimize the mobile phase and flow rates for
proper resolution and retention times.
Validate the developed method as per ICH
guidelines.
METHODOLOGY
Mobile Phase
A mixture of Ammonium Acetate
Buffer+Acetonitrile+Methanol were prepared. The
mobile phase was sonicated for 10min to remove
gases and filtered through 0.45µ membrane filter
for degassing of mobile phase.
Determination of Working Wavelength
(λmax)
In estimation of drug wavelength maxima is
used.. So this wavelength is used in estimation to
estimate drug accurately.
Preparation of standard stock solution of
aspirin
10 mg of ASPIRIN was weighed in to 100ml
volumetric flask and dissolved in Methanol and
then dilute up to the mark with methanol and
prepare 10 µg /ml of solution by diluting 1ml to
10ml with methanol, were scanned using UV-
Visible spectrophotometer.
Preparation of standard stock solution of
omeprazole
10 mg of OMEPRAZOLE was weighed and
transferred in to 100ml volumetric flask and
dissolved in methanol and then make up to the
mark with methanol and prepare 10 µg /ml of
solution by diluting 1ml to 10ml with methanol,
were scanned using UV-Visible spectrophotometer.
RESULTS AND DISCUSSIONS
Solubility studies
These studies are carried out at 25 0
C
Aspirin
Freely soluble in methanol,water and mixed
phosphate buffer.
Omeprazole
Freely soluble in ethanol and methanol, and slightly
soluble in acetone and very slightly soluble in water.
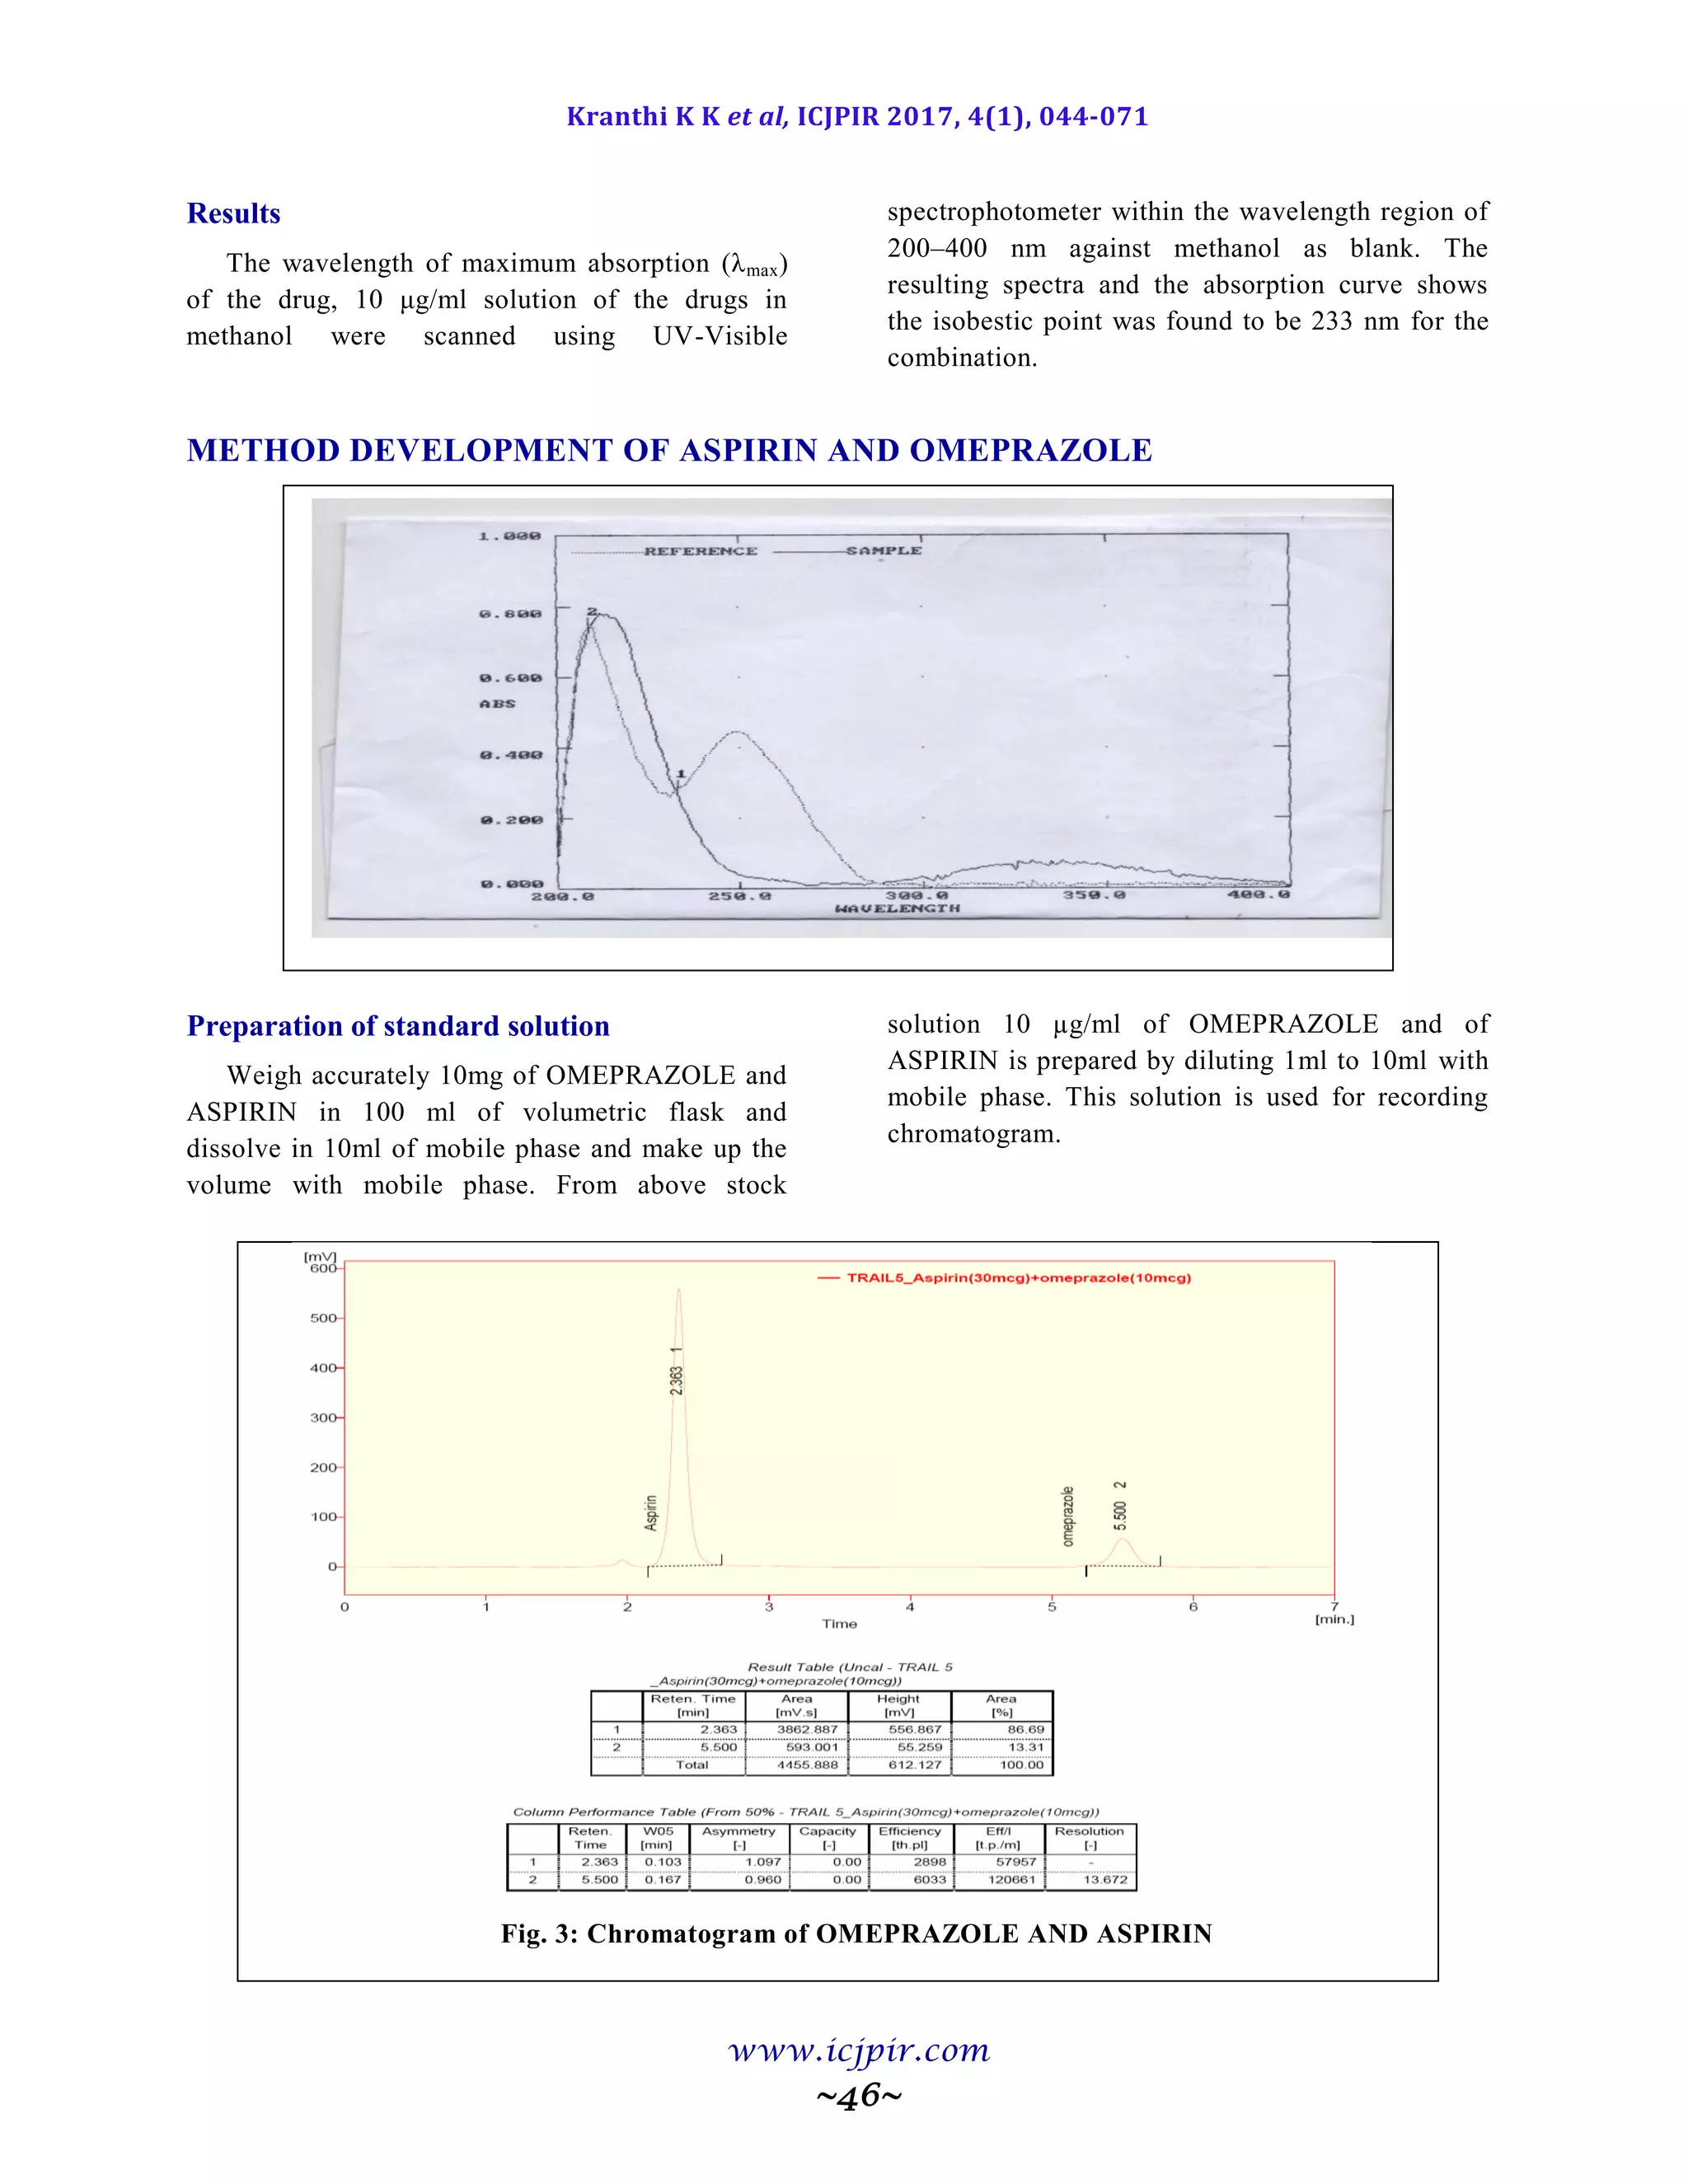
Wavelength determination
In simultaneous estimation of two drugs
isobestic wavelength is used. Isobestic point is the
wavelength where the molar absorptivity is the
same for two substances that are interconvertible.
So this wavelength is used in simultaneous
estimation to estimate both drugs accurately.
Preparation of standard stock solution of
aspirin
10 mg of ASPIRIN was weighed in to 100ml
volumetric flask and dissolved in Methanol and
then dilute up to the mark with methanol and
prepare 10 µg /ml of solution by diluting 1ml to
10ml with methanol, wavelength is found to be
238nm.
Preparation of standard stock solution of
omeprazole
10 mg of OMEPRAZOLE was weighed and
transferred in to 100ml volumetric flask and
dissolved in methanol and then make up to the
mark with methanol and prepare 10 µg /ml of
solution by diluting 1ml to 10ml with methanol,
wavelength is found to be 236nm.](https://image.slidesharecdn.com/icjpir-17-10544-71-191217111801/75/Analytical-method-development-and-validation-for-the-estimation-of-aspirin-and-omeprazole-using-RP-HPLC-method-2-2048.jpg)
![Kranthi K K et al, ICJPIR 2017, 4(1), 044-071
www.icjpir.com
~71~
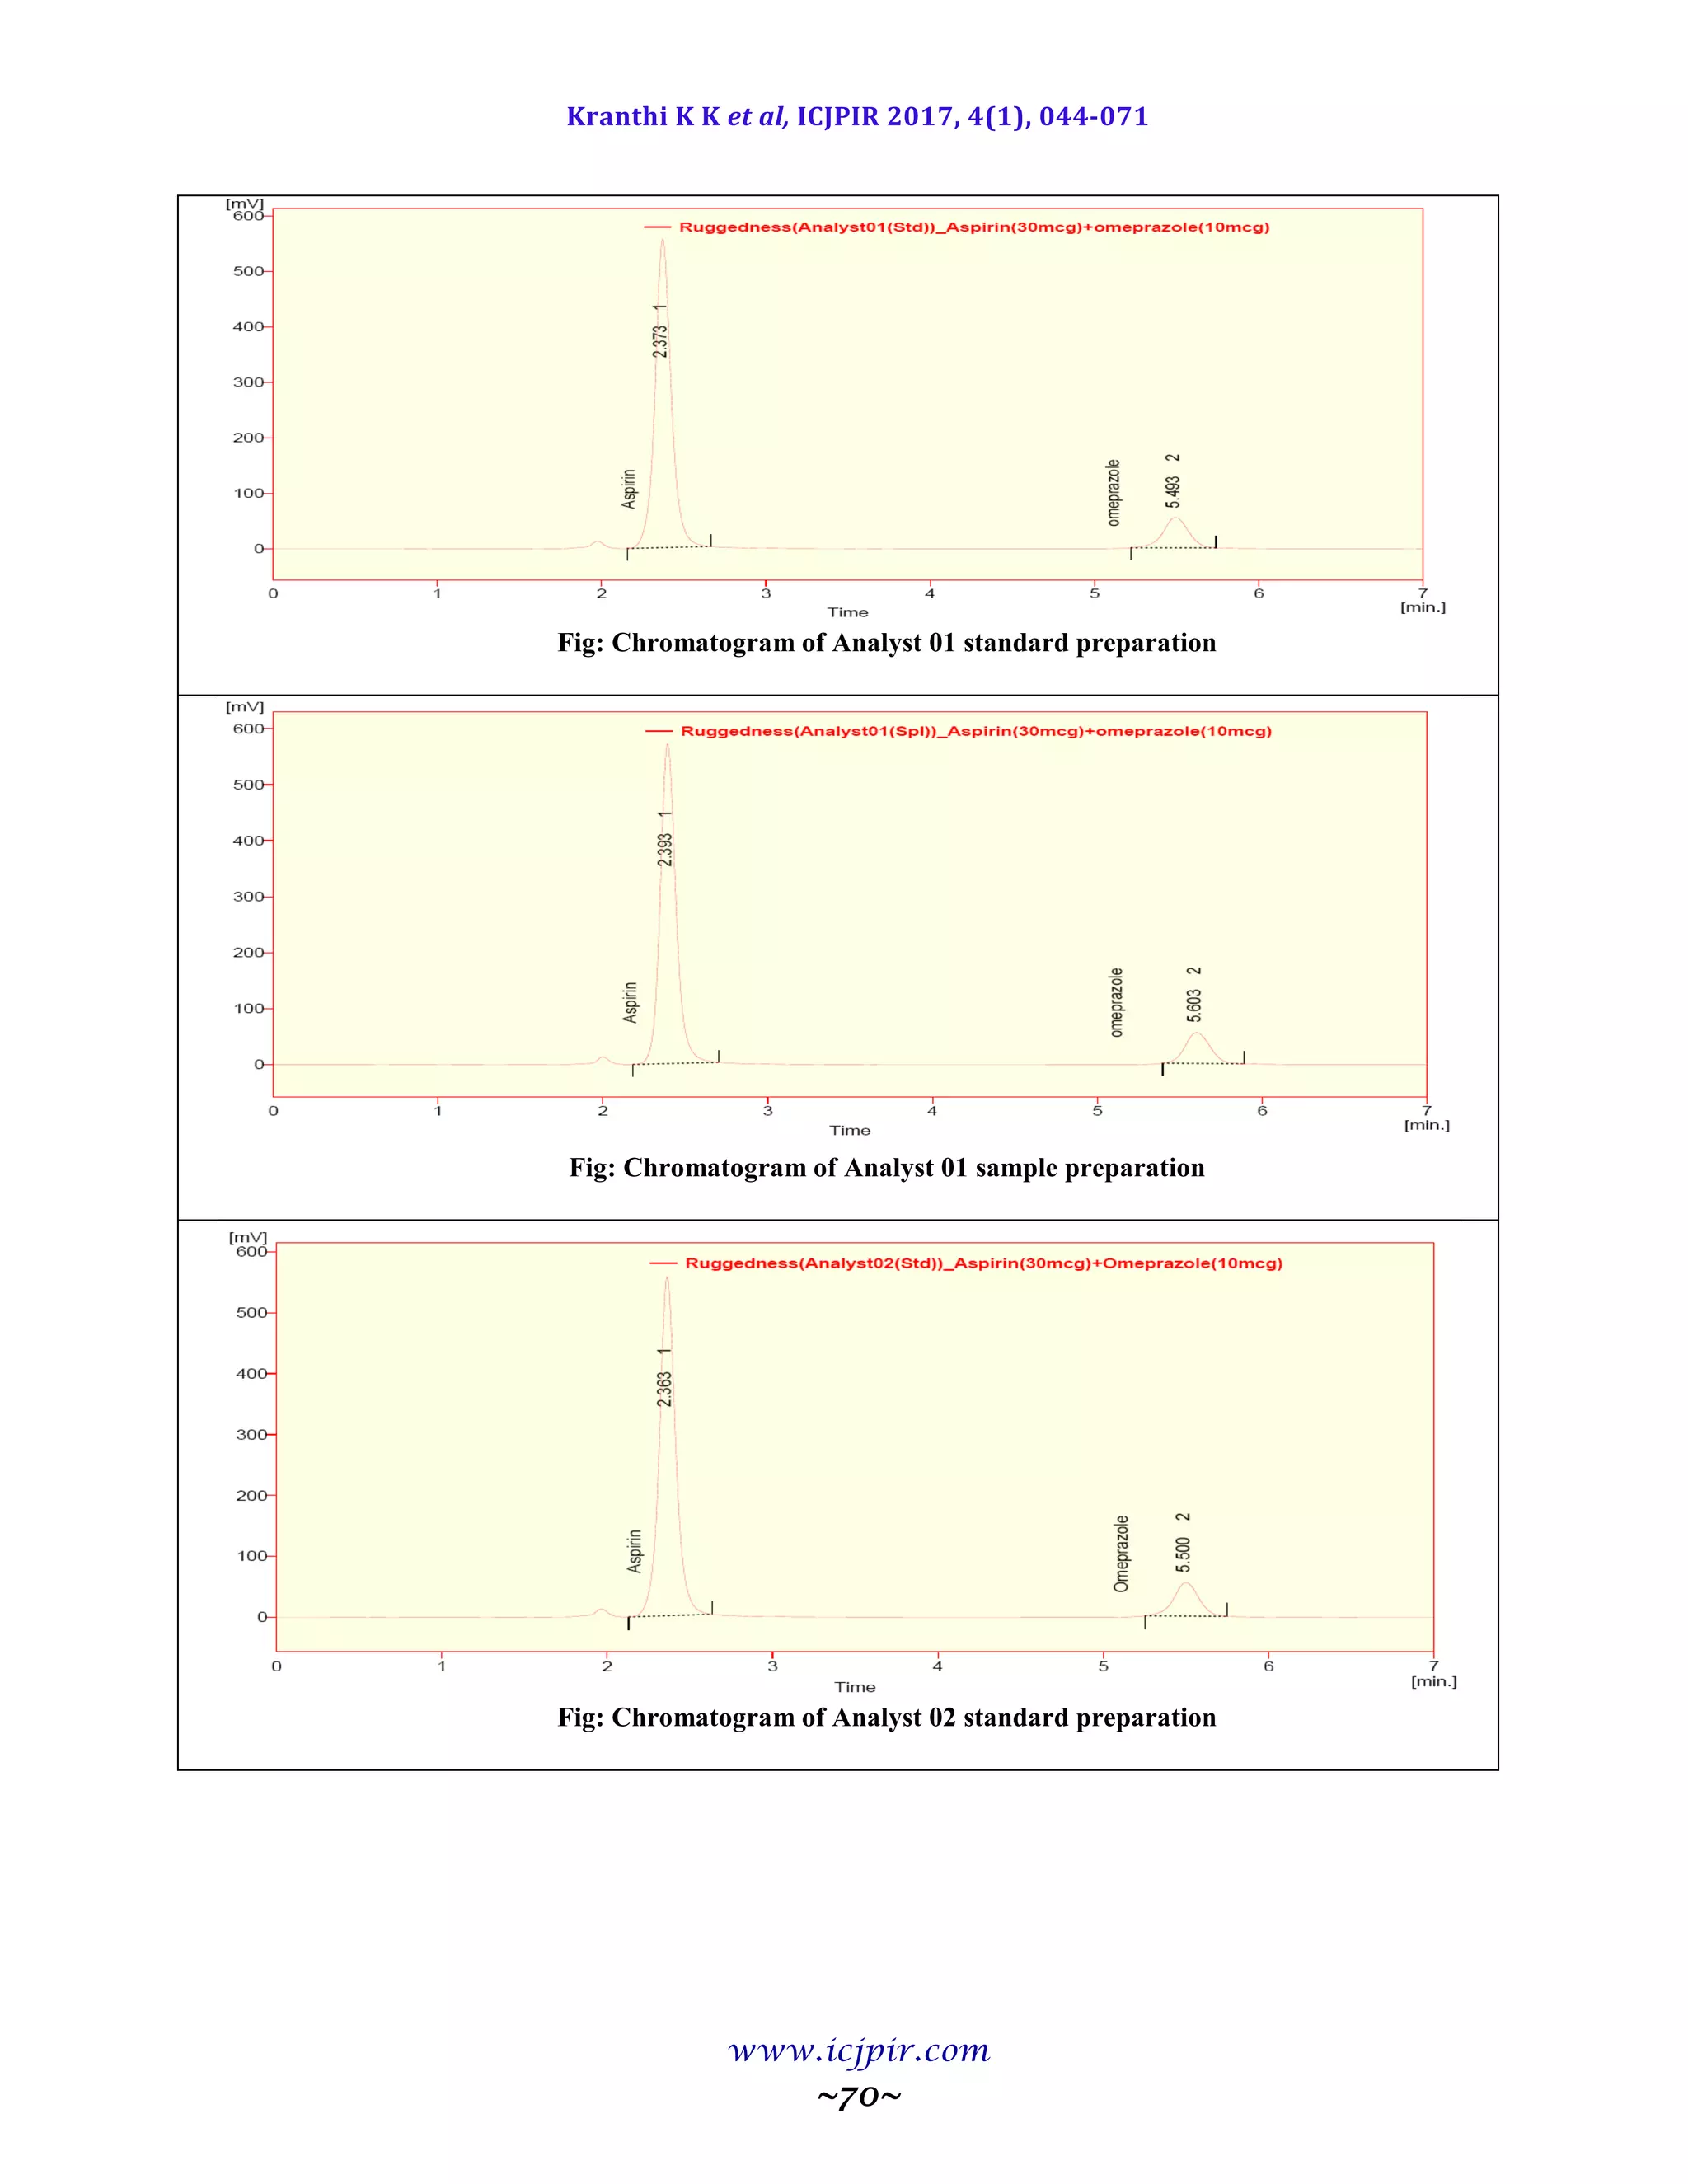
Fig: Chromatogram of Analyst 02 sample preparation
Table: Results for Ruggedness
ASPIRIN %Assay OMEPRAZOLE %Assay
Analyst 01 100.5 Analyst 01 98.9
Anaylst 02 99.5 Anaylst 02 100.6
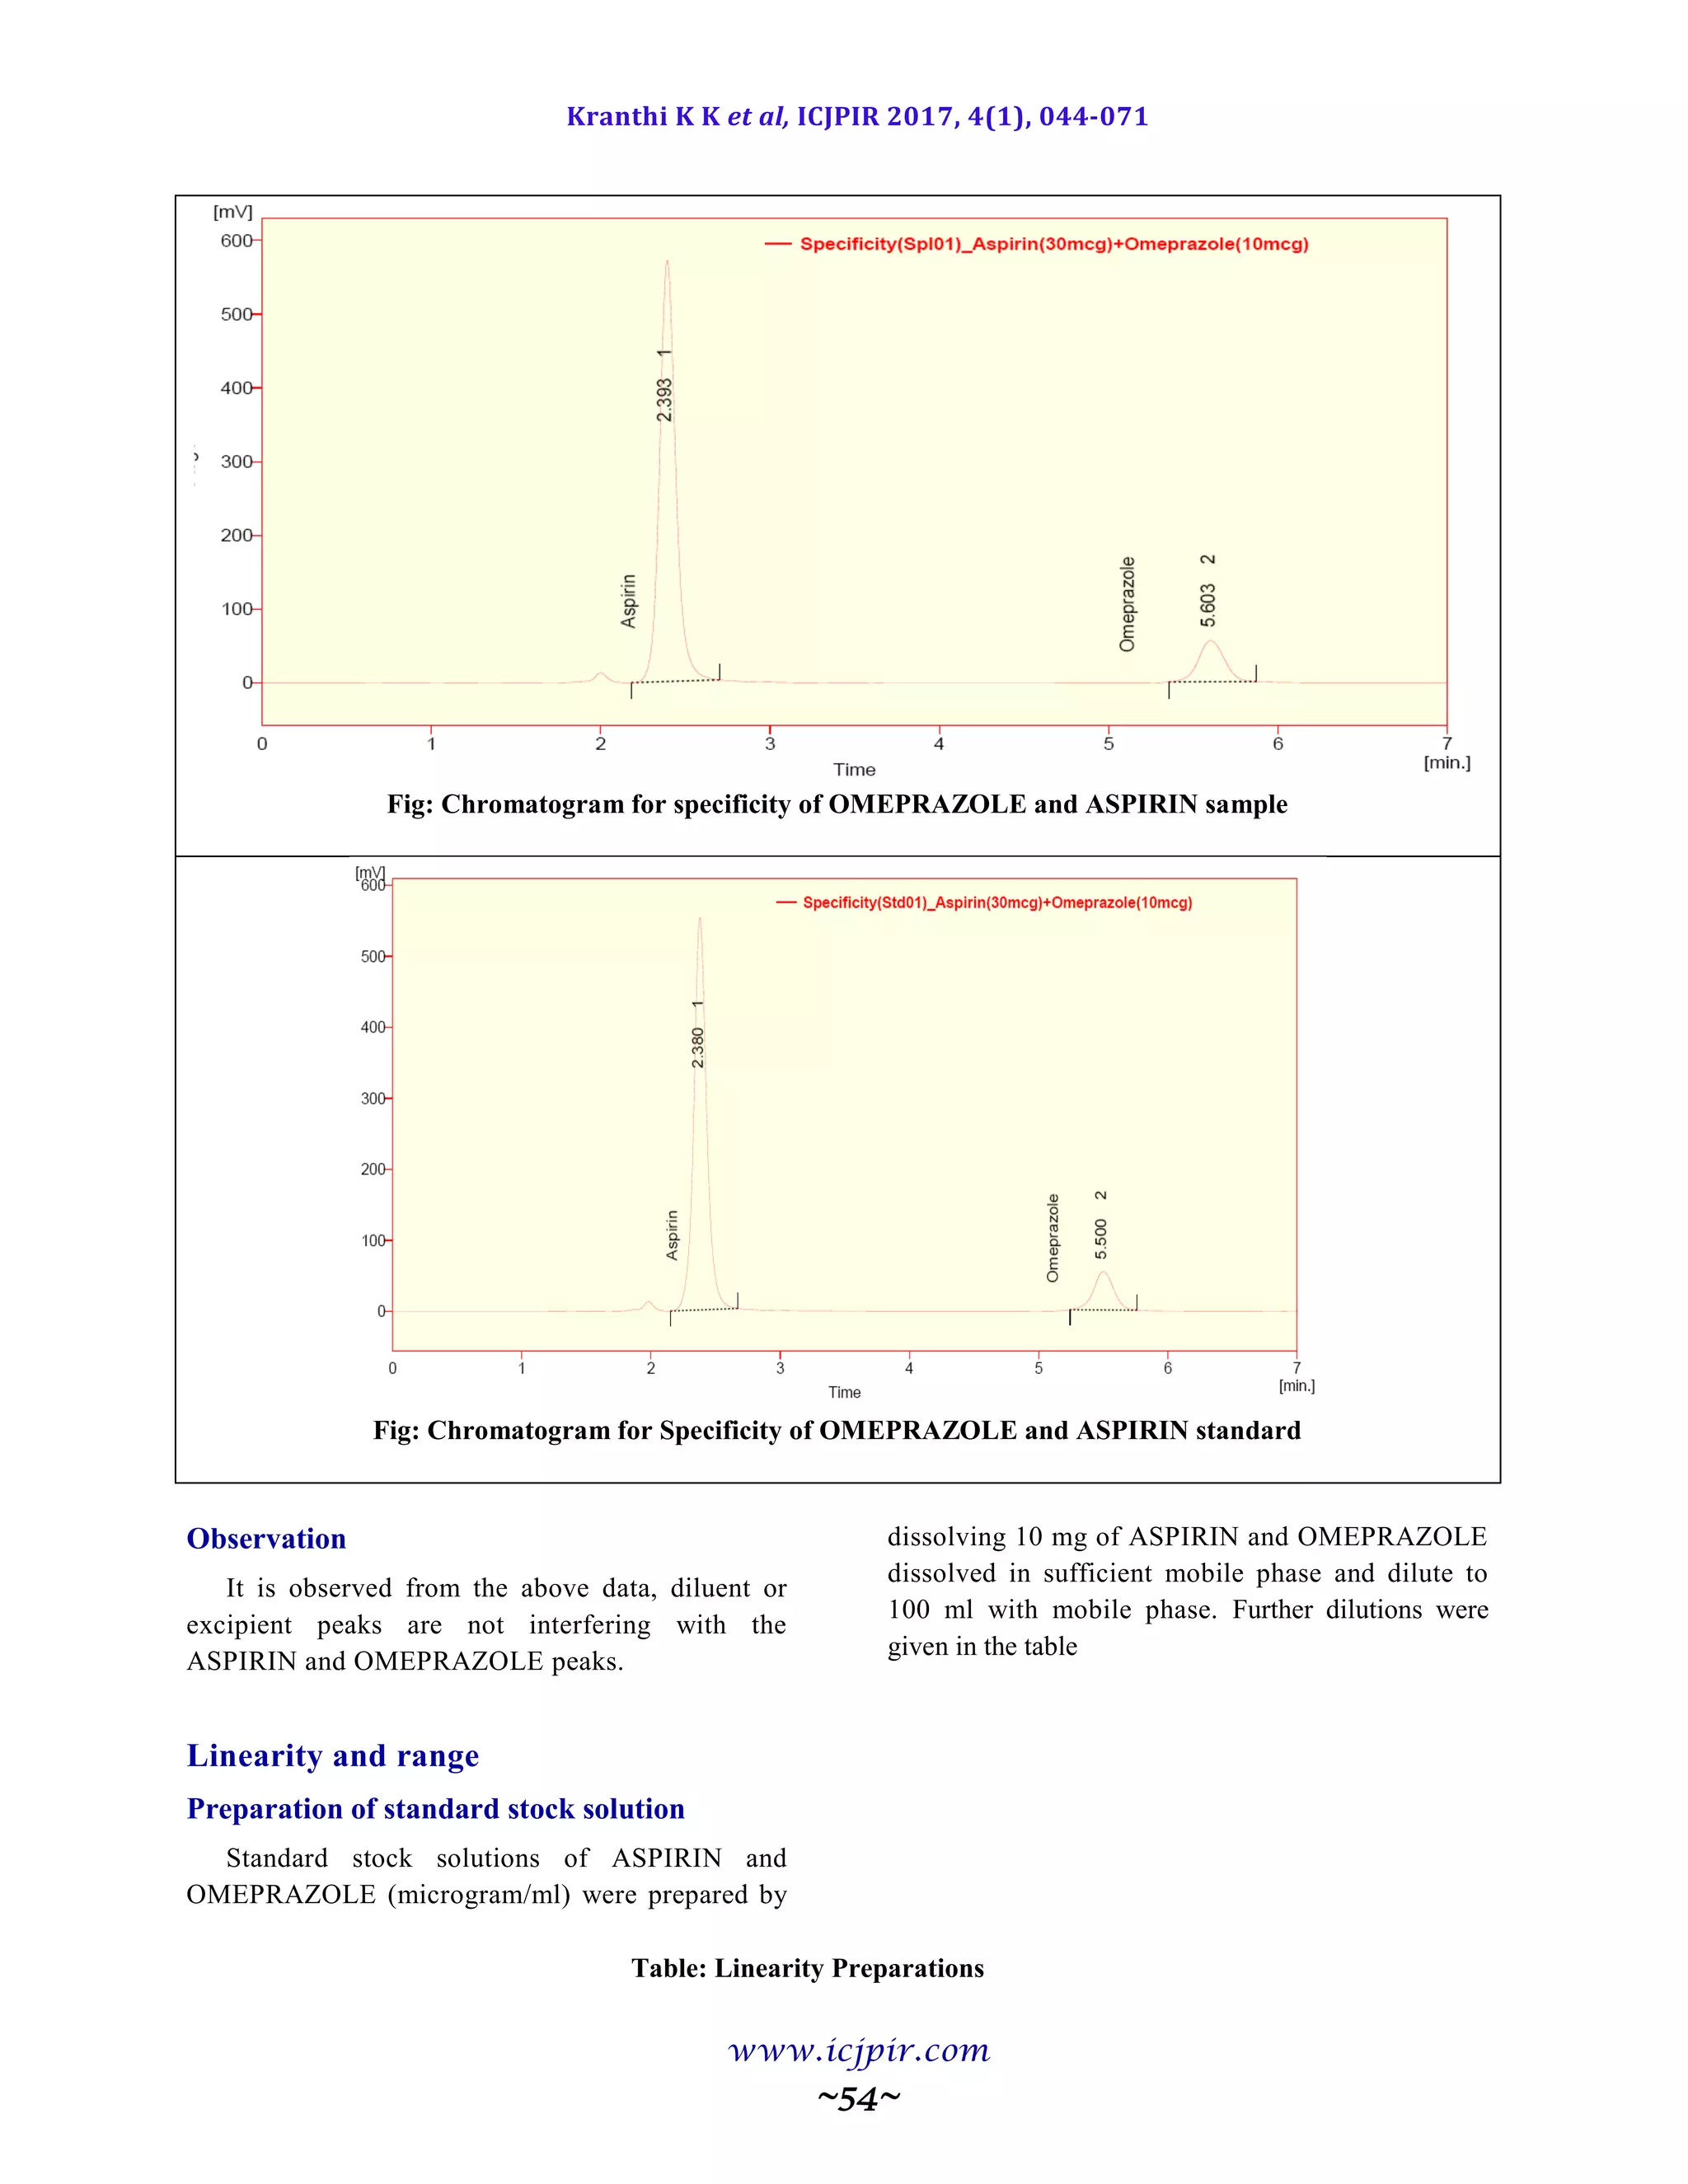
Observation
From the observation the between two analysts Assay values not greater than 2.0%, hence the method was
rugged.
BIBLIOGRAPHY
[1]. http://www.diabetes.co/diabetes/ (access 2010).
[2]. http://www.wikipedia.org/defination, Metformin/ (access 2010).
[3]. http://www.drugbank.com/Miglitol/ (access 2010).
[4]. Chiasson JL, Naditch L. The synergistic effect of miglitol plus metformin combination therapy in the treatment
of type 2 diabetes. Diadetes care 24(6), 2001, 989-94/Miglitol and Metformin.
[Available from http://care.diabetesjournals.org/content/24/6/989.full]
[5]. Indian Pharmacopoeia, Government of India, Ministry of Health and Family Welfare, Published by the
controller of publication, Delhi 1, 1996, 469.
[6]. Ramolia C, Dedania Z, Dedania R, Sheth NR, Vidyasagar G, Patel B and Bhatt KK. Simultaneous estimation
of metformin hydrochloride, rosiglitazone maleate and glimepiride in pharmaceutical dosage forms by RP-
HPLC method. Asian J Research Chem. 3(1), 2010, 83-86.
[Available from http://www.ajrconline.org/pdf/AJRC_3_1_2010_content.pdf]
[7]. Mubeen G, Khalikha N and Vimala MN. Spectrophotometric method for estimation of metformin
Hydrochloride. Int J ChemTech Res. 2(2), 2010, 1186-87.
[Availablefromhttp://lsphinxsai.com/s_v2_n2/CT_V.2NO.2/ChemTech_vol_2NO.2_pdf/CT=08 (813-817).pdf]
[8]. Dhable PN and Seervi CR. Simultaneous UV spectrophotometric method for estimation of gliclazide and
metformin hydrochloride in tablet dosage form. Int J ChemTech Res. 2(2), 2010, 813-17.
[Availablefromhttp://lsphinxsai.com/s_v2_n2/CT_V.2NO.2/ChemTech_vol_2NO.2_pdf/CT=69(1186-
1187).pdf]
[9]. Dai XM, Ning AN, WU IM, Li HY, Zhang QM. Development and validation of HPLC-UV-MS method for the
control of four anti-diabetic drugs. Acta Pharm Sin.45, 2010, 347-52.
[Available from http://lwenku.baidu.com/view/2c53334e852458fb770b5682.html]
[10]. Chittora NC, Shrivastava A, Jain A. New RP-HPLC method of miglitol in tablet dosage form including forced
degradation studies and estimation in spiked rabbit plasma. J Young Pharmacists. 1(4), 2009, 364-70.](https://image.slidesharecdn.com/icjpir-17-10544-71-191217111801/75/Analytical-method-development-and-validation-for-the-estimation-of-aspirin-and-omeprazole-using-RP-HPLC-method-28-2048.jpg)