SlideShare a Scribd company logo
1 of 14
Download to read offline
A Measure of Service Quality
for Retail Stores: Scale
Development and Validation
Pratibha A. Dabholkar
Dayle I. Thorpe
Joseph O. Rentz
University of Tennessee, Knoxville
Current measures of service quality do not adequately
capture customers'perceptions of service qualityfor retail
stores (i.e., stores that offer a mix of goods and services).
A hierarchical factor structure is proposed to capture
dimensions important to retail customers based on the
retail and service quality literatures as well as three sepa-
rate qualitative studies. Confirmatory factor analysis
based on the partial disaggregation technique and cross-
validation using a second sample support the validity of
the scale as a measure of retail service quality. The impli-
cations of this Retail Service Quality Scale for practi-
tioners, as well asfor future research, are discussed.
INTRODUCTION
The retail environment is changing more rapidly than
ever before. It is characterized by intensifying competition
from both domestic and foreign companies, a spate of
mergers and acquisitions, and more sophisticated and de-
manding customers who have greater expectations related
to their consumption experiences (Sellers 1990; Smith
1989). Consequently, retailers today must differentiate
themselves by meeting the needs of their customers better
than the competition. There is general agreement that a
basic retailing strategy for creating competitive advantage
is the delivery of high service quality (e.g., Berry 1986;
Hummel and Savitt 1988; Reichheld and Sasser 1990).
The most widely known and discussed scale for mea-
suring service quality is SERVQUAL, a scale designed to
Journal of the Academy of Marketing Science.
Volume 24, No. 1, pages 3-16
Copyright 9 1996 by Academy of Marketing Science.
measure five dimensions of service quality: tangibles,
reliability, responsiveness, assurance, and empathy. Al-
though SERVQUAL has been empirically tested in a num-
ber of studies involving "pure" service settings (e.g.,
banking, long-distance telephone service, securities bro-
kerage, and credit card service), it has not been success-
fully adapted to and validated in a retail store environment.
In fact, little research has been conducted in retail settings,
defined here as stores that offer a mix of merchandise and
service. A retail store experience involves more than a
nonretail service experience in terms of customers negoti-
ating their way through the store, finding the merchandise
they want, interacting with several store personnel along
the way, and returning merchandise, all of which influence
customers' evaluations of service quality. Thus, although
measures of service quality for pure service environments
and for retail environments are likely to share some com-
mon dimensions, measures of retail service quality must
capture additional dimensions. Our purpose is to investi-
gate the dimensions of service quality in a retail environ-
ment and to develop and validate a scale to measure retail
service quality.
EXPLORING POSSIBLE
FACTOR STRUCTURES FOR
RETAIL SERVICE QUALITY
An examination of the retail literature offers little to
support a theory-based factor structure of retail service
quality. The retail literature focuses on service quality at
either the integrated or the attribute level; there is a lack of
discussion of service quality at the factor (or dimension)
level. At the integrated level, Westbrook (1981) suggests
that two broad categories of retailer-related experiences
4 JOURNAL
OFTHEACADEMYOFMARKETINGSCIENCE WINTER1996
are important to the customer: (1) in-store experiences and
(2) experiences related to the merchandise. In-store expe-
riences include interactions with store employees as well
as the ease of walking around the store. Experiences re-
lated to merchandise include quality and availability of
merchandise. Although we agree that these experiences are
important to retail customers, both categories appear to
encompass more than one factor or dimension. In addition,
there may be an overlap between the two categories. For
example, merchandise displays could be viewed both as
in-store experiences and experiences related to merchan-
dise. Viewing service quality at this integrated level does
little to suggest the separate and critical dimensions of
retail service quality that would be useful to retailers and
researchers.
At the attribute level, researchers suggest that store
layout and the quality of merchandise are important to the
customer's perception and evaluation of retail stores
(Gutman and Alden 1985; Hummel and Savitt 1988;
Mazursky and Jacoby 1985; Oliver 1981). Store layout
includes the ease of locating desired merchandise and the
ease of moving around in the store. Westbrook (1981 ) and
Mazursky and Jacoby (1985) report that other important
criteria on which customers evaluate retail stores are the
credit and charge account policies of the store and the ease
with which stores refund or exchange merchandise. Baker,
Grewal, and Parasuraman (1994) suggest that store envi-
ronment encompassing ambient attributes (e.g., music),
design attributes (e.g., physical facilities), and social attri-
butes (e.g., customer responsiveness of service providers)
are important to customers of retail stores in evaluating
service quality. Another attribute identified as important to
retail shoppers is ease of parking (Oliver 1981). Finally,
Westbrook (1981) suggests that customers are sensitive to
a service provider's willingness to promptly attend to
problems or complaints. Although it is useful to review the
retail literature to develop a list of attributes that are
important to customers in evaluating retail service experi-
ences, there is little support to suggest how these attributes
may be combined into a few critical dimensions of retail
service quality.
Because of the weak theoretical support for a factor
structure provided by the retail literature, a review of the
service quality literature was conducted to suggest possi-
ble factors for retail service quality. As mentioned earlier,
researchers have attempted to test and/or adapt the
SERVQUAL instrument in various settings. These settings
include a health care setting (Babakus and Mangold 1989),
business-to-business services (Brensinger and Lambert
1990), a dental school patient clinic, business schoolplace-
ment center, tire store, and acute care hospital (Carman
1990), a utility company (Babakus and Boller 1991),
department stores (Finn and Lamb 1991), health care
(Bowers and Swan 1992), banking, pest control, dry clean-
ing, and fast food (Cronin and Taylor 1992), department
stores (Guiry, Hutchinson, and Weitz 1992), the computer
software industry (Pitt, Oosthuizen, and Morris 1992), and
banking (Spreng and Singh 1993). In general, these studies
do not support the factor structure posited by Parasuraman,
Zeithaml, and Berry (1988). See Table 1 for a review of
the methodology and results from these studies.
The studies of particular interest to this research are
those conducted in a retail setting. Carman (1990) tested
SERVQUAL mainly in pure service settings (dental school
patient clinic, business school placement center, acute care
hospital); the one exception was a tire store, an example of
a retailer offering a mix of merchandise and services.
Carman found nine factors of service quality, concluded
that the five dimensions identified by Parasuraman et al.
(1988) were not generic, and suggested that the instrument
be adapted by adding items or factors as pertinent to
different situations.
Finn and Lamb (1991) tested SERVQUAL in four
different types of retail stores, ranging from "stores like
Kmart" to "stores like Neiman Marcus." Using confirma-
tory factor analysis, Finn and Lamb were unable to find a
good fit to the proposed five-factor structure and con-
cluded that SERVQUAL, without modification, could not
be used as a valid measure of service quality in a retail
setting. However, they did not offer an alternative accept-
able structure or measure.
In an unpublished paper, Guiry et al. (1992) modified
the original 22-item SERVQUAL to a 51-item instrument
by dropping 7 items and adding 36 new items designed to
measure service attributes at the retail store level. Explora-
tory factor analysis revealed seven dimensions: (1) personal
service during interaction with employees, (2) merchan-
dise assortment, (3) store transaction procedure reliability,
(4) employee availability in the store before interaction,
(5) tangibles, (6) store service policy reliability, and
(7) price. Although this study represents a good start
toward the development of a service quality scale for the
retail setting, the research was based on exploratory factor
analysis and not on a theory-based factor structure. Addi-
tionally, the inclusion of price in a servicequality construct
explication is unusual. Although we recognize that price is
an important determinant of store patronage, we view it as
distinct from service quality.
Finally, in a study on customer evaluations of banking,
Spreng and Singh (1993) performed a confirmatory factor
analysis of SERVQUAL and found a poor fit for the five
dimensions. They found a lack of discriminant validity
between responsiveness and assurance and noted that al-
though modification indices were high, there was no clear
indication for ways to improve the model fit.
TRIANGULATION OF
QUALITATIVE RESEARCH TECHNIQUES
Given the lack of a theory-based factor structure from
the retail literature and the fact that SERVQUAL has not
been supported or successfully adapted to retailing, it was
deemed necessary to conduct further research to gain an
understanding of the dimensions of retail service quality.
To accomplish this end, qualitative research was con-
ducted using three different qualitative methodologies--
phenomenological interviews, exploratory depth
Dabholkaret al. / RETAILSERVICEQUALITY
TABLE 1
Summary of SERVQUAL Replication Studies
Study Instrument Analysis FactorStructure
Babakusand Mangold(1989)
Carman(1990)
Brensingerand Lambert
(1990)
Finn andLamb (1991)
Babakusand Boiler (1991)
Pitt, Oosthuizen,and Morris
(1992)
Guiry,Hutchinson,and
Weitz(1992)
Croninand Taylor(1992)
Bowersand Swan (1992)
Sprengand Singh(1993)
15of original22 items
Modificationsof SERVQUAL
(using 12 to 21 of the original
itemsin each case)
Allof original22 items
51 items(15 fromthe original
22 itemsplus 36 addeditems)
Allof original22 items
Focus groups
Allofthe original22 items
Exploratoryfactoranalysis
Principalaxis factoranalysis
followedby obliquerotation
Principalaxis factoranalysis
followedby obliquerotation
Confirmatoryfactoranalysis
Principalaxis factoranalysis
followedby obliquerotation
as well as confirmatoryfactor
analysis(CFA)
Principalcomponentsfactor
analysisfollowedby promax
rotation
Exploratoryfactoranalysis
(1) Confirmatoryfactoranalysis
(CFA);(2) OBLIMINoblique
factorrotation
Qualitativemethodologies
Confirmatoryfactoranalysis
One meaningfulfactorwas found.Could
not identifythe a priorifive-factorstructure.
Five to nine factorswere identified.
A five-factorstructurewas found,but only
four had eigenvahies> 1.
The five-factorstructurehad a poor fit. No
other structureswere analyzed.
The five-factorstructurewas not supported
and no other structureswere analyzed.
CFAresultedin a two-factorstructure.
The only studyto obtaina five-factorstructure.
However,the factorswere differentfrom
SERVQUALwith reliabilityand
responsivenessloadingon one factor.
A seven-factorstructurewas found.
(1) CFAresultedin a unidimensionalfactor;
(2) The five-factorstructurehad a poor fit.
Identifiedthe fiveoriginalfactors,plus four
others.
The five-factorstructurehad a poor fit.
Combiningresponsivenessand assurance
intoone factordid not significantly
improvethe fit.
interviews, and tracking the customer through the store to
monitor evaluations of the shopping experience. The ob-
jective was to use a triangulation of research techniques to
gain further insights into factors important to customers of
retail stores in evaluating service quality.
The first study consisted of three phenomenological
interviews conducted to assign meaning to the shopping
experience as the participant sees it, not as the researcher
perceives it. We used the participants' own words in fol-
low-up questions to probe for important issues. This study
found that customers were most concerned about store
layout as it pertained to walking around the store and
finding what they want, treatment by service employees in
terms of being helped and feeling comfortable, ease of
conducting exchanges and refunds and of resolving prob-
lems, and store policies regarding merchandise quality,
parking, and credit card acceptance.
A second study employed six depth interviews to dis-
cover relevant determinants of the shopping experience
not yet identified. Some of the findings of this study were
similar to the first one. For example, customers were
concerned about the ease of moving through the store, ease
of finding what they were looking for, helpfulness of store
employees, ease of returning merchandise, and store poli-
cies regarding credit. In addition, the depth interviews
revealed that the appearance of the store and its facilities
(e.g., restrooms and fitting rooms) was important to cus-
tomers. These participants also mentioned that they
expected the service to be good and anything that was
promised to be delivered.
Finally, the third qualitative study used a "tracking"
method to monitor the thought processes of three custom-
ers as they evaluated a specific shopping experience. A
portable tape recorder with a lavalier microphone was
inconspicuously attached to the participant's clothing. As
they moved through the store, interacted with merchandise
and store employees, and made a purchase decision, the
participants spoke aloud their thoughts, observations, and
reactions, which were tape-recorded. By unobtrusively
"monitoring" the customer's experience in the store, infor-
mation regarding identified components of the shopping
experience and the customers' interactions with these ele-
ments was collected without significantly altering the
natural flow of the experience. These participants com-
mented on store appearance, store layout, helpfulness of
service employees, availability of service personnel at the
cash registers, and quality of merchandise.
Because there is general agreement in the literature
about the conceptual definition of service quality, in our
qualitative studies we asked general questions about expe-
6 JOURNAL
OFTHEACADEMYOFMARKETINGSCIENCE WINTER1996
FIGURE 1
Proposed Hierarchical Structure for Retail Service Quality
Pt_EJINP
R
Y
2
1
1
p'
NOTE:Itmaybenotedthattheindicatornumbersabovedonotrepresentthe orderin whichtheseitemswerepresentedin thequestionnaire,thatis, the
itemswerenotgroupedaccordingto dimensionsbutinsteadwerescrambled.Theyarenumberedhereto matchtheorderin the appendix.
riences with the retail stores. This is a very common
approach in qualitative research. We then selected those
aspects of the consumers' experience that were consistent
with the generally accepted conceptual understanding of
service quality in the literature and used these (along with
the literature) to suggest dimensions of retail service qual-
ity and items for measuring retail service quality. For
example, if customers mentioned courteousness of the
service provider and the literature also supported this
notion, we included it. If they mentioned price, we ex-
cluded it because price is not part of the generally accepted
understanding of service quality in the literature.
PROPOSED FACTOR STRUCTURE
FOR RETAIL SERVICE QUALITY
Combining findings from our qualitative research with
the review of the retail literature and of SERVQUAL, we
propose that retail service quality has a hierarchical factor
structure (see Figure 1). The rationale for the hierarchical
factor structure is as follows. Previous studies in which
SERVQUAL had not been supported found high intercor-
relations among items across factors, and several studies
had found only one factor. (An initial test of SERVQUAL
with our data also showed high correlations among items
across factors.) These instances are strongly suggestive of
the presence of a higher order factor. Parasuraman, Berry,
and Zeithaml (1991) and Parasuraman, Zeithaml, and
Berry (1994b) discuss these problems with dimensionality
and intercorrelations using SERVQUAL and suggest that
future research on service quality should investigate un-
derlying causes and implications of empirical correlations
among dimensions of service quality. Reviewing our
qualitative research, there did appear to be a common
theme throughout the interviews regarding overall retail
service quality. Similarly, the retail literature suggests that
customers form evaluations of retail quality both at the
attribute and at the integrated level. Based on these various
sources, we propose that customers think of retail service
quality at three different levels--a dimension level, an
overall level, and a subdimension level. We propose that
five dimensions--physical aspects, reliability, personal
interaction, problem solving, and policy--are central to
service quality; we expect them to be distinct but highly
correlated. (The five basic dimensions are based on the
literature review and our qualitative research as explained
below and are also strongly suggested by the correlation
matrix in our initial data analysis.) Because they share an
underlying theme, we expect a common higher order factor
to be present, which we call (overall) retail service quality.
Integrating our qualitative research, initial empirical
analysis, and the retail literature, it is observed that some
dimensions are more complex (as explained below) in that
they have more than one component to them. In these
cases, we expect the dimensions to have subdimensions
that combine related attributes into subgroups.
The first dimension we propose is physical aspects.
This dimension has a broader meaning than does the
SERVQUAL (Parasuraman et al. 1988) or the Guiry et al.
(1992) tangibles dimension. In addition to the appearance
of the physical facilities, it encompasses the conve-
nience offered the customer by the layout of the physical
facilities. Both the retail literature and our qualitative
research suggest that there are two subdimensions with
regard to the physical aspects of the store. Retail literature
suggests that store appearance is important to retail cus-
tomers (e.g., Baker et al. 1994), a notion supported by the
Dabholkaretal./ RETAILSERVICEQUALITY 7
findings of our depth interviews and our customer tracking
studies. For example, the respondents in the depth inter-
views referred to the cleanliness of the store, the general
appearance of the store, and the appearance of public
facilities. In addition, the retail literature suggests that
customers value the convenienceof shopping that physical
aspects, such as store layout, offer them (Gutman and
Alden 1985; Hummel and Savitt 1988; Mazursky and
Jacoby 1985; Oliver 1981). This idea was supported by all
three of our qualitative studies. For example, participants
mentioned the ease of finding merchandise within the store
("I am familiar with the arrangement of Inerchandise, I
know where to find it, it expedites the process"), and ease
in moving through the aisles and racks of merchandise ("I
like to be able to walk around between the racks without
knocking things over").
Our second proposed dimension is reliability, which is
similar to the SERVQUAL reliability dimension, except
that it has two subdimensions and a couple of other vari-
ations. Our depth interviews revealed that customers view
reliability as a combination of keeping promises ("if they
tell me Thursday, then it better be there on Thursday") and
"doing it right" ("I just like people to be efficient and
prompt, you know, do what I need to be done and get me
out of there"). This idea of subdimensions interestingly
is supported by an examination of the items used in
SERVQUAL to measure reliability. Some ofthe items refer
to promises and others to doing the service right. Another
variation in our reliability dimension, as compared to
SERVQUAL, is that we view the availability of merchan-
dise (Westbrook 1981) as a measure of the reliability
dimension and incorporate it into our doing-it-right subdi-
mension. Our depth interviews also revealed that custom-
ers value merchandise availability as reflecting the
dependability of the store ("good service is stocking what
I want"). A third variation is that although SERVQUAL
views problem solving as part of reliability, we see it as a
separate dimension. These variations also distinguish our
reliability dimension from Guiry et al.'s (1992) procedural
reliability.
The third dimension we propose is personal interac-
tion. Although this sounds similar to Guiry et al.'s
(1992) personal service dimension, we envision two
subdimensions--service employees inspiring confidence
and being courteous/helpful. We believe these subdimen-
sions are very closelyrelated and capture how the customer
is treated by the employee. The rationale for this dimension
is as follows. To begin, we noticed that the SERVQUAL
dimensions of responsiveness and assurance appeared to
be related and that some items from SERVQUAL's empa-
thy dimension also seemed to overlap with this factor. This
notion has support in the numerous studies that have tested
SERVQUAL (Babakus and Boiler 1991; Babakus and
Mangold 1989; Carman 1990; Guiry et al. 1992; Pitt et al.
1992) as well as in a working paper by the authors of
SERVQUAL (Parasuraman et al. 1994b). The second rea-
son for suggesting one main dimension of personal inter-
action with two underlying subdimensions emerged from
our qualitative research. Respondents in the phenomeno-
logical interviews consistently indicated the importance of
feeling confident about shopping at a particular store.
Comments included, "I do not feel intimidated by anything
at the store," "I feel very comfortable shopping at the
store," and "I feel free to shop and look without feeling
pressured." These comments evoke the assurance dimen-
sion of SERVQUAL, but it is not proposed as a separate
dimension because the comments were interwoven with
comments about courteousness/helpfulness, and both as-
pects (or subdimensions) appeared to be part of a larger
whole, which we called the personal interaction dimension
because all these comments relate to the personal interac-
tion between the customer and the service employee in the
store. Support for the courteousness/helpfulness subdi-
mension came from all three qualitative studies. Partici-
pants in the depth interviews and customer tracking
specifically mentioned helpfulness of store employees.
Participants in the phenomenological interviews indicated
the importance of this subdimension by comments such as,
"people are friendly there," "I want to have access to
someone that can help me," "the sales associates make me
feel that they're there, if I need them," and "I want to be
able to pick up the phone and have access to someone that
can help me."
We introduce a new fourth dimension, problem solving,
which addresses the handling of returns and exchanges as
well as of complaints. Although this dimension would also
involve interaction between the customer and the em-
ployee, it is specificallyrelated to the handling of problems
and therefore merits a separate dimension. Given that
service recovery is being recognized as a critical part of
good service (Hart, Heskett, and Sasser 1990; Kelley and
Davis 1994), we expect that recognizing and resolving
problems should emerge as a separate factor in customer
evaluation. Westbrook (1981) found that customers were
quite sensitive to how serviceproviders attend to problems
and complaints. Westbrook, along with Mazursky and
Jacoby (1985), also mentions that the ease of returning and
exchanging merchandise is very important to retail cus-
tomers. Our own qualitative research supported these find-
ings. Participants in the phenomenological interviews
commented that this aspect was important to them ("I like
stores that are very good at taking back returns" and "I like
to bring something home and think about it and feel free
to return it"). Participants in the depth interviews con-
curred ("I do not buy anything that I cannot return").
Our fifth dimension, policy, is again suggested both by
the retail literature and our qualitative research. This
dimension captures aspects of service quality that are
directly influenced by store policy.When customers evalu-
ate whether a store has convenient hours, for example, this
is viewed as whether the store's policy is responsive to
customers' needs. Westbrook (1981) and Mazursky and
Jacoby (1985) report that an important criterion on which
customers evaluate stores is the credit and charge account
policies of the store. Customers also appear to value park-
ing availability for retail shopping (Oliver 1981). These
findings were supported in all three of our qualitative
studies. Participants referred to the quality of merchandise
("I'm interested in the quality of clothes"), convenient
parking ("I can get a fairly close parking spot"), credit card
8 JOURNAL
OFTHEACADEMYOFMARKETINGSCIENCE WINTER1996
usage ("I love having a credit card rather than writing a
check, it's a very convenient tool for me").
To summarize, we propose a hierarchical factor struc-
ture for retail service quality with five basic dimensions,
with overall service quality as a second-order factor, and
with three of the five dimensions having two subdimen-
sions (see Figure 1). Although this hierarchical structure
can be divided into three models for the purpose of expli-
cation, the model with the five basic dimensions, the model
with the second-order factor, and the model with the sub-
dimensions are not separate models per se, but special
cases of the generalized model shown in Figure 1. For
e.xample, the model with the five dimensions can be
viewed as the most basic. The subdimensions model gets
more specific in terms of three of the dimensions, whereas
the second-order model captures the common variance
among the dimensions in a meaningful way.
ITEM GENERATION AND
SCALE DEVELOPMENT
Our proposed measure of retail service quality is a
28-item scale, consisting of 17 items from SERVQUAL
and 11 items developed from the literature review and our
qualitative research (see appendix). To generate items to
measure our five main dimensions, we first scrutinized the
22 items in the SERVQUAL scale. Although we propose
a different factor structure, we felt comfortable with using
modified SERVQUAL items in our scale, because they are
based on extensive qualitative research conducted by
Parasuraman et al. (1988). Items that appropriately cap-
tured the essence of the factors were retained in our scale,
whereas items that were deemed inappropriate in terms of
wording/meaning were not included. (An initial test of the
SERVQUAL items revealed that this latter set of items had
high modification indices as well.)
A total of five items from SERVQUAL were dropped.
The item" will have the customer's best interests
at heart" and the item "The employees o f under-
stand the specific needs of their customers" were deemed
to be inappropriate. Scrutiny of these items suggested that
the phrases "best interests at heart" and "understand the
specific needs" might be vague and confusing to respon-
dents. Another item, "Employees at _ _ are neat-
appearing," was not included because the use of the words
"neat appearing" is not part of everyday language and may
mean different things to different people. The item "Em-
ployees in _ _ are always willing to help customers,"
was not used after an examination of the wording revealed
that the item was somewhat confounding, suggesting
both personal interaction ("willing to help") and reli-
ability ("always"). Finally, the item" has employees
who give customers personal attention" was not used,
because we realized that another item, " gives
customers individual attention," essentially captured the
same aspect of service quality.
The 17 items retained from SERVQUAL were assigned
to the appropriate subdimension in our proposed hierarchi-
cal factor structure (see Figure 1 and appendix). Three
SERVQUAL items related to modern-looking equipment,
physical facilities, and store materials (P1, P2, P3) were
expected to be indicators of the appearance subdimension
of the physical aspects dimension of retail service quality.
The two items measuring customers' perceptions of how
well the store fulfills its promises (P7, P8) were assigned
to the promises subdimension of the reliability dimension.
The two items relating to performing the service right the
first time and error-free transactions (P9, P11) were used
as indicators of the doing-it-right subdimension of the
reliability dimension. Three assurance items from
SERVQUAL regarding knowledge, confidence, and safety
(P12, P13, P14) were assigned to the inspiring confidence
subdimension of the personal interaction dimension. The
fourth assurance item (P19) related to courteousness and
was assigned to the courteous/helpful subdimension of the
personal interaction dimension. Three responsiveness
items from SERVQUAL related to prompt service, telling
customers when services will be performed, and never
being too busy to respond to customers' requests (P15,
P16, P17) were also assigned to this subdimension, as was
an empathy item on individual attention (P 18). A reliability
item from SERVQUAL measuring interest in solving cus-
tomers' problems (P22) was predicted to load on the
problem-solving dimension. Finally, the item related to
convenient operating hours (P26) was expected to be an
indicator of the policy dimension.
Based on the literature review as well as our own
qualitative research, we developed 11 new items to mea-
sure retail service quality. An item was developed to mea-
sure the appearance of public areas (P4) as an additional
indicator of the appearance subdimension of the physical
aspects dimension. Two items related to store layout,
which includes the ease of locating desired merchandise
and the ease of moving around in the store (P5, P6), were
added to the instrument to capture the convenience subdi-
mension of the physical aspects dimension. An item on
merchandise availability (P10) was added as an indicator
of the doing-it-right subdimension of reliability. Given that
customers expect the same level of courteous service on
the telephone as they would in a face-to-face encounter, an
item related to telephone courtesy (P20) was added as
another indicator of the courteous/helpfulness subdimen-
sion of personal interaction. Two new items were devel-
oped for the problem-solving dimension. One measured
customers' perceptions of how willingly retail stores han-
dle returns and exchanges (P21), and the other measured
customers' perceptions of the handling of complaints
(P23). In addition to the earlier item on operating hours,
four new items were developed for the policy dimension--
an item on the quality of merchandise (P24), an item
related to convenient parking (P25), and two items related
to credit card policies (P27, P28).
Both perceptions and expectations items were devel-
oped to allow perceptions only, as well as disconfirmation
type analysis. The perceptions items are presented in the
appendix. Matching expectation items substitute "excel-
lent retail stores" for "this store" in the perception items.
For example, the expectation item to match P1 would read
"Excellent retail stores Will have modern-looking equip-
Dabholkar et al. / RETAIL SERVICE QUALITY 9
ment and fixtures." Only the perceptions data are analyzed
and presented in this article to avoid psychometric prob-
lems with difference scores (Brown, Churchill, and Peter
1993; Cronin and Taylor 1992, 1994; Parasuraman,
Zeithaml, and Berry 1994a; Teas 1993, 1994). However,
the proposed factor structure is amenable to a disconfirma-
tion approach, which could be used to determine gaps in
service quality. As recommended by Parasuraman et al.
(1991), the 7-point rating scale used in SERVQUAL
was reduced to a 5-point scale (1 = strongly disagree,
5 =strongly agree). To allow comparison to existing scales
for the measurement of service quality (i.e., SERVQUAL),
we collected data on all 22 SERVQUAL items, encom-
passing the five items that were not included in our mea-
sure of retail service quality.
DATA COLLECTION
Sample Selection and Size
A total of seven stores from two department store chains
in the southeastern United States were involved in the
study. These multiunit organizations operate stores located
in similar trading areas with generally similar customer
profiles. Senior management personnel of both organiza-
tions agreed to participate in the research. College students
majoring in retailing, who were assigned to the stores as a
requirement of their senior field experience, as well as
regular store employees, administered the questionnaires.
Detailed instructions and a supply of questionnaires were
sent to each of the stores. A letter explaining the project
was sent to each store manager, who had been apprised of
it earlier by senior management. In addition, a follow-up
telephone call to each store manager and each question-
naire administrator was conducted to answer any questions
or concerns before data collection began. A sample of 227
respondents was obtained. The sample consisted of 197
women with a mean age of 43.03 and 27 men with a mean
age of 40.85. (Three respondents chose not to provide
demographic information.)
Procedure
The questionnaire was self-administered at the store
location. The rationale for our data collection method is
based on the theory that respondents will be more attentive
to the task of completing a questionnaire and will provide
more meaningful responses when they are contextualized
in the environment that they are evaluating. Being in the
natural environment (i.e., shopping setting) is preferable
to sitting at the kitchen table at home amid distractions that
take precedence over the task of completing the survey.
Further, being in the relevant environment, shoppers
would be more likely to focus on dimensions important to
them for evaluating the quality of service at the store. The
questionnaire was administered just prior to the respon-
dents' shopping experience so that the responses reflect
evaluations of previous shopping experiences at the store.
Interviewing just after a shopping experience may more
closely reflect satisfaction rather than service quality (Rust
and Oliver 1994).
Whereas some previous studies were administered to
individuals who may or may not have ever shopped at the
particular store, we collectedevaluations of service quality
for the specific store visited so that customers could
give more meaningful responses. Further, store-specific
responses are more actionable than "retail in general"
responses. The data were collected during a 3-week period
in the fall prior to the Christmas shopping season from the
seven sample units. Every fifth adult customer entering the
store was asked to complete the questionnaire provided
that they had previously shopped at the store and were
willing to complete the questionnaire as they entered the
store. Customers who had not previously shopped at the
store were excluded from the sample. Customers were
sampled from morning, afternoon, and evening hours on
weekdays and weekends. The questionnaires were self-
administered by the respondents who were afforded a chair
in a quiet area near the store entrance and a clipboard for
their convenience while completing the questionnaires.
TEST OF PROPOSED FACTOR
STRUCTURE OF RETAIL SERVICE QUALITY
The descriptive statistics (means and standard devia-
tions) obtained for the items in the proposed Retail Service
Quality Scale are presented in the appendix. Given that the
respondents had shopped at the store before and had
returned, it is not surprising that the mean values of per-
ceptions regarding service quality items were toward the
higher end of the scale. However, the standard deviations
indicate that there was sufficient variation in the data.
Partial Disaggregation
To test the proposed Retail Service Quality Scale, we
used confirmatory factor analysis with partial disaggrega-
tion (see Bagozzi and Heatherton 1994; Hull, Lehn, and
Tedlie 1991; Marsh and Hocevar 1985). The traditional
structural equations approach (or total disaggregation),
which uses each item as a separate indicator of the relevant
construct, provides the most detailed level of analysis for
construct testing, but "in practice it can be unwieldy be-
cause of likely high levels of random error in typical items
and the many parameters that must be estimated" (Bagozzi
and Heatherton 1994, pp. 42-43). On the other hand, total
aggregation of items within dimensions does not offer
much advantage over traditional multivariate analysis, al-
though it does provide fit indices. The partial disaggrega-
tion technique is seen as a compromise between these two
extremes. It allows one to proceed with meaningful re-
search by combining items into composites to reduce
higher levels of random error and yet it retains all the
advantages of structural equations, including accounting
for measurement error, allowing for multiple, multidimen-
sional variables, and testing for hierarchical factor structure.
10 JOURNAL
OF THEACADEMYOF MARKETINGSCIENCE WINTER1996
FIGURE 2
Retail Service Quality: The Five Basic Dimensions
dp51= .820
~
4i---'~"666 ~52._.~"90_._~
2
. oo
KEY:11= P1 + P3 + P5
I2=P2+P4+P6
13= P7 + P9
I4=P8 +P10+Pll
15=P12+P14+P15+P17+P19
Operationally, partial disaggregation is accomplished
by randomly aggregating items that relate to a given con-
struct so that there are two or three combined indicators
instead of several single-item indicators. The rationale for
randomcombination of items is that all items or indicators
related to a latent variable should correspond in the same
way to that latent variable; thus any combination of these
items should yield the same model fit.
Test of Five Basic Dimensions
Although there are many instances of testing second-
order factor models in the literature, we could not find an
example of a third-order factor model. Nevertheless, de-
spite the lack of a precedent for doing so, we tried to run a
third-order factor model as shown in Figure 1, but this
model was not implementable. We, therefore, decided to
test the model in three stages--a test of the five basic
dimensions, a test of the second-order factor, and a test of
the subdimensions. These tests would reveal whether our
proposed hierarchical structure was supported in part or
whole.
The first step in assessing the hierarchical factor struc-
ture, as outlined above, was to test whether the five basic
dimensions (see Figure 1) were well supported as descrip-
tors of retail service quality. At this stage, we were not
testing subdimensions. Hence, for example, all six indica-
tors for physical aspects (see Figure 1) were treated as
equivalent indicators of this dimension and were combined
in a random manner to create two composite indicators for
the construct (see Figure 2). Partial disaggregation of this
model yielded an excellent fit (%2= 48.92, df= 30, AGFI
16 = P13+ P16 + P18 + P20
17 = P21 4-P23
I8= P22
19 = P24+ P26+ P28
11o= P25 + P27
= 0.92, CFI = 0.99, RMSR = .03), l as shown in Table 2.
The factor loadings and covariances obtained from a test
of the five basic dimensions are shown in Figure 2. By all
indications, the model was well supported, leading us to
conclude that our five basic dimensions appear to be well
suited for measuring retail service quality.
Test of Retail Service Quality
as a Higher Order Factor
The next step was to determine if retail service quality
may be viewed as a higher order factor to these dimen-
sions. Using the same indicators for the dimensions as
before, we modeled retail service quality as a second-order
factor (see Figure 3). The first-order factors were allowed
to correlate as before and the inclusion of the second-order
factor resulted in lower correlations among first-order
factors (not shown in Figure 3 to keep it from becoming
cluttered). Partial disaggregation analysis of this model
also found an excellent fit (%2 = 59.11, df= 30, AGFI =
0.90, CFI = 0.98, RMSR = .03), as shown in Table 2. The
factor loadings and gamma values for the second-order
model are shown in Figure 3. One lambda value for each
dimension was set at 1.00, as is typical of second-order
factor analysis. Also, an examination of the modification
indices did not suggest any changes in the model. The
results led us to conclude that the second-order factor
structure for retail service quality is well supported. This
suggests that customers evaluate retail service quality on
the five basic dimensions but that they also view overall
retail service quality as a higher order factor that captures
a meaning common to all the dimensions.
Dabholkar et al. / RETAIL SERVICE QUALITY
TABLE 2
Summary Results of Confirmatory Factor Analysis for the
Proposed Factor Structure of Retail Service Quality
11
Z2 df p AGFI CFI RMSR
Firststudy(n = 227)
Model testing five basic dimensions of retail service quality as first-order factors 48.92 30 .02 0.92 0.99 .03
Model testing retail service quality as a second-order factor to the five basic dimensions 59.11 30 .01 0.90 0.98 .03
Model testing six subdimensions of retail service quality as fast-order factors 88.71 45 .00 0.89 0.98 .03
Model testing six subdimensions of retail service quality with corresponding dimensions
as second-orderfactors 107.20 45 .00 0.87 0.97 .03
Cross-validationstudy(n = 149)
Modeltestingfivebasicdimensionsofretailservice~tualityas first-orderfactors 32.21 30 .36 0.93 1.00 .02
Modeltestingretailservicequalityas a second-orderfactorto the fivebasicdimensions 61.00 30 .01 0.86 0.98 .03
Modeltestingsix subdimensionsofretailservicequalityas first-orderfactors 81.03 45 .01 0.87 0.97 .04
Modeltestingsix subdimensionsof retailservicequalitywithcorrespondingdimensions
as second-orderfactors 76.11 45 .01 0.87 0.98 .04
FIGURE 3
Retail Service Quality: Service Quality as a Second-Order Factor to the Five Basic Dimensions
Xll= 1.000 X21--1.017 )'32-- 1.000 XS4
='956 ~'95--1.000 ~o5--=.896
KEY: 11 = P1 + P3 + P5
12= P2 + P4+ P6
I3=P7+P9
I4=P8 +P10+Pll
15=P12+P14+P15 +P17 +P19
16= P13 + P16 + P18 +P20
17= P21 + P23
I8 = P22
I9 = P24 + P26 + P28
I10 = P25 + P27
Test of Six Subdimensions
The last test of the proposed hierarchical factor struc-
ture was the test for subdimensions. Three of the basic
dimensions of our hierarchical structure for retail service
quality had been proposed to have two subdimensionseach
(see Figure 1). Hence a model to test this structure viewed
these three dimensions as second-order factors to the six
subdimensions (see Figure 4). The indicators for each
subdimension or first-order factor were randomly com-
bined into two composite indicators. A partial disaggrega-
tion analysis of this model showed a good fit, both at the
first-order level (X2= 88.71, df= 45, AGH = 0.89, CH =
0.98, RMSR = .03), and at the second-order level (;~2=
107.20, df= 45, AGFI = 0.87, CFI = 0.97, RMSR = .03),
as shown in Table 2. The factor loadings, covariances, and
gamma values are indicated in Figure 4.
Thus all three levels of our proposed hierarchical struc-
ture are very strongly supported, suggesting that the full
model of retail service quality (see Figure 1) is valid. What
this means is that consumers evaluate retail service quality
according to the proposed five basic dimensions, and in
12 JOURNAL OF THE ACADEMY OF MARKETING SCIENCE WINTER 1996
FIGURE 4
Retail Service Quality: The Six Subdimensions
t~~1= .887
Y]I .728
7 =. =. 7
d~21= .879 ~ 32= .896
]r =
X53--1.000 ~,63=1.084 ~,74=1.000 X84--1.072
.935
"153
70 ~. 44
= . . = . 2 .
KEY: I1 = P1 + P10
I2 = P2 + P19
13 = P6
I4 = P7
I5 = P4
16 = P20
addition, they view overall service quality as a higher order
factor and that some of the basic dimensions have subdi-
mensions associated with them in the consumer's mind.
CROSS-VALIDATION STUDY
Even though our proposed factorial structure has an
excellent fit with the data, we recognize that the results
could be specific to this particular sample. Therefore, a
second study using the same instrument was conducted to
validate our findings. The study was conducted during a
7-day period at two store units of one of the same organi-
zations involved in the main study. A total of 149 com-
pleted questionnaires were collected. The procedure for
the main study was duplicated in the cross-validation study
with the exception of using student assistants to collect the
data, rather than retail interns or store employees. The
results of this study are also presented in Table 2. It is seen
that the model testing the five basic dimensions had an
excellent fit (~2 = 32.21, df=30, AGFI = 0.93, CFI = 1.00,
RMSR = .02),2thus providing cross-validation for the five
basic dimensions. The second-order model also had an
excellent fit ()C2= 61.00, df=30, AGFI = 0.86, CFI = 0.98,
RMSR = .03), thus cross-validating the existence of retail
service quality as a higher order,factor to the five dimen-
sions. Finally, the model testing the six subdimensions also
showed an excellent fit, both at the first-order level (~2 =
I7 = P15
18 = P13+ P14
I9=P12 +P28
II0 = P27
I11 = P16 + P21 + P29
I12 = P22 + P31 + P32
81.03, df= 45, AGFI = 0.87, CFI = 0.97, RMSR = .04),
and at the second-order level (~2 = 76.11, df=45, AGFI =
0.87, CFI = 0.98, RMSR = .04), thus providing cross-
validation for the subdimensions. Thus the validation study
also supported the entire hierarchical factor structure.
CONSTRUCT RELIABILITY AND VALIDITY OF
THE RETAIL SERVICE QUALITY SCALE
Construct reliabilities were computed from confirma-
tory factor analyses conducted separately for each dimen-
sion and subdimension of the Retail Service Quality Scale
that had four or more items, and these reliabilities ranged
from 0.81 to 0.92 (see Table 3). Cronbach's alpha was
computed for dimensions and subdimensions with fewer
than four items, and the values for alpha ranged from 0.83
to 0.89 (see Table 3). The construct reliability of the overall
scale computed from a confirmatory factor analysis con-
ducted on all the items was 0.74 (see Table 3). The high
construct reliabilities suggest that service quality analysis
could be appropriately conducted at the dimension or
subdimension level, as well as at the overall level.
Given that we have developed a new scale to measure
the construct of retail service quality, it is appropriate to
examine construct validity--specifically in terms of con-
vergent, discriminant, and predictive validities. Conver-
gent validity of the Retail Service Quality Scale cannot be
TABLE 3
Construct Reliability and Predictive Validity of
Retail Service Quality Scale
Predictive Validity
With Correlations
Number Construct Intention Intention
of ltems Reliability to Shop to Recommend
Overall scale 28 0.74 0.65 0.70
Dimensions
Physical aspects 6 0.85 0.55 0.64
Reliability 5 0.90 0.44 0.54
Personal interaction 9 0.90 0.58 ' 0.59
Problem solving 3 0.87a 0.66 0.64
Policy 5 0.92 0.63 0.66
Subdimensions
Appearance 4 0.81 0.45 0.53
Convenience 2 0.89a 0.50 0.62
Promises 2 0.83a 0.44 0.51
Doing it right 3 0.86a 0.39 0.51
Inspiring confidence 3 0.84a 0.66 0.63
Courteous/helpful 6 0.89 0.63 0.62
a. Cronbach's alpha (given that these dimensions/subdimensions had
fewer than four items each and hence construct reliability from separate
confirmatory factor analyses would not be meaningful).
ascertained in the typical sense of using different methods
to test the construct because we only used one method.
However, given that all the items loaded highly on the
factors to which they were assigned is itself a test of
convergent validity of the scale. A test of discriminant
validity is especially important, given that some of the
dimensions are highly correlated. One accepted test of
discriminant validity is to determine whether the covari-
ance and two standard errors add to less than 1.00. We used
this procedure on all possible pairs of the five dimensions
and found values ranging from 0.75 to 0.98. Thus all
dimensions are statistically distinct even after correcting
for measurement error and do have discriminant validity.
In a practical sense, they are highly correlated, and in
particular, the policy dimension is very highly correlated
with the reliability and personal interaction dimensions.
This could explain why there is so much common variance
to make a higher order factor structure appropriate.
To determine the predictive validity of the retail scale,
data had been collected on two dependent variables--
intentions to shop at the store and intentions to recommend
the store to others. Each variable was measured using two
7-point semantic differential scales with endpoints
likely/unlikely and possible/impossible as well as a third
5-point intention scale with anchors definitely would,
probably would, and so on, to definitely would not
shop/recommend. Predictive validity was ascertained us-
ing correlations between the retail service quality scale (at
the dimension, subdimension, or overall scale level) and
these two dependent variables. The results are presented in
Table 3 and show strong predictive validity for the Retail
Service Quality Scale at the dimension, subdimension, or
overall level.3
Dabholkar et al. / RETAIL SERVICE QUALITY 13
DISCUSSION
Our proposed measurement tool is suited for studying
retail businesses that offer a mix of services and goods,
such as department or specialty stores, to gather bench-
mark data regarding current levels of service quality as
well as to conduct periodic "checks" to measure service
improvement. The instrument could serve as a diagnostic
tool that will allow retailers to determine service areas that
are weak and in need of attention. One way to do this is by
testing the three forms of the generalized hierarchical
model. If retailers are greatly concerned about parsimony,
they may use only the model with the five basic dimen-
sions. However, given that no additional items are needed
to run the model with subdimensions, retailers may appre-
ciate the additional information on subdimensions ob-
tained by further partitioning the variance. Finally, by
proposing retail service quality as a second-order factor,
retailers can capture the extent of common variance or the
extent to which the basic dimensions represent overall
service quality.
Another way to use the instrument as a diagnostic tool
at different levels of analysis does not require the use of
structural models. Service quality analysis can be per-
formed at the overall level (using the full scale in an
additive fashion), at the factor level (using items within a
given dimension in an additive fashion), and at the subdi-
mension level (using items within a given subdimension
in an additive fashion). Analysis of data at these different
levels would allow evaluations of overall quality and di-
mension quality and would permit managers to identify
problem areas within their stores (at the dimension or
subdimension level) to concentrate resources on improv-
ing particular aspects of service quality.
The hierarchical structure of the scale has implications
for practitioners as well as academics. Practitioners are
often interested in determining overall service quality as
well as dimensions of service quality. Past studies have
typically used single-item measures of overall service
quality where it is possible that customers could focus on
certain aspects of the services in their minds while re-
sponding to these questions. Consequently, these measures
may not accurately reflect overall service quality. Al-
though no researcher can claim to definitively capture
customer perceptions of overall service quality, we believe
that we come closer to capturing these overall evaluations
because the second-order factor extracts the underlying
commonality among dimensions. If the respondents have
thoughtfully answered all the questions, then in addition
to obtaining their evaluations of the dimensions, the sec-
ond-order factor model captures the common variance
among these dimensions, reflecting the respondents' over-
all assessment of service quality. Future academic research
on scale development in a variety of contexts could inves-
tigate the appropriateness of hierarchical structures for
scales. In addition to determining any common variance
as explained, an investigation of subdimensions would
allow researchers to further partition the variance in a
meaningful way.
14 JOURNALOF THE ACADEMYOFMARKETINGSCIENCE WINTER 1996
An obvious extension of this research is to conduct
replication studies for other retailers who offer a mix of
services and goods. In addition, the scale can be modified
to measure service quality at a departmental level within
the store if the retail manager wants to compare customer
evaluations across departments. It can also be easily modi-
fied to compare evaluations of retail service quality for
competing retailers. We see the scale as a generalized retail
service quality scale that can be adapted to specific circum-
stances. For example, future research could explore
whether an adaptation of this scale, de-emphasizing the
personal interaction dimension, would be appropriate for
self-service stores.
Continued refinement of the retail service quality scale
proposed and supported in this study is certainly possible
based on further qualitative research and changes in retail-
ing trends. Such modifications could include the addition
or deletion of items, or even a modification of the hierar-
chical factor structure if so indicated. Although we at-
tempted to cover all aspects of retail service quality by
examining the retailing literature and by conducting a
broad range of qualitative research, we recognize that there
may be aspects of retail service quality that may have been
omitted or that may become relevant as new trends in
retailing evolve. In future research, customers may reveal
new aspects of retail service quality that are important to
them, and these would have to be incorporated in the scale
to ensure a valid measure of retail service quality on an
ongoing basis.
The development and testing of the Retail Service
Quality Scale has implications for other service industries
as well. Based on this study, as well as the other studies
cited, it appears that a measure of service quality across
industries is not feasible. Therefore, future research on
service quality should involve the development of
industry-specific measures of service quality following
the triangulation of qualitative research procedures and the
cross-validation technique used in this study.
APPENDIX
Factor Structure for the Retail Service Quality Scale
SERVQUAL
Dimension
Retail Service
Quality Dimension
Retail Service
Quality
Subdimension Perception Item Mean SD
Tangibles
Tangibles
Tangibles
(NI)
(NI)
(NI)
Reliability
Reliability
Reliability
(NI)
Reliability
Assurance
Assurance
Assurance
Responsiveness
Responsiveness
Responsiveness
Empathy
Assurance
(NI)
Physical aspects
Physical aspects
Physical aspects
Physical aspects
Physical aspects
Physical aspects
Reliability
Reliability
Reliability
Reliability
Reliability
Personal
interaction
Personal
interaction
Personal
interaction
Personal
interaction
Personal
interaction
Personal
interaction
Personal
interaction
Personal
interaction
Personal
interaction
Appearance
Appearance
Appearance
Appearance
Convenience
Convenience
Promises
Promises
Doing it right
Doing it right
Doing it right
Inspiring
confidence
Inspiring
confidence
Inspiring
confidence
Courteousness/
helpfulness
Courteousness/
helpfulness
Courteousness/
helpfulness
Courteousness/
helpfulness
Courteousness/
helpfulness
Courteousness/
helpfulness
P1. This store has modern-looking equipment and fixtures.
P2. The physical facilities at this store are visually appealing.
P3. Materials associated with this store's service (such as
shopping bags, catalogs, or statements) are visually appealing
P4. This store has clean, attractive, and convenient public
areas (restrooms, fitting rooms).
P5. The store layout at this store makes it easy for customers
to find what they need.
P6. The store layout at this store makes it easy for customers
to move around in the store.
P7. When this store promises to do something by a certain
time, it will do so.
PS. This store provides its services at the time it promises to
do so.
P9. This store performs the service right the first time.
P10. This store has merchandise available when the
customers want it.
P11. This store insists on error-free sales transactions and
records.
P12. Employees in this store have the knowledge to answer
customers' questions.
P13. The behavior of employees in this store instill
confidence in customers.
P14. Customers feel safe in their transactions with this store.
P15. Employees in this store give prompt service to
customers.
P16. Employees in this store tell customers exactly when
services will be performed.
P17. Employees in this store are never too busy to
respond to customer's requests.
P18. This store gives customers individual attention.
P19. Employees in this store are consistently courteous
with customers.
P20. Employees of this store treat customers courteously
on the telephone.
4.19
4.39
4.37
4.37
4.34
4.39
4.30
4.37
4.30
4.21
4.21
4.48
4.40
4.54
4.48
4.25
4.39
4.46
4.54
4.33
1.01
0.85
0.85
0.84
0.92
0.92
0.83
0.76
0.83
0.91
0.89
0.64
0.76
0.72
0.74
0.83
0.77
0.75
0.71
0.86
Dabholkar et al. / RETAIL SERVICE QUALITY 15
APPENDIX Continued
SERVQUAL
Dimension
Retail Service
Retail Service Quality
Quality Dimension Subdimension Perception Item Mean SD
NI) Problem solving None
Reliabifity Problem solving None
(NI) Problem solving None
(NI) Policy None
(NI) Policy None
Empathy Policy None
(NI) Policy None
(NI) Policy None
P21. This store willingly handles returns and exchanges. 4.54 0.73
P22. When a customer has a problem, this store shows a 4.45 0.75
sincere interest in solving it.
P23. Employees of this store are able to handle customer 4.40 0.75
complaints directly and immediately.
P24. This store offers high quality merchandise. 4.40 0.94
P25. This store provides plenty of convenient parking for 4.60 0.67
customers.
P26. This store has operating hours convenient to all their 4.34 0.83
customers.
P27. This store accepts most major credit cards. 4.58 0.72
P28. This store offers its own credit card. 4.76 0.57
NOTE: The items are labeled P~to denote perceptions. (NI) = Item is not included in SERVQUAL.
ACKNOWLEDGMENTS
The first two authors contributed equally to this article.
NOTES
1. The same procedure was used on the five SERVQUALdimensions
(using the 22 original items) to provide a standard of comparison with our
proposed scale. The model fit for SERVQUAL (Z2 = 140.75, df= 30,
AGFI = 0.76, CFI = 0.92, RMSR = .04) was found to be not as good.
Although the CFI does indicate that this model is acceptable, our scale
has a much better fit. Further, our scale has greater content validity for
the retail context given the extensive qualitative research and review of
the retail literature carried out to develop the relevant dimensions,
whereas SERVQUAL is not specifically geared to retailing.
2. Again, a comparison with the five SERVQUAL dimensions was
conducted and revealed that the fit using SERVQUAL was acceptable
(Z2 = 95.68, df= 30, AGFI = 0.80, CFI = 0.94, RMSR = .03), but not as
good as the fit for our proposed scale.
3. We attempted to use structural equations to test predictive validity,
but due to high multicollinearity among the five dimensions, we found
only some of the dimensions to have a s!,~ificant effecton the dependent
variables. Yet the variance explained (R) was quite high--.55 for inten-
tion to recommend the store to others and .52 for intention to shop at the
store in the future--thus suggesting high predictive validity. We con-
ducted a test for multicollinearity using forward stepwise regression and
confirmedthat it was very high. Therefore, we decided to use correlations
as an unbiased indicator of predictive validity.
REFERENCES
Babakus, Emin and Gregory W. Boller. 1991. "Empirical Assessmentof
SERVQUAL Scale." Journal of Business Research 24:253-268.
Babakus, Emin and W. Glynn Mangold. 1989. "Adapting the
SERVQUAL Scale to Health Care Environment: An Empirical Assess-
ment." In Enhancing Knowledge Development inMarketing, editedby
P. Bloom, 195. Chicago: American Marketing Association.
Bagozzi, Richard P. and Todd E Heatherton. 1994. "A General Approach
to Representing Multifaceted Personality Constructs: Application to
State Self-Esteem." Structural Equation Modeling 1 (1): 35-67.
Baker, Julie, Dhruv Grewal, and A. Parasuraman. 1994. "The Influence
of Store Environmenton Quality Inferencesand Store Image." Journal
of the Academy of Marketing Science 22 (Fall): 328-339.
Berry, Leonard L. 1986. "Retail Businesses Are Service Businesses."
Journal ofRetailing 62 (Spring): 3-6.
Bowers, Michael and John E. Swan. 1992. "Generic Versus Service
Specific Dimensions of Service Quality: Does SERVQUAL Cover
Hospital Health Care?" Unpublished manuscript, Birmingham, AL.
Brensinger, Ronald and Douglas M. Lambert. 1990. "Can the
SERVQUAL Scale Be Generalized to Business-to-Business Ser-
vices?" In Knowledge Development in Marketing, AMA Educators'
Proceedings, edited by W. Bearden, R. Deshpande, T. J. Madden, P.R.
Varadarajan, A. Parasuraman, V. S. Folkes, D. W. Stewart, and W. L.
Wilkie, 289. Chicago: American Marketing Association.
Bmwn, Tom J., Gilbert A. Churchill, and J. Paul Peter. 1993. "Impmving the
Measurement ofService Quality."JournalofRetatTing69(Spring): 127-139.
Carman, James M. 1990. "Consumer Perceptions of Service Quality: An
Assessmentof the SERVQUAL Dimensions." Journal ofRetailing 66
(Spring): 33-55.
Cronin, J. Joseph and Steven A. Taylor. 1992. "Measuring Service Qual-
ity: A Reexamination and Extension."Journal ofMarketing 56 (July):
55-68.
- - and .1994. "SERVPERF Versus SERVQUAL: Reconcil-
ing Performance-Based and Perceptions-Minus-Expectations Mea-
surement of Service Quality." Journal of Marketing 58 (January):
125-131.
Finn, David W. and Charles W. Lamb. 1991. "An Evaluation of the
SERVQUAL Scales in a Retailing Setting." In Advances in Consumer
Research, edited by R. Holman and M. R. Solomon, 483-490. Provo,
UT: Association for Consumer Research.
Guiry, Michael, Wes Hutchinson, and Barton A. Weitz. 1992. "Consum-
ers' Evaluation of Retail Store Service Quality and Its Influence on
Store Choice." Working paper, University of Florida.
Gutman, Jonathan and Scott D. Alden. 1985. "Adolescents' Cognitive
Structures of Retail Stores and Fashion Consumption: A Means-End
Chain Analysis of Quality." In Perceived Quality: How Consumers
View Stores and Merchandise, edited by Jacob Jacoby and Jerry C.
Olson, 99-114. Lexington, MA: Lexington Books.
Hart, Christopher W. L., James L. Heskett, and W. Earl Sasser, Jr. 1990.
"The Profitable Art of Service Recovery." Harvard Business Review
68 (July-August): 148-156.
Hull, Jay C., Daniel A. Lehn, and Judith C. Tedlie. 1991. "A General
Approach to Testing Multifaceted Personality Constructs." Journal of
Personality and Social Psychology 61:932-945.
Hummel, J. W. and Ronald Savitt. t988. "Integrated Customer Service
and Retail Strategy." International Journal of Retailing 3 (2): 5-21.
16 JOURNALOF THE ACADEMYOF MARKETING SCIENCE WINTER 1996
Kelley, Scott W. and Mark A. Davis 91994 9"Antecedents to Customer
Expectations for Service Recovery." Journal oftheAcademyofMar-
ketingScience 22 (Winter): 52-61.
Marsh, Herbert W. and Dennis Hocevar. 1985. "Application of Confir-
matory Factor Analysis to the Study of Self-Concept: First and Higher
Order Factor Models and Their Invariance Across Groups." Psycho-
logicalBulletin97(3):562-582 9
Mazursky, David and Jacob Jacohy. 1985 9"Forming Impressions of
Merchandise and Service Quality." In PerceivedQuality:How Con-
sumers1,~ewStoresandMerchandise,edited by Jacob Jacoby andJerry
C. Olson, 139-153. Lexington, MA: Lexington Books.
Oliver, Richard. 1981 9"Measurement and Evaluation of Satisfaction
Processes in Retail Settings." JournalofRetailing57 (Fall): 25-48.
Parasuraman, A., Leonard L. Berry, and Valarie A. Zeithaml. 1991 9
"Refinement and Reassessment of the SERVQUAL Scale." Journalof
Retailing67 (Winter): 420-450 9
Parasuraman, A., Valarie A. Zeithaml, and Leonard L. Berry. 1988.
"SERVQUAL: A Multiple-Item Scale for Measuring Consumer Per-
ceptions of ServiceQuality." JournalofRetailing64 (Spring): 12-40.
, , and .1994a. "Reassessment of Expectations as
a Comparison Standard inMeasuring Service Quality: Implications for
Future Research." Journal ofMarketing58 (January): 111-124.
, --, and --. 1994b. "Moving Forward in Service
Quality Research: Measuring Different Customer-Expectation Levels,
Comparing Alternative Scales, and Examining the Performance-Be-
havioral Intentions Link." Workingpaper, Marketing Science Institute,
Cambridge, MA.
Pitt, Leyland L., Pierre Oosthuizen, and Michael H. Morris. 1992. "Ser-
vice Quality in a High-Tech Industrial Market: An Application of
SERVQUAL." In Proceedings of American Marketing Association
Summer Educators' Conference,edited by R. Leone and V. Kumar,
46-53. Chicago: American Marketing Association.
Reichheld, Frederick E and W. Earl Sasser, Jr 91990 9"Zero Defections:
Quality Comes to Services." HarvardBusinessReview68 (5): 105-111.
Rust, Roland T. and Richard L. Oliver. 1994. "ServiceQuality: Insights
and Managerial Implications From the Frontier 9 In Service Quality:
New Directionsin Theoryand Practice,edited by Roland T. Rust and
Richard L 9Oliver, 1-19 9
London: Sage.
Sellers, P. 1990. "What Customers Really Want." Fortune 121 (13):
58-68.
Smith, T. 1989 9
"Nurturing a Customer Service Culture." RetailControl,
October, 15-18.
Spreng, Richard A. and A. K. Singh. 1993."An Empirical Assessment of
the SERVQUAL Scale and the Relationship Between Service Quality
and Satisfaction." In EnhancingKnowledgeDevelopmentinMarket-
ing, edited by David W. Cravens and Peter Dickson, 1-6. Chicago:
American Marketing Association.
Teas, R. Kenneth. 1993. "Expectations, Performance Evaluation, and
Consumers' Perceptions of Quality." Journal of Marketing 57
(October): 18-34.
91994 9"Expectations as a Comparison Standard in Measuring
ServiceQuality: An Assessment of a Reassessment." JournalofMar-
keting58 (January): 132-139 9
Westbrook, Robert A. 1981 9"Sources of Consumer Satisfaction With
Retail Outlets." JournalofRetailing57 (Fall): 68-85.
ABOUT THE AUTHORS
Pratibha A.Dabholkar is assistant professor of marketing at the
University of Tennessee, Knoxville. She received her Ph.D. from
Georgia State University 9Her research interests include attitude
and choice models, service quality and customer satisfaction
issues, technology in service delivery, and business-to-business
relationships 9 She has published articles in the Journal of the
Academy of Marketing Science, Journal of Business Research,
Journal of Consumer Research, Journal of Consumer Satisfac-
tion, Dissatisfaction, and Complaining Behavior, Journal of
Health Care Management, International Journal of Research in
Marketing, and Psychology and Marketing, as well as in various
conference proceedings.
Dayle I. Thorpe is a doctoral candidate in marketing at the
University of Tennessee, Knoxville. She also holds a B.S. and an
M.S. from Florida State University and an M.B.A. from Mercer
University 9Her research interests include services marketing,
service quality, retailing, and manager-employee relationships.
Her publications include articles in the Journal of Consumer
Satisfaction, Dissatisfaction, and Complaining Behavior, The
Service Industries Journal, and in various conference proceed-
ings.
Joseph O. Rentz is associate professor of marketing at the
University of Tennessee, Knoxville. He received his Ph.D. from
the University of Georgia. His research interests include cohort
analysis, measurement issues, generalizability studies, and cus-
tomer satisfaction. He has published articles in the Journal of the
Academy of Marketing Science, Journal ofAdvertising, Journal
ofMarketing, Journal ofMarketing Research, and the Journal of
Personal Selling and Sales Management, as well as in several
conference proceedings.

More Related Content

Similar to A Measure Of Service Quality For Retail Stores Scale Development And Validation

The Effects of Service Quality Dimensions on Customer Satisfaction: An Empir...
	The Effects of Service Quality Dimensions on Customer Satisfaction: An Empir...	The Effects of Service Quality Dimensions on Customer Satisfaction: An Empir...
The Effects of Service Quality Dimensions on Customer Satisfaction: An Empir...inventionjournals
 
A Structural Equation Model Of Customer Satisfaction And Future Purchase Of M...
A Structural Equation Model Of Customer Satisfaction And Future Purchase Of M...A Structural Equation Model Of Customer Satisfaction And Future Purchase Of M...
A Structural Equation Model Of Customer Satisfaction And Future Purchase Of M...Kim Daniels
 
2008 servicequality in bank gujarat
2008 servicequality in bank gujarat2008 servicequality in bank gujarat
2008 servicequality in bank gujaratpremikapaniker
 
Power point template
Power point templatePower point template
Power point templateradygogo
 
Comparative analysis of Retail chains based on SERVQUAL Model
Comparative analysis of Retail chains based on  SERVQUAL ModelComparative analysis of Retail chains based on  SERVQUAL Model
Comparative analysis of Retail chains based on SERVQUAL ModelSuresh Singh
 
The role of tangibility in service quality
The role of tangibility in service qualityThe role of tangibility in service quality
The role of tangibility in service qualityTapan Panda
 
A sample applied to Future Group : Drivers Of Customer Loyalty In A Retail St...
A sample applied to Future Group : Drivers Of Customer Loyalty In A Retail St...A sample applied to Future Group : Drivers Of Customer Loyalty In A Retail St...
A sample applied to Future Group : Drivers Of Customer Loyalty In A Retail St...Ramesh Godabole
 
introduction to service quality
introduction to service qualityintroduction to service quality
introduction to service qualityxiaolong ding
 
2076 4012-1-pb (1)
2076 4012-1-pb (1)2076 4012-1-pb (1)
2076 4012-1-pb (1)ReadyGo1
 
Service quality measurement and customers perception about the services of su...
Service quality measurement and customers perception about the services of su...Service quality measurement and customers perception about the services of su...
Service quality measurement and customers perception about the services of su...IAEME Publication
 
A Review On Dimensions Of Service Quality Models
A Review On Dimensions Of Service Quality ModelsA Review On Dimensions Of Service Quality Models
A Review On Dimensions Of Service Quality ModelsMaria Perkins
 
CONCEPTUALTHEORETICAL PAPERCustomer engagement in service
CONCEPTUALTHEORETICAL PAPERCustomer engagement in serviceCONCEPTUALTHEORETICAL PAPERCustomer engagement in service
CONCEPTUALTHEORETICAL PAPERCustomer engagement in serviceAlleneMcclendon878
 
Research proposal (Retail Banking)
Research proposal   (Retail Banking)Research proposal   (Retail Banking)
Research proposal (Retail Banking)RanjayKumar20
 
Measuring service quality in super stores
Measuring service quality in super storesMeasuring service quality in super stores
Measuring service quality in super storesdeshwal852
 
Application of servqual model in customer service of mobile operators
Application of servqual model in customer service of mobile operatorsApplication of servqual model in customer service of mobile operators
Application of servqual model in customer service of mobile operatorsAlexander Decker
 
Communication and Control Processes in the Delivery of Se.docx
Communication and Control Processes in the Delivery of Se.docxCommunication and Control Processes in the Delivery of Se.docx
Communication and Control Processes in the Delivery of Se.docxmadlynplamondon
 
Valor optimo del durbin watson
Valor optimo del durbin watsonValor optimo del durbin watson
Valor optimo del durbin watsonDamagadi
 

Similar to A Measure Of Service Quality For Retail Stores Scale Development And Validation (20)

The Effects of Service Quality Dimensions on Customer Satisfaction: An Empir...
	The Effects of Service Quality Dimensions on Customer Satisfaction: An Empir...	The Effects of Service Quality Dimensions on Customer Satisfaction: An Empir...
The Effects of Service Quality Dimensions on Customer Satisfaction: An Empir...
 
Introduction.pptx
Introduction.pptxIntroduction.pptx
Introduction.pptx
 
A Structural Equation Model Of Customer Satisfaction And Future Purchase Of M...
A Structural Equation Model Of Customer Satisfaction And Future Purchase Of M...A Structural Equation Model Of Customer Satisfaction And Future Purchase Of M...
A Structural Equation Model Of Customer Satisfaction And Future Purchase Of M...
 
2008 servicequality in bank gujarat
2008 servicequality in bank gujarat2008 servicequality in bank gujarat
2008 servicequality in bank gujarat
 
Power point template
Power point templatePower point template
Power point template
 
jurnal
jurnaljurnal
jurnal
 
Comparative analysis of Retail chains based on SERVQUAL Model
Comparative analysis of Retail chains based on  SERVQUAL ModelComparative analysis of Retail chains based on  SERVQUAL Model
Comparative analysis of Retail chains based on SERVQUAL Model
 
The role of tangibility in service quality
The role of tangibility in service qualityThe role of tangibility in service quality
The role of tangibility in service quality
 
A sample applied to Future Group : Drivers Of Customer Loyalty In A Retail St...
A sample applied to Future Group : Drivers Of Customer Loyalty In A Retail St...A sample applied to Future Group : Drivers Of Customer Loyalty In A Retail St...
A sample applied to Future Group : Drivers Of Customer Loyalty In A Retail St...
 
Service Quality
Service QualityService Quality
Service Quality
 
introduction to service quality
introduction to service qualityintroduction to service quality
introduction to service quality
 
2076 4012-1-pb (1)
2076 4012-1-pb (1)2076 4012-1-pb (1)
2076 4012-1-pb (1)
 
Service quality measurement and customers perception about the services of su...
Service quality measurement and customers perception about the services of su...Service quality measurement and customers perception about the services of su...
Service quality measurement and customers perception about the services of su...
 
A Review On Dimensions Of Service Quality Models
A Review On Dimensions Of Service Quality ModelsA Review On Dimensions Of Service Quality Models
A Review On Dimensions Of Service Quality Models
 
CONCEPTUALTHEORETICAL PAPERCustomer engagement in service
CONCEPTUALTHEORETICAL PAPERCustomer engagement in serviceCONCEPTUALTHEORETICAL PAPERCustomer engagement in service
CONCEPTUALTHEORETICAL PAPERCustomer engagement in service
 
Research proposal (Retail Banking)
Research proposal   (Retail Banking)Research proposal   (Retail Banking)
Research proposal (Retail Banking)
 
Measuring service quality in super stores
Measuring service quality in super storesMeasuring service quality in super stores
Measuring service quality in super stores
 
Application of servqual model in customer service of mobile operators
Application of servqual model in customer service of mobile operatorsApplication of servqual model in customer service of mobile operators
Application of servqual model in customer service of mobile operators
 
Communication and Control Processes in the Delivery of Se.docx
Communication and Control Processes in the Delivery of Se.docxCommunication and Control Processes in the Delivery of Se.docx
Communication and Control Processes in the Delivery of Se.docx
 
Valor optimo del durbin watson
Valor optimo del durbin watsonValor optimo del durbin watson
Valor optimo del durbin watson
 

More from Shannon Green

Tooth Fairy Writing Paper - Researchmethods.Web.Fc2.
Tooth Fairy Writing Paper - Researchmethods.Web.Fc2.Tooth Fairy Writing Paper - Researchmethods.Web.Fc2.
Tooth Fairy Writing Paper - Researchmethods.Web.Fc2.Shannon Green
 
Essay Writing Tools. Essay Tools. 202. Online assignment writing service.
Essay Writing Tools. Essay Tools. 202. Online assignment writing service.Essay Writing Tools. Essay Tools. 202. Online assignment writing service.
Essay Writing Tools. Essay Tools. 202. Online assignment writing service.Shannon Green
 
What Is A Humorous Essay And Why ItS Useful - Essa
What Is A Humorous Essay And Why ItS Useful - EssaWhat Is A Humorous Essay And Why ItS Useful - Essa
What Is A Humorous Essay And Why ItS Useful - EssaShannon Green
 
Custom Custom Essay Writer Website For School
Custom Custom Essay Writer Website For SchoolCustom Custom Essay Writer Website For School
Custom Custom Essay Writer Website For SchoolShannon Green
 
How To Write An Introduction For A Research Paper - How To Write An
How To Write An Introduction For A Research Paper - How To Write AnHow To Write An Introduction For A Research Paper - How To Write An
How To Write An Introduction For A Research Paper - How To Write AnShannon Green
 
Description Of The House (500 Words). Online assignment writing service.
Description Of The House (500 Words). Online assignment writing service.Description Of The House (500 Words). Online assignment writing service.
Description Of The House (500 Words). Online assignment writing service.Shannon Green
 
Art College Essay Examples. The Best College Essays A
Art College Essay Examples. The Best College Essays AArt College Essay Examples. The Best College Essays A
Art College Essay Examples. The Best College Essays AShannon Green
 
Writing Practice Paper - Number Writing Practice By The Resourc
Writing Practice Paper - Number Writing Practice By The ResourcWriting Practice Paper - Number Writing Practice By The Resourc
Writing Practice Paper - Number Writing Practice By The ResourcShannon Green
 
Personal Narrative Writing Prompts 4Th Grade
Personal Narrative Writing Prompts 4Th GradePersonal Narrative Writing Prompts 4Th Grade
Personal Narrative Writing Prompts 4Th GradeShannon Green
 
What Are The Different Types O. Online assignment writing service.
What Are The Different Types O. Online assignment writing service.What Are The Different Types O. Online assignment writing service.
What Are The Different Types O. Online assignment writing service.Shannon Green
 
Freshman English Your First Rhetorical Precis
Freshman English Your First Rhetorical PrecisFreshman English Your First Rhetorical Precis
Freshman English Your First Rhetorical PrecisShannon Green
 
8 Research Paper Outline Templates -DOC, Excel, P
8 Research Paper Outline Templates -DOC, Excel, P8 Research Paper Outline Templates -DOC, Excel, P
8 Research Paper Outline Templates -DOC, Excel, PShannon Green
 
Help Me Write A Cause And Effect Essay. How To Writ
Help Me Write A Cause And Effect Essay. How To WritHelp Me Write A Cause And Effect Essay. How To Writ
Help Me Write A Cause And Effect Essay. How To WritShannon Green
 
Developmental Psychology Topics Examples Presentati
Developmental Psychology Topics Examples PresentatiDevelopmental Psychology Topics Examples Presentati
Developmental Psychology Topics Examples PresentatiShannon Green
 
(PDF) Structured Abstracts. Narrat. Online assignment writing service.
(PDF) Structured Abstracts. Narrat. Online assignment writing service.(PDF) Structured Abstracts. Narrat. Online assignment writing service.
(PDF) Structured Abstracts. Narrat. Online assignment writing service.Shannon Green
 
How To Write A Closing Statement For A Persuasive
How To Write A Closing Statement For A PersuasiveHow To Write A Closing Statement For A Persuasive
How To Write A Closing Statement For A PersuasiveShannon Green
 
ChatGPT And Its Use In Essay Writing Instruction – Sovorel
ChatGPT And Its Use In Essay Writing Instruction – SovorelChatGPT And Its Use In Essay Writing Instruction – Sovorel
ChatGPT And Its Use In Essay Writing Instruction – SovorelShannon Green
 
How To Reduce Poverty In India Essay. . Online assignment writing service.
How To Reduce Poverty In India Essay. . Online assignment writing service.How To Reduce Poverty In India Essay. . Online assignment writing service.
How To Reduce Poverty In India Essay. . Online assignment writing service.Shannon Green
 
Writing A Film Analysis. Writing A Film Analysis A
Writing A Film Analysis. Writing A Film Analysis AWriting A Film Analysis. Writing A Film Analysis A
Writing A Film Analysis. Writing A Film Analysis AShannon Green
 
Check My Essay Annotated Bibliography Tips
Check My Essay Annotated Bibliography TipsCheck My Essay Annotated Bibliography Tips
Check My Essay Annotated Bibliography TipsShannon Green
 

More from Shannon Green (20)

Tooth Fairy Writing Paper - Researchmethods.Web.Fc2.
Tooth Fairy Writing Paper - Researchmethods.Web.Fc2.Tooth Fairy Writing Paper - Researchmethods.Web.Fc2.
Tooth Fairy Writing Paper - Researchmethods.Web.Fc2.
 
Essay Writing Tools. Essay Tools. 202. Online assignment writing service.
Essay Writing Tools. Essay Tools. 202. Online assignment writing service.Essay Writing Tools. Essay Tools. 202. Online assignment writing service.
Essay Writing Tools. Essay Tools. 202. Online assignment writing service.
 
What Is A Humorous Essay And Why ItS Useful - Essa
What Is A Humorous Essay And Why ItS Useful - EssaWhat Is A Humorous Essay And Why ItS Useful - Essa
What Is A Humorous Essay And Why ItS Useful - Essa
 
Custom Custom Essay Writer Website For School
Custom Custom Essay Writer Website For SchoolCustom Custom Essay Writer Website For School
Custom Custom Essay Writer Website For School
 
How To Write An Introduction For A Research Paper - How To Write An
How To Write An Introduction For A Research Paper - How To Write AnHow To Write An Introduction For A Research Paper - How To Write An
How To Write An Introduction For A Research Paper - How To Write An
 
Description Of The House (500 Words). Online assignment writing service.
Description Of The House (500 Words). Online assignment writing service.Description Of The House (500 Words). Online assignment writing service.
Description Of The House (500 Words). Online assignment writing service.
 
Art College Essay Examples. The Best College Essays A
Art College Essay Examples. The Best College Essays AArt College Essay Examples. The Best College Essays A
Art College Essay Examples. The Best College Essays A
 
Writing Practice Paper - Number Writing Practice By The Resourc
Writing Practice Paper - Number Writing Practice By The ResourcWriting Practice Paper - Number Writing Practice By The Resourc
Writing Practice Paper - Number Writing Practice By The Resourc
 
Personal Narrative Writing Prompts 4Th Grade
Personal Narrative Writing Prompts 4Th GradePersonal Narrative Writing Prompts 4Th Grade
Personal Narrative Writing Prompts 4Th Grade
 
What Are The Different Types O. Online assignment writing service.
What Are The Different Types O. Online assignment writing service.What Are The Different Types O. Online assignment writing service.
What Are The Different Types O. Online assignment writing service.
 
Freshman English Your First Rhetorical Precis
Freshman English Your First Rhetorical PrecisFreshman English Your First Rhetorical Precis
Freshman English Your First Rhetorical Precis
 
8 Research Paper Outline Templates -DOC, Excel, P
8 Research Paper Outline Templates -DOC, Excel, P8 Research Paper Outline Templates -DOC, Excel, P
8 Research Paper Outline Templates -DOC, Excel, P
 
Help Me Write A Cause And Effect Essay. How To Writ
Help Me Write A Cause And Effect Essay. How To WritHelp Me Write A Cause And Effect Essay. How To Writ
Help Me Write A Cause And Effect Essay. How To Writ
 
Developmental Psychology Topics Examples Presentati
Developmental Psychology Topics Examples PresentatiDevelopmental Psychology Topics Examples Presentati
Developmental Psychology Topics Examples Presentati
 
(PDF) Structured Abstracts. Narrat. Online assignment writing service.
(PDF) Structured Abstracts. Narrat. Online assignment writing service.(PDF) Structured Abstracts. Narrat. Online assignment writing service.
(PDF) Structured Abstracts. Narrat. Online assignment writing service.
 
How To Write A Closing Statement For A Persuasive
How To Write A Closing Statement For A PersuasiveHow To Write A Closing Statement For A Persuasive
How To Write A Closing Statement For A Persuasive
 
ChatGPT And Its Use In Essay Writing Instruction – Sovorel
ChatGPT And Its Use In Essay Writing Instruction – SovorelChatGPT And Its Use In Essay Writing Instruction – Sovorel
ChatGPT And Its Use In Essay Writing Instruction – Sovorel
 
How To Reduce Poverty In India Essay. . Online assignment writing service.
How To Reduce Poverty In India Essay. . Online assignment writing service.How To Reduce Poverty In India Essay. . Online assignment writing service.
How To Reduce Poverty In India Essay. . Online assignment writing service.
 
Writing A Film Analysis. Writing A Film Analysis A
Writing A Film Analysis. Writing A Film Analysis AWriting A Film Analysis. Writing A Film Analysis A
Writing A Film Analysis. Writing A Film Analysis A
 
Check My Essay Annotated Bibliography Tips
Check My Essay Annotated Bibliography TipsCheck My Essay Annotated Bibliography Tips
Check My Essay Annotated Bibliography Tips
 

Recently uploaded

Sanyam Choudhary Chemistry practical.pdf
Sanyam Choudhary Chemistry practical.pdfSanyam Choudhary Chemistry practical.pdf
Sanyam Choudhary Chemistry practical.pdfsanyamsingh5019
 
“Oh GOSH! Reflecting on Hackteria's Collaborative Practices in a Global Do-It...
“Oh GOSH! Reflecting on Hackteria's Collaborative Practices in a Global Do-It...“Oh GOSH! Reflecting on Hackteria's Collaborative Practices in a Global Do-It...
“Oh GOSH! Reflecting on Hackteria's Collaborative Practices in a Global Do-It...Marc Dusseiller Dusjagr
 
Mastering the Unannounced Regulatory Inspection
Mastering the Unannounced Regulatory InspectionMastering the Unannounced Regulatory Inspection
Mastering the Unannounced Regulatory InspectionSafetyChain Software
 
SOCIAL AND HISTORICAL CONTEXT - LFTVD.pptx
SOCIAL AND HISTORICAL CONTEXT - LFTVD.pptxSOCIAL AND HISTORICAL CONTEXT - LFTVD.pptx
SOCIAL AND HISTORICAL CONTEXT - LFTVD.pptxiammrhaywood
 
CARE OF CHILD IN INCUBATOR..........pptx
CARE OF CHILD IN INCUBATOR..........pptxCARE OF CHILD IN INCUBATOR..........pptx
CARE OF CHILD IN INCUBATOR..........pptxGaneshChakor2
 
Class 11 Legal Studies Ch-1 Concept of State .pdf
Class 11 Legal Studies Ch-1 Concept of State .pdfClass 11 Legal Studies Ch-1 Concept of State .pdf
Class 11 Legal Studies Ch-1 Concept of State .pdfakmcokerachita
 
Hybridoma Technology ( Production , Purification , and Application )
Hybridoma Technology  ( Production , Purification , and Application  ) Hybridoma Technology  ( Production , Purification , and Application  )
Hybridoma Technology ( Production , Purification , and Application ) Sakshi Ghasle
 
Incoming and Outgoing Shipments in 1 STEP Using Odoo 17
Incoming and Outgoing Shipments in 1 STEP Using Odoo 17Incoming and Outgoing Shipments in 1 STEP Using Odoo 17
Incoming and Outgoing Shipments in 1 STEP Using Odoo 17Celine George
 
Contemporary philippine arts from the regions_PPT_Module_12 [Autosaved] (1).pptx
Contemporary philippine arts from the regions_PPT_Module_12 [Autosaved] (1).pptxContemporary philippine arts from the regions_PPT_Module_12 [Autosaved] (1).pptx
Contemporary philippine arts from the regions_PPT_Module_12 [Autosaved] (1).pptxRoyAbrique
 
Introduction to AI in Higher Education_draft.pptx
Introduction to AI in Higher Education_draft.pptxIntroduction to AI in Higher Education_draft.pptx
Introduction to AI in Higher Education_draft.pptxpboyjonauth
 
A Critique of the Proposed National Education Policy Reform
A Critique of the Proposed National Education Policy ReformA Critique of the Proposed National Education Policy Reform
A Critique of the Proposed National Education Policy ReformChameera Dedduwage
 
Accessible design: Minimum effort, maximum impact
Accessible design: Minimum effort, maximum impactAccessible design: Minimum effort, maximum impact
Accessible design: Minimum effort, maximum impactdawncurless
 
Interactive Powerpoint_How to Master effective communication
Interactive Powerpoint_How to Master effective communicationInteractive Powerpoint_How to Master effective communication
Interactive Powerpoint_How to Master effective communicationnomboosow
 
Introduction to ArtificiaI Intelligence in Higher Education
Introduction to ArtificiaI Intelligence in Higher EducationIntroduction to ArtificiaI Intelligence in Higher Education
Introduction to ArtificiaI Intelligence in Higher Educationpboyjonauth
 
Separation of Lanthanides/ Lanthanides and Actinides
Separation of Lanthanides/ Lanthanides and ActinidesSeparation of Lanthanides/ Lanthanides and Actinides
Separation of Lanthanides/ Lanthanides and ActinidesFatimaKhan178732
 
_Math 4-Q4 Week 5.pptx Steps in Collecting Data
_Math 4-Q4 Week 5.pptx Steps in Collecting Data_Math 4-Q4 Week 5.pptx Steps in Collecting Data
_Math 4-Q4 Week 5.pptx Steps in Collecting DataJhengPantaleon
 
Organic Name Reactions for the students and aspirants of Chemistry12th.pptx
Organic Name Reactions  for the students and aspirants of Chemistry12th.pptxOrganic Name Reactions  for the students and aspirants of Chemistry12th.pptx
Organic Name Reactions for the students and aspirants of Chemistry12th.pptxVS Mahajan Coaching Centre
 

Recently uploaded (20)

Sanyam Choudhary Chemistry practical.pdf
Sanyam Choudhary Chemistry practical.pdfSanyam Choudhary Chemistry practical.pdf
Sanyam Choudhary Chemistry practical.pdf
 
“Oh GOSH! Reflecting on Hackteria's Collaborative Practices in a Global Do-It...
“Oh GOSH! Reflecting on Hackteria's Collaborative Practices in a Global Do-It...“Oh GOSH! Reflecting on Hackteria's Collaborative Practices in a Global Do-It...
“Oh GOSH! Reflecting on Hackteria's Collaborative Practices in a Global Do-It...
 
Mastering the Unannounced Regulatory Inspection
Mastering the Unannounced Regulatory InspectionMastering the Unannounced Regulatory Inspection
Mastering the Unannounced Regulatory Inspection
 
SOCIAL AND HISTORICAL CONTEXT - LFTVD.pptx
SOCIAL AND HISTORICAL CONTEXT - LFTVD.pptxSOCIAL AND HISTORICAL CONTEXT - LFTVD.pptx
SOCIAL AND HISTORICAL CONTEXT - LFTVD.pptx
 
CARE OF CHILD IN INCUBATOR..........pptx
CARE OF CHILD IN INCUBATOR..........pptxCARE OF CHILD IN INCUBATOR..........pptx
CARE OF CHILD IN INCUBATOR..........pptx
 
Staff of Color (SOC) Retention Efforts DDSD
Staff of Color (SOC) Retention Efforts DDSDStaff of Color (SOC) Retention Efforts DDSD
Staff of Color (SOC) Retention Efforts DDSD
 
Class 11 Legal Studies Ch-1 Concept of State .pdf
Class 11 Legal Studies Ch-1 Concept of State .pdfClass 11 Legal Studies Ch-1 Concept of State .pdf
Class 11 Legal Studies Ch-1 Concept of State .pdf
 
Hybridoma Technology ( Production , Purification , and Application )
Hybridoma Technology  ( Production , Purification , and Application  ) Hybridoma Technology  ( Production , Purification , and Application  )
Hybridoma Technology ( Production , Purification , and Application )
 
Incoming and Outgoing Shipments in 1 STEP Using Odoo 17
Incoming and Outgoing Shipments in 1 STEP Using Odoo 17Incoming and Outgoing Shipments in 1 STEP Using Odoo 17
Incoming and Outgoing Shipments in 1 STEP Using Odoo 17
 
Contemporary philippine arts from the regions_PPT_Module_12 [Autosaved] (1).pptx
Contemporary philippine arts from the regions_PPT_Module_12 [Autosaved] (1).pptxContemporary philippine arts from the regions_PPT_Module_12 [Autosaved] (1).pptx
Contemporary philippine arts from the regions_PPT_Module_12 [Autosaved] (1).pptx
 
Model Call Girl in Tilak Nagar Delhi reach out to us at 🔝9953056974🔝
Model Call Girl in Tilak Nagar Delhi reach out to us at 🔝9953056974🔝Model Call Girl in Tilak Nagar Delhi reach out to us at 🔝9953056974🔝
Model Call Girl in Tilak Nagar Delhi reach out to us at 🔝9953056974🔝
 
Introduction to AI in Higher Education_draft.pptx
Introduction to AI in Higher Education_draft.pptxIntroduction to AI in Higher Education_draft.pptx
Introduction to AI in Higher Education_draft.pptx
 
A Critique of the Proposed National Education Policy Reform
A Critique of the Proposed National Education Policy ReformA Critique of the Proposed National Education Policy Reform
A Critique of the Proposed National Education Policy Reform
 
Accessible design: Minimum effort, maximum impact
Accessible design: Minimum effort, maximum impactAccessible design: Minimum effort, maximum impact
Accessible design: Minimum effort, maximum impact
 
Interactive Powerpoint_How to Master effective communication
Interactive Powerpoint_How to Master effective communicationInteractive Powerpoint_How to Master effective communication
Interactive Powerpoint_How to Master effective communication
 
TataKelola dan KamSiber Kecerdasan Buatan v022.pdf
TataKelola dan KamSiber Kecerdasan Buatan v022.pdfTataKelola dan KamSiber Kecerdasan Buatan v022.pdf
TataKelola dan KamSiber Kecerdasan Buatan v022.pdf
 
Introduction to ArtificiaI Intelligence in Higher Education
Introduction to ArtificiaI Intelligence in Higher EducationIntroduction to ArtificiaI Intelligence in Higher Education
Introduction to ArtificiaI Intelligence in Higher Education
 
Separation of Lanthanides/ Lanthanides and Actinides
Separation of Lanthanides/ Lanthanides and ActinidesSeparation of Lanthanides/ Lanthanides and Actinides
Separation of Lanthanides/ Lanthanides and Actinides
 
_Math 4-Q4 Week 5.pptx Steps in Collecting Data
_Math 4-Q4 Week 5.pptx Steps in Collecting Data_Math 4-Q4 Week 5.pptx Steps in Collecting Data
_Math 4-Q4 Week 5.pptx Steps in Collecting Data
 
Organic Name Reactions for the students and aspirants of Chemistry12th.pptx
Organic Name Reactions  for the students and aspirants of Chemistry12th.pptxOrganic Name Reactions  for the students and aspirants of Chemistry12th.pptx
Organic Name Reactions for the students and aspirants of Chemistry12th.pptx
 

A Measure Of Service Quality For Retail Stores Scale Development And Validation

  • 1. A Measure of Service Quality for Retail Stores: Scale Development and Validation Pratibha A. Dabholkar Dayle I. Thorpe Joseph O. Rentz University of Tennessee, Knoxville Current measures of service quality do not adequately capture customers'perceptions of service qualityfor retail stores (i.e., stores that offer a mix of goods and services). A hierarchical factor structure is proposed to capture dimensions important to retail customers based on the retail and service quality literatures as well as three sepa- rate qualitative studies. Confirmatory factor analysis based on the partial disaggregation technique and cross- validation using a second sample support the validity of the scale as a measure of retail service quality. The impli- cations of this Retail Service Quality Scale for practi- tioners, as well asfor future research, are discussed. INTRODUCTION The retail environment is changing more rapidly than ever before. It is characterized by intensifying competition from both domestic and foreign companies, a spate of mergers and acquisitions, and more sophisticated and de- manding customers who have greater expectations related to their consumption experiences (Sellers 1990; Smith 1989). Consequently, retailers today must differentiate themselves by meeting the needs of their customers better than the competition. There is general agreement that a basic retailing strategy for creating competitive advantage is the delivery of high service quality (e.g., Berry 1986; Hummel and Savitt 1988; Reichheld and Sasser 1990). The most widely known and discussed scale for mea- suring service quality is SERVQUAL, a scale designed to Journal of the Academy of Marketing Science. Volume 24, No. 1, pages 3-16 Copyright 9 1996 by Academy of Marketing Science. measure five dimensions of service quality: tangibles, reliability, responsiveness, assurance, and empathy. Al- though SERVQUAL has been empirically tested in a num- ber of studies involving "pure" service settings (e.g., banking, long-distance telephone service, securities bro- kerage, and credit card service), it has not been success- fully adapted to and validated in a retail store environment. In fact, little research has been conducted in retail settings, defined here as stores that offer a mix of merchandise and service. A retail store experience involves more than a nonretail service experience in terms of customers negoti- ating their way through the store, finding the merchandise they want, interacting with several store personnel along the way, and returning merchandise, all of which influence customers' evaluations of service quality. Thus, although measures of service quality for pure service environments and for retail environments are likely to share some com- mon dimensions, measures of retail service quality must capture additional dimensions. Our purpose is to investi- gate the dimensions of service quality in a retail environ- ment and to develop and validate a scale to measure retail service quality. EXPLORING POSSIBLE FACTOR STRUCTURES FOR RETAIL SERVICE QUALITY An examination of the retail literature offers little to support a theory-based factor structure of retail service quality. The retail literature focuses on service quality at either the integrated or the attribute level; there is a lack of discussion of service quality at the factor (or dimension) level. At the integrated level, Westbrook (1981) suggests that two broad categories of retailer-related experiences
  • 2. 4 JOURNAL OFTHEACADEMYOFMARKETINGSCIENCE WINTER1996 are important to the customer: (1) in-store experiences and (2) experiences related to the merchandise. In-store expe- riences include interactions with store employees as well as the ease of walking around the store. Experiences re- lated to merchandise include quality and availability of merchandise. Although we agree that these experiences are important to retail customers, both categories appear to encompass more than one factor or dimension. In addition, there may be an overlap between the two categories. For example, merchandise displays could be viewed both as in-store experiences and experiences related to merchan- dise. Viewing service quality at this integrated level does little to suggest the separate and critical dimensions of retail service quality that would be useful to retailers and researchers. At the attribute level, researchers suggest that store layout and the quality of merchandise are important to the customer's perception and evaluation of retail stores (Gutman and Alden 1985; Hummel and Savitt 1988; Mazursky and Jacoby 1985; Oliver 1981). Store layout includes the ease of locating desired merchandise and the ease of moving around in the store. Westbrook (1981 ) and Mazursky and Jacoby (1985) report that other important criteria on which customers evaluate retail stores are the credit and charge account policies of the store and the ease with which stores refund or exchange merchandise. Baker, Grewal, and Parasuraman (1994) suggest that store envi- ronment encompassing ambient attributes (e.g., music), design attributes (e.g., physical facilities), and social attri- butes (e.g., customer responsiveness of service providers) are important to customers of retail stores in evaluating service quality. Another attribute identified as important to retail shoppers is ease of parking (Oliver 1981). Finally, Westbrook (1981) suggests that customers are sensitive to a service provider's willingness to promptly attend to problems or complaints. Although it is useful to review the retail literature to develop a list of attributes that are important to customers in evaluating retail service experi- ences, there is little support to suggest how these attributes may be combined into a few critical dimensions of retail service quality. Because of the weak theoretical support for a factor structure provided by the retail literature, a review of the service quality literature was conducted to suggest possi- ble factors for retail service quality. As mentioned earlier, researchers have attempted to test and/or adapt the SERVQUAL instrument in various settings. These settings include a health care setting (Babakus and Mangold 1989), business-to-business services (Brensinger and Lambert 1990), a dental school patient clinic, business schoolplace- ment center, tire store, and acute care hospital (Carman 1990), a utility company (Babakus and Boller 1991), department stores (Finn and Lamb 1991), health care (Bowers and Swan 1992), banking, pest control, dry clean- ing, and fast food (Cronin and Taylor 1992), department stores (Guiry, Hutchinson, and Weitz 1992), the computer software industry (Pitt, Oosthuizen, and Morris 1992), and banking (Spreng and Singh 1993). In general, these studies do not support the factor structure posited by Parasuraman, Zeithaml, and Berry (1988). See Table 1 for a review of the methodology and results from these studies. The studies of particular interest to this research are those conducted in a retail setting. Carman (1990) tested SERVQUAL mainly in pure service settings (dental school patient clinic, business school placement center, acute care hospital); the one exception was a tire store, an example of a retailer offering a mix of merchandise and services. Carman found nine factors of service quality, concluded that the five dimensions identified by Parasuraman et al. (1988) were not generic, and suggested that the instrument be adapted by adding items or factors as pertinent to different situations. Finn and Lamb (1991) tested SERVQUAL in four different types of retail stores, ranging from "stores like Kmart" to "stores like Neiman Marcus." Using confirma- tory factor analysis, Finn and Lamb were unable to find a good fit to the proposed five-factor structure and con- cluded that SERVQUAL, without modification, could not be used as a valid measure of service quality in a retail setting. However, they did not offer an alternative accept- able structure or measure. In an unpublished paper, Guiry et al. (1992) modified the original 22-item SERVQUAL to a 51-item instrument by dropping 7 items and adding 36 new items designed to measure service attributes at the retail store level. Explora- tory factor analysis revealed seven dimensions: (1) personal service during interaction with employees, (2) merchan- dise assortment, (3) store transaction procedure reliability, (4) employee availability in the store before interaction, (5) tangibles, (6) store service policy reliability, and (7) price. Although this study represents a good start toward the development of a service quality scale for the retail setting, the research was based on exploratory factor analysis and not on a theory-based factor structure. Addi- tionally, the inclusion of price in a servicequality construct explication is unusual. Although we recognize that price is an important determinant of store patronage, we view it as distinct from service quality. Finally, in a study on customer evaluations of banking, Spreng and Singh (1993) performed a confirmatory factor analysis of SERVQUAL and found a poor fit for the five dimensions. They found a lack of discriminant validity between responsiveness and assurance and noted that al- though modification indices were high, there was no clear indication for ways to improve the model fit. TRIANGULATION OF QUALITATIVE RESEARCH TECHNIQUES Given the lack of a theory-based factor structure from the retail literature and the fact that SERVQUAL has not been supported or successfully adapted to retailing, it was deemed necessary to conduct further research to gain an understanding of the dimensions of retail service quality. To accomplish this end, qualitative research was con- ducted using three different qualitative methodologies-- phenomenological interviews, exploratory depth
  • 3. Dabholkaret al. / RETAILSERVICEQUALITY TABLE 1 Summary of SERVQUAL Replication Studies Study Instrument Analysis FactorStructure Babakusand Mangold(1989) Carman(1990) Brensingerand Lambert (1990) Finn andLamb (1991) Babakusand Boiler (1991) Pitt, Oosthuizen,and Morris (1992) Guiry,Hutchinson,and Weitz(1992) Croninand Taylor(1992) Bowersand Swan (1992) Sprengand Singh(1993) 15of original22 items Modificationsof SERVQUAL (using 12 to 21 of the original itemsin each case) Allof original22 items Allof original22 items Allof original22 items Allof original22 items 51 items(15 fromthe original 22 itemsplus 36 addeditems) Allof original22 items Focus groups Allofthe original22 items Exploratoryfactoranalysis Principalaxis factoranalysis followedby obliquerotation Principalaxis factoranalysis followedby obliquerotation Confirmatoryfactoranalysis Principalaxis factoranalysis followedby obliquerotation as well as confirmatoryfactor analysis(CFA) Principalcomponentsfactor analysisfollowedby promax rotation Exploratoryfactoranalysis (1) Confirmatoryfactoranalysis (CFA);(2) OBLIMINoblique factorrotation Qualitativemethodologies Confirmatoryfactoranalysis One meaningfulfactorwas found.Could not identifythe a priorifive-factorstructure. Five to nine factorswere identified. A five-factorstructurewas found,but only four had eigenvahies> 1. The five-factorstructurehad a poor fit. No other structureswere analyzed. The five-factorstructurewas not supported and no other structureswere analyzed. CFAresultedin a two-factorstructure. The only studyto obtaina five-factorstructure. However,the factorswere differentfrom SERVQUALwith reliabilityand responsivenessloadingon one factor. A seven-factorstructurewas found. (1) CFAresultedin a unidimensionalfactor; (2) The five-factorstructurehad a poor fit. Identifiedthe fiveoriginalfactors,plus four others. The five-factorstructurehad a poor fit. Combiningresponsivenessand assurance intoone factordid not significantly improvethe fit. interviews, and tracking the customer through the store to monitor evaluations of the shopping experience. The ob- jective was to use a triangulation of research techniques to gain further insights into factors important to customers of retail stores in evaluating service quality. The first study consisted of three phenomenological interviews conducted to assign meaning to the shopping experience as the participant sees it, not as the researcher perceives it. We used the participants' own words in fol- low-up questions to probe for important issues. This study found that customers were most concerned about store layout as it pertained to walking around the store and finding what they want, treatment by service employees in terms of being helped and feeling comfortable, ease of conducting exchanges and refunds and of resolving prob- lems, and store policies regarding merchandise quality, parking, and credit card acceptance. A second study employed six depth interviews to dis- cover relevant determinants of the shopping experience not yet identified. Some of the findings of this study were similar to the first one. For example, customers were concerned about the ease of moving through the store, ease of finding what they were looking for, helpfulness of store employees, ease of returning merchandise, and store poli- cies regarding credit. In addition, the depth interviews revealed that the appearance of the store and its facilities (e.g., restrooms and fitting rooms) was important to cus- tomers. These participants also mentioned that they expected the service to be good and anything that was promised to be delivered. Finally, the third qualitative study used a "tracking" method to monitor the thought processes of three custom- ers as they evaluated a specific shopping experience. A portable tape recorder with a lavalier microphone was inconspicuously attached to the participant's clothing. As they moved through the store, interacted with merchandise and store employees, and made a purchase decision, the participants spoke aloud their thoughts, observations, and reactions, which were tape-recorded. By unobtrusively "monitoring" the customer's experience in the store, infor- mation regarding identified components of the shopping experience and the customers' interactions with these ele- ments was collected without significantly altering the natural flow of the experience. These participants com- mented on store appearance, store layout, helpfulness of service employees, availability of service personnel at the cash registers, and quality of merchandise. Because there is general agreement in the literature about the conceptual definition of service quality, in our qualitative studies we asked general questions about expe-
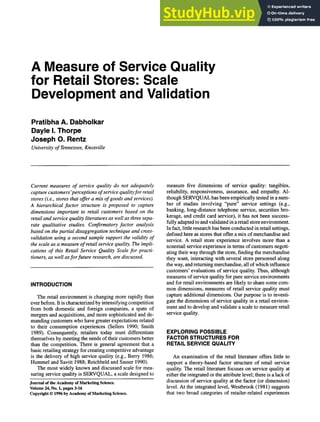
  • 4. 6 JOURNAL OFTHEACADEMYOFMARKETINGSCIENCE WINTER1996 FIGURE 1 Proposed Hierarchical Structure for Retail Service Quality Pt_EJINP R Y 2 1 1 p' NOTE:Itmaybenotedthattheindicatornumbersabovedonotrepresentthe orderin whichtheseitemswerepresentedin thequestionnaire,thatis, the itemswerenotgroupedaccordingto dimensionsbutinsteadwerescrambled.Theyarenumberedhereto matchtheorderin the appendix. riences with the retail stores. This is a very common approach in qualitative research. We then selected those aspects of the consumers' experience that were consistent with the generally accepted conceptual understanding of service quality in the literature and used these (along with the literature) to suggest dimensions of retail service qual- ity and items for measuring retail service quality. For example, if customers mentioned courteousness of the service provider and the literature also supported this notion, we included it. If they mentioned price, we ex- cluded it because price is not part of the generally accepted understanding of service quality in the literature. PROPOSED FACTOR STRUCTURE FOR RETAIL SERVICE QUALITY Combining findings from our qualitative research with the review of the retail literature and of SERVQUAL, we propose that retail service quality has a hierarchical factor structure (see Figure 1). The rationale for the hierarchical factor structure is as follows. Previous studies in which SERVQUAL had not been supported found high intercor- relations among items across factors, and several studies had found only one factor. (An initial test of SERVQUAL with our data also showed high correlations among items across factors.) These instances are strongly suggestive of the presence of a higher order factor. Parasuraman, Berry, and Zeithaml (1991) and Parasuraman, Zeithaml, and Berry (1994b) discuss these problems with dimensionality and intercorrelations using SERVQUAL and suggest that future research on service quality should investigate un- derlying causes and implications of empirical correlations among dimensions of service quality. Reviewing our qualitative research, there did appear to be a common theme throughout the interviews regarding overall retail service quality. Similarly, the retail literature suggests that customers form evaluations of retail quality both at the attribute and at the integrated level. Based on these various sources, we propose that customers think of retail service quality at three different levels--a dimension level, an overall level, and a subdimension level. We propose that five dimensions--physical aspects, reliability, personal interaction, problem solving, and policy--are central to service quality; we expect them to be distinct but highly correlated. (The five basic dimensions are based on the literature review and our qualitative research as explained below and are also strongly suggested by the correlation matrix in our initial data analysis.) Because they share an underlying theme, we expect a common higher order factor to be present, which we call (overall) retail service quality. Integrating our qualitative research, initial empirical analysis, and the retail literature, it is observed that some dimensions are more complex (as explained below) in that they have more than one component to them. In these cases, we expect the dimensions to have subdimensions that combine related attributes into subgroups. The first dimension we propose is physical aspects. This dimension has a broader meaning than does the SERVQUAL (Parasuraman et al. 1988) or the Guiry et al. (1992) tangibles dimension. In addition to the appearance of the physical facilities, it encompasses the conve- nience offered the customer by the layout of the physical facilities. Both the retail literature and our qualitative research suggest that there are two subdimensions with regard to the physical aspects of the store. Retail literature suggests that store appearance is important to retail cus- tomers (e.g., Baker et al. 1994), a notion supported by the
  • 5. Dabholkaretal./ RETAILSERVICEQUALITY 7 findings of our depth interviews and our customer tracking studies. For example, the respondents in the depth inter- views referred to the cleanliness of the store, the general appearance of the store, and the appearance of public facilities. In addition, the retail literature suggests that customers value the convenienceof shopping that physical aspects, such as store layout, offer them (Gutman and Alden 1985; Hummel and Savitt 1988; Mazursky and Jacoby 1985; Oliver 1981). This idea was supported by all three of our qualitative studies. For example, participants mentioned the ease of finding merchandise within the store ("I am familiar with the arrangement of Inerchandise, I know where to find it, it expedites the process"), and ease in moving through the aisles and racks of merchandise ("I like to be able to walk around between the racks without knocking things over"). Our second proposed dimension is reliability, which is similar to the SERVQUAL reliability dimension, except that it has two subdimensions and a couple of other vari- ations. Our depth interviews revealed that customers view reliability as a combination of keeping promises ("if they tell me Thursday, then it better be there on Thursday") and "doing it right" ("I just like people to be efficient and prompt, you know, do what I need to be done and get me out of there"). This idea of subdimensions interestingly is supported by an examination of the items used in SERVQUAL to measure reliability. Some ofthe items refer to promises and others to doing the service right. Another variation in our reliability dimension, as compared to SERVQUAL, is that we view the availability of merchan- dise (Westbrook 1981) as a measure of the reliability dimension and incorporate it into our doing-it-right subdi- mension. Our depth interviews also revealed that custom- ers value merchandise availability as reflecting the dependability of the store ("good service is stocking what I want"). A third variation is that although SERVQUAL views problem solving as part of reliability, we see it as a separate dimension. These variations also distinguish our reliability dimension from Guiry et al.'s (1992) procedural reliability. The third dimension we propose is personal interac- tion. Although this sounds similar to Guiry et al.'s (1992) personal service dimension, we envision two subdimensions--service employees inspiring confidence and being courteous/helpful. We believe these subdimen- sions are very closelyrelated and capture how the customer is treated by the employee. The rationale for this dimension is as follows. To begin, we noticed that the SERVQUAL dimensions of responsiveness and assurance appeared to be related and that some items from SERVQUAL's empa- thy dimension also seemed to overlap with this factor. This notion has support in the numerous studies that have tested SERVQUAL (Babakus and Boiler 1991; Babakus and Mangold 1989; Carman 1990; Guiry et al. 1992; Pitt et al. 1992) as well as in a working paper by the authors of SERVQUAL (Parasuraman et al. 1994b). The second rea- son for suggesting one main dimension of personal inter- action with two underlying subdimensions emerged from our qualitative research. Respondents in the phenomeno- logical interviews consistently indicated the importance of feeling confident about shopping at a particular store. Comments included, "I do not feel intimidated by anything at the store," "I feel very comfortable shopping at the store," and "I feel free to shop and look without feeling pressured." These comments evoke the assurance dimen- sion of SERVQUAL, but it is not proposed as a separate dimension because the comments were interwoven with comments about courteousness/helpfulness, and both as- pects (or subdimensions) appeared to be part of a larger whole, which we called the personal interaction dimension because all these comments relate to the personal interac- tion between the customer and the service employee in the store. Support for the courteousness/helpfulness subdi- mension came from all three qualitative studies. Partici- pants in the depth interviews and customer tracking specifically mentioned helpfulness of store employees. Participants in the phenomenological interviews indicated the importance of this subdimension by comments such as, "people are friendly there," "I want to have access to someone that can help me," "the sales associates make me feel that they're there, if I need them," and "I want to be able to pick up the phone and have access to someone that can help me." We introduce a new fourth dimension, problem solving, which addresses the handling of returns and exchanges as well as of complaints. Although this dimension would also involve interaction between the customer and the em- ployee, it is specificallyrelated to the handling of problems and therefore merits a separate dimension. Given that service recovery is being recognized as a critical part of good service (Hart, Heskett, and Sasser 1990; Kelley and Davis 1994), we expect that recognizing and resolving problems should emerge as a separate factor in customer evaluation. Westbrook (1981) found that customers were quite sensitive to how serviceproviders attend to problems and complaints. Westbrook, along with Mazursky and Jacoby (1985), also mentions that the ease of returning and exchanging merchandise is very important to retail cus- tomers. Our own qualitative research supported these find- ings. Participants in the phenomenological interviews commented that this aspect was important to them ("I like stores that are very good at taking back returns" and "I like to bring something home and think about it and feel free to return it"). Participants in the depth interviews con- curred ("I do not buy anything that I cannot return"). Our fifth dimension, policy, is again suggested both by the retail literature and our qualitative research. This dimension captures aspects of service quality that are directly influenced by store policy.When customers evalu- ate whether a store has convenient hours, for example, this is viewed as whether the store's policy is responsive to customers' needs. Westbrook (1981) and Mazursky and Jacoby (1985) report that an important criterion on which customers evaluate stores is the credit and charge account policies of the store. Customers also appear to value park- ing availability for retail shopping (Oliver 1981). These findings were supported in all three of our qualitative studies. Participants referred to the quality of merchandise ("I'm interested in the quality of clothes"), convenient parking ("I can get a fairly close parking spot"), credit card
  • 6. 8 JOURNAL OFTHEACADEMYOFMARKETINGSCIENCE WINTER1996 usage ("I love having a credit card rather than writing a check, it's a very convenient tool for me"). To summarize, we propose a hierarchical factor struc- ture for retail service quality with five basic dimensions, with overall service quality as a second-order factor, and with three of the five dimensions having two subdimen- sions (see Figure 1). Although this hierarchical structure can be divided into three models for the purpose of expli- cation, the model with the five basic dimensions, the model with the second-order factor, and the model with the sub- dimensions are not separate models per se, but special cases of the generalized model shown in Figure 1. For e.xample, the model with the five dimensions can be viewed as the most basic. The subdimensions model gets more specific in terms of three of the dimensions, whereas the second-order model captures the common variance among the dimensions in a meaningful way. ITEM GENERATION AND SCALE DEVELOPMENT Our proposed measure of retail service quality is a 28-item scale, consisting of 17 items from SERVQUAL and 11 items developed from the literature review and our qualitative research (see appendix). To generate items to measure our five main dimensions, we first scrutinized the 22 items in the SERVQUAL scale. Although we propose a different factor structure, we felt comfortable with using modified SERVQUAL items in our scale, because they are based on extensive qualitative research conducted by Parasuraman et al. (1988). Items that appropriately cap- tured the essence of the factors were retained in our scale, whereas items that were deemed inappropriate in terms of wording/meaning were not included. (An initial test of the SERVQUAL items revealed that this latter set of items had high modification indices as well.) A total of five items from SERVQUAL were dropped. The item" will have the customer's best interests at heart" and the item "The employees o f under- stand the specific needs of their customers" were deemed to be inappropriate. Scrutiny of these items suggested that the phrases "best interests at heart" and "understand the specific needs" might be vague and confusing to respon- dents. Another item, "Employees at _ _ are neat- appearing," was not included because the use of the words "neat appearing" is not part of everyday language and may mean different things to different people. The item "Em- ployees in _ _ are always willing to help customers," was not used after an examination of the wording revealed that the item was somewhat confounding, suggesting both personal interaction ("willing to help") and reli- ability ("always"). Finally, the item" has employees who give customers personal attention" was not used, because we realized that another item, " gives customers individual attention," essentially captured the same aspect of service quality. The 17 items retained from SERVQUAL were assigned to the appropriate subdimension in our proposed hierarchi- cal factor structure (see Figure 1 and appendix). Three SERVQUAL items related to modern-looking equipment, physical facilities, and store materials (P1, P2, P3) were expected to be indicators of the appearance subdimension of the physical aspects dimension of retail service quality. The two items measuring customers' perceptions of how well the store fulfills its promises (P7, P8) were assigned to the promises subdimension of the reliability dimension. The two items relating to performing the service right the first time and error-free transactions (P9, P11) were used as indicators of the doing-it-right subdimension of the reliability dimension. Three assurance items from SERVQUAL regarding knowledge, confidence, and safety (P12, P13, P14) were assigned to the inspiring confidence subdimension of the personal interaction dimension. The fourth assurance item (P19) related to courteousness and was assigned to the courteous/helpful subdimension of the personal interaction dimension. Three responsiveness items from SERVQUAL related to prompt service, telling customers when services will be performed, and never being too busy to respond to customers' requests (P15, P16, P17) were also assigned to this subdimension, as was an empathy item on individual attention (P 18). A reliability item from SERVQUAL measuring interest in solving cus- tomers' problems (P22) was predicted to load on the problem-solving dimension. Finally, the item related to convenient operating hours (P26) was expected to be an indicator of the policy dimension. Based on the literature review as well as our own qualitative research, we developed 11 new items to mea- sure retail service quality. An item was developed to mea- sure the appearance of public areas (P4) as an additional indicator of the appearance subdimension of the physical aspects dimension. Two items related to store layout, which includes the ease of locating desired merchandise and the ease of moving around in the store (P5, P6), were added to the instrument to capture the convenience subdi- mension of the physical aspects dimension. An item on merchandise availability (P10) was added as an indicator of the doing-it-right subdimension of reliability. Given that customers expect the same level of courteous service on the telephone as they would in a face-to-face encounter, an item related to telephone courtesy (P20) was added as another indicator of the courteous/helpfulness subdimen- sion of personal interaction. Two new items were devel- oped for the problem-solving dimension. One measured customers' perceptions of how willingly retail stores han- dle returns and exchanges (P21), and the other measured customers' perceptions of the handling of complaints (P23). In addition to the earlier item on operating hours, four new items were developed for the policy dimension-- an item on the quality of merchandise (P24), an item related to convenient parking (P25), and two items related to credit card policies (P27, P28). Both perceptions and expectations items were devel- oped to allow perceptions only, as well as disconfirmation type analysis. The perceptions items are presented in the appendix. Matching expectation items substitute "excel- lent retail stores" for "this store" in the perception items. For example, the expectation item to match P1 would read "Excellent retail stores Will have modern-looking equip-
  • 7. Dabholkar et al. / RETAIL SERVICE QUALITY 9 ment and fixtures." Only the perceptions data are analyzed and presented in this article to avoid psychometric prob- lems with difference scores (Brown, Churchill, and Peter 1993; Cronin and Taylor 1992, 1994; Parasuraman, Zeithaml, and Berry 1994a; Teas 1993, 1994). However, the proposed factor structure is amenable to a disconfirma- tion approach, which could be used to determine gaps in service quality. As recommended by Parasuraman et al. (1991), the 7-point rating scale used in SERVQUAL was reduced to a 5-point scale (1 = strongly disagree, 5 =strongly agree). To allow comparison to existing scales for the measurement of service quality (i.e., SERVQUAL), we collected data on all 22 SERVQUAL items, encom- passing the five items that were not included in our mea- sure of retail service quality. DATA COLLECTION Sample Selection and Size A total of seven stores from two department store chains in the southeastern United States were involved in the study. These multiunit organizations operate stores located in similar trading areas with generally similar customer profiles. Senior management personnel of both organiza- tions agreed to participate in the research. College students majoring in retailing, who were assigned to the stores as a requirement of their senior field experience, as well as regular store employees, administered the questionnaires. Detailed instructions and a supply of questionnaires were sent to each of the stores. A letter explaining the project was sent to each store manager, who had been apprised of it earlier by senior management. In addition, a follow-up telephone call to each store manager and each question- naire administrator was conducted to answer any questions or concerns before data collection began. A sample of 227 respondents was obtained. The sample consisted of 197 women with a mean age of 43.03 and 27 men with a mean age of 40.85. (Three respondents chose not to provide demographic information.) Procedure The questionnaire was self-administered at the store location. The rationale for our data collection method is based on the theory that respondents will be more attentive to the task of completing a questionnaire and will provide more meaningful responses when they are contextualized in the environment that they are evaluating. Being in the natural environment (i.e., shopping setting) is preferable to sitting at the kitchen table at home amid distractions that take precedence over the task of completing the survey. Further, being in the relevant environment, shoppers would be more likely to focus on dimensions important to them for evaluating the quality of service at the store. The questionnaire was administered just prior to the respon- dents' shopping experience so that the responses reflect evaluations of previous shopping experiences at the store. Interviewing just after a shopping experience may more closely reflect satisfaction rather than service quality (Rust and Oliver 1994). Whereas some previous studies were administered to individuals who may or may not have ever shopped at the particular store, we collectedevaluations of service quality for the specific store visited so that customers could give more meaningful responses. Further, store-specific responses are more actionable than "retail in general" responses. The data were collected during a 3-week period in the fall prior to the Christmas shopping season from the seven sample units. Every fifth adult customer entering the store was asked to complete the questionnaire provided that they had previously shopped at the store and were willing to complete the questionnaire as they entered the store. Customers who had not previously shopped at the store were excluded from the sample. Customers were sampled from morning, afternoon, and evening hours on weekdays and weekends. The questionnaires were self- administered by the respondents who were afforded a chair in a quiet area near the store entrance and a clipboard for their convenience while completing the questionnaires. TEST OF PROPOSED FACTOR STRUCTURE OF RETAIL SERVICE QUALITY The descriptive statistics (means and standard devia- tions) obtained for the items in the proposed Retail Service Quality Scale are presented in the appendix. Given that the respondents had shopped at the store before and had returned, it is not surprising that the mean values of per- ceptions regarding service quality items were toward the higher end of the scale. However, the standard deviations indicate that there was sufficient variation in the data. Partial Disaggregation To test the proposed Retail Service Quality Scale, we used confirmatory factor analysis with partial disaggrega- tion (see Bagozzi and Heatherton 1994; Hull, Lehn, and Tedlie 1991; Marsh and Hocevar 1985). The traditional structural equations approach (or total disaggregation), which uses each item as a separate indicator of the relevant construct, provides the most detailed level of analysis for construct testing, but "in practice it can be unwieldy be- cause of likely high levels of random error in typical items and the many parameters that must be estimated" (Bagozzi and Heatherton 1994, pp. 42-43). On the other hand, total aggregation of items within dimensions does not offer much advantage over traditional multivariate analysis, al- though it does provide fit indices. The partial disaggrega- tion technique is seen as a compromise between these two extremes. It allows one to proceed with meaningful re- search by combining items into composites to reduce higher levels of random error and yet it retains all the advantages of structural equations, including accounting for measurement error, allowing for multiple, multidimen- sional variables, and testing for hierarchical factor structure.
  • 8. 10 JOURNAL OF THEACADEMYOF MARKETINGSCIENCE WINTER1996 FIGURE 2 Retail Service Quality: The Five Basic Dimensions dp51= .820 ~ 4i---'~"666 ~52._.~"90_._~ 2 . oo KEY:11= P1 + P3 + P5 I2=P2+P4+P6 13= P7 + P9 I4=P8 +P10+Pll 15=P12+P14+P15+P17+P19 Operationally, partial disaggregation is accomplished by randomly aggregating items that relate to a given con- struct so that there are two or three combined indicators instead of several single-item indicators. The rationale for randomcombination of items is that all items or indicators related to a latent variable should correspond in the same way to that latent variable; thus any combination of these items should yield the same model fit. Test of Five Basic Dimensions Although there are many instances of testing second- order factor models in the literature, we could not find an example of a third-order factor model. Nevertheless, de- spite the lack of a precedent for doing so, we tried to run a third-order factor model as shown in Figure 1, but this model was not implementable. We, therefore, decided to test the model in three stages--a test of the five basic dimensions, a test of the second-order factor, and a test of the subdimensions. These tests would reveal whether our proposed hierarchical structure was supported in part or whole. The first step in assessing the hierarchical factor struc- ture, as outlined above, was to test whether the five basic dimensions (see Figure 1) were well supported as descrip- tors of retail service quality. At this stage, we were not testing subdimensions. Hence, for example, all six indica- tors for physical aspects (see Figure 1) were treated as equivalent indicators of this dimension and were combined in a random manner to create two composite indicators for the construct (see Figure 2). Partial disaggregation of this model yielded an excellent fit (%2= 48.92, df= 30, AGFI 16 = P13+ P16 + P18 + P20 17 = P21 4-P23 I8= P22 19 = P24+ P26+ P28 11o= P25 + P27 = 0.92, CFI = 0.99, RMSR = .03), l as shown in Table 2. The factor loadings and covariances obtained from a test of the five basic dimensions are shown in Figure 2. By all indications, the model was well supported, leading us to conclude that our five basic dimensions appear to be well suited for measuring retail service quality. Test of Retail Service Quality as a Higher Order Factor The next step was to determine if retail service quality may be viewed as a higher order factor to these dimen- sions. Using the same indicators for the dimensions as before, we modeled retail service quality as a second-order factor (see Figure 3). The first-order factors were allowed to correlate as before and the inclusion of the second-order factor resulted in lower correlations among first-order factors (not shown in Figure 3 to keep it from becoming cluttered). Partial disaggregation analysis of this model also found an excellent fit (%2 = 59.11, df= 30, AGFI = 0.90, CFI = 0.98, RMSR = .03), as shown in Table 2. The factor loadings and gamma values for the second-order model are shown in Figure 3. One lambda value for each dimension was set at 1.00, as is typical of second-order factor analysis. Also, an examination of the modification indices did not suggest any changes in the model. The results led us to conclude that the second-order factor structure for retail service quality is well supported. This suggests that customers evaluate retail service quality on the five basic dimensions but that they also view overall retail service quality as a higher order factor that captures a meaning common to all the dimensions.
  • 9. Dabholkar et al. / RETAIL SERVICE QUALITY TABLE 2 Summary Results of Confirmatory Factor Analysis for the Proposed Factor Structure of Retail Service Quality 11 Z2 df p AGFI CFI RMSR Firststudy(n = 227) Model testing five basic dimensions of retail service quality as first-order factors 48.92 30 .02 0.92 0.99 .03 Model testing retail service quality as a second-order factor to the five basic dimensions 59.11 30 .01 0.90 0.98 .03 Model testing six subdimensions of retail service quality as fast-order factors 88.71 45 .00 0.89 0.98 .03 Model testing six subdimensions of retail service quality with corresponding dimensions as second-orderfactors 107.20 45 .00 0.87 0.97 .03 Cross-validationstudy(n = 149) Modeltestingfivebasicdimensionsofretailservice~tualityas first-orderfactors 32.21 30 .36 0.93 1.00 .02 Modeltestingretailservicequalityas a second-orderfactorto the fivebasicdimensions 61.00 30 .01 0.86 0.98 .03 Modeltestingsix subdimensionsofretailservicequalityas first-orderfactors 81.03 45 .01 0.87 0.97 .04 Modeltestingsix subdimensionsof retailservicequalitywithcorrespondingdimensions as second-orderfactors 76.11 45 .01 0.87 0.98 .04 FIGURE 3 Retail Service Quality: Service Quality as a Second-Order Factor to the Five Basic Dimensions Xll= 1.000 X21--1.017 )'32-- 1.000 XS4 ='956 ~'95--1.000 ~o5--=.896 KEY: 11 = P1 + P3 + P5 12= P2 + P4+ P6 I3=P7+P9 I4=P8 +P10+Pll 15=P12+P14+P15 +P17 +P19 16= P13 + P16 + P18 +P20 17= P21 + P23 I8 = P22 I9 = P24 + P26 + P28 I10 = P25 + P27 Test of Six Subdimensions The last test of the proposed hierarchical factor struc- ture was the test for subdimensions. Three of the basic dimensions of our hierarchical structure for retail service quality had been proposed to have two subdimensionseach (see Figure 1). Hence a model to test this structure viewed these three dimensions as second-order factors to the six subdimensions (see Figure 4). The indicators for each subdimension or first-order factor were randomly com- bined into two composite indicators. A partial disaggrega- tion analysis of this model showed a good fit, both at the first-order level (X2= 88.71, df= 45, AGH = 0.89, CH = 0.98, RMSR = .03), and at the second-order level (;~2= 107.20, df= 45, AGFI = 0.87, CFI = 0.97, RMSR = .03), as shown in Table 2. The factor loadings, covariances, and gamma values are indicated in Figure 4. Thus all three levels of our proposed hierarchical struc- ture are very strongly supported, suggesting that the full model of retail service quality (see Figure 1) is valid. What this means is that consumers evaluate retail service quality according to the proposed five basic dimensions, and in
  • 10. 12 JOURNAL OF THE ACADEMY OF MARKETING SCIENCE WINTER 1996 FIGURE 4 Retail Service Quality: The Six Subdimensions t~~1= .887 Y]I .728 7 =. =. 7 d~21= .879 ~ 32= .896 ]r = X53--1.000 ~,63=1.084 ~,74=1.000 X84--1.072 .935 "153 70 ~. 44 = . . = . 2 . KEY: I1 = P1 + P10 I2 = P2 + P19 13 = P6 I4 = P7 I5 = P4 16 = P20 addition, they view overall service quality as a higher order factor and that some of the basic dimensions have subdi- mensions associated with them in the consumer's mind. CROSS-VALIDATION STUDY Even though our proposed factorial structure has an excellent fit with the data, we recognize that the results could be specific to this particular sample. Therefore, a second study using the same instrument was conducted to validate our findings. The study was conducted during a 7-day period at two store units of one of the same organi- zations involved in the main study. A total of 149 com- pleted questionnaires were collected. The procedure for the main study was duplicated in the cross-validation study with the exception of using student assistants to collect the data, rather than retail interns or store employees. The results of this study are also presented in Table 2. It is seen that the model testing the five basic dimensions had an excellent fit (~2 = 32.21, df=30, AGFI = 0.93, CFI = 1.00, RMSR = .02),2thus providing cross-validation for the five basic dimensions. The second-order model also had an excellent fit ()C2= 61.00, df=30, AGFI = 0.86, CFI = 0.98, RMSR = .03), thus cross-validating the existence of retail service quality as a higher order,factor to the five dimen- sions. Finally, the model testing the six subdimensions also showed an excellent fit, both at the first-order level (~2 = I7 = P15 18 = P13+ P14 I9=P12 +P28 II0 = P27 I11 = P16 + P21 + P29 I12 = P22 + P31 + P32 81.03, df= 45, AGFI = 0.87, CFI = 0.97, RMSR = .04), and at the second-order level (~2 = 76.11, df=45, AGFI = 0.87, CFI = 0.98, RMSR = .04), thus providing cross- validation for the subdimensions. Thus the validation study also supported the entire hierarchical factor structure. CONSTRUCT RELIABILITY AND VALIDITY OF THE RETAIL SERVICE QUALITY SCALE Construct reliabilities were computed from confirma- tory factor analyses conducted separately for each dimen- sion and subdimension of the Retail Service Quality Scale that had four or more items, and these reliabilities ranged from 0.81 to 0.92 (see Table 3). Cronbach's alpha was computed for dimensions and subdimensions with fewer than four items, and the values for alpha ranged from 0.83 to 0.89 (see Table 3). The construct reliability of the overall scale computed from a confirmatory factor analysis con- ducted on all the items was 0.74 (see Table 3). The high construct reliabilities suggest that service quality analysis could be appropriately conducted at the dimension or subdimension level, as well as at the overall level. Given that we have developed a new scale to measure the construct of retail service quality, it is appropriate to examine construct validity--specifically in terms of con- vergent, discriminant, and predictive validities. Conver- gent validity of the Retail Service Quality Scale cannot be
  • 11. TABLE 3 Construct Reliability and Predictive Validity of Retail Service Quality Scale Predictive Validity With Correlations Number Construct Intention Intention of ltems Reliability to Shop to Recommend Overall scale 28 0.74 0.65 0.70 Dimensions Physical aspects 6 0.85 0.55 0.64 Reliability 5 0.90 0.44 0.54 Personal interaction 9 0.90 0.58 ' 0.59 Problem solving 3 0.87a 0.66 0.64 Policy 5 0.92 0.63 0.66 Subdimensions Appearance 4 0.81 0.45 0.53 Convenience 2 0.89a 0.50 0.62 Promises 2 0.83a 0.44 0.51 Doing it right 3 0.86a 0.39 0.51 Inspiring confidence 3 0.84a 0.66 0.63 Courteous/helpful 6 0.89 0.63 0.62 a. Cronbach's alpha (given that these dimensions/subdimensions had fewer than four items each and hence construct reliability from separate confirmatory factor analyses would not be meaningful). ascertained in the typical sense of using different methods to test the construct because we only used one method. However, given that all the items loaded highly on the factors to which they were assigned is itself a test of convergent validity of the scale. A test of discriminant validity is especially important, given that some of the dimensions are highly correlated. One accepted test of discriminant validity is to determine whether the covari- ance and two standard errors add to less than 1.00. We used this procedure on all possible pairs of the five dimensions and found values ranging from 0.75 to 0.98. Thus all dimensions are statistically distinct even after correcting for measurement error and do have discriminant validity. In a practical sense, they are highly correlated, and in particular, the policy dimension is very highly correlated with the reliability and personal interaction dimensions. This could explain why there is so much common variance to make a higher order factor structure appropriate. To determine the predictive validity of the retail scale, data had been collected on two dependent variables-- intentions to shop at the store and intentions to recommend the store to others. Each variable was measured using two 7-point semantic differential scales with endpoints likely/unlikely and possible/impossible as well as a third 5-point intention scale with anchors definitely would, probably would, and so on, to definitely would not shop/recommend. Predictive validity was ascertained us- ing correlations between the retail service quality scale (at the dimension, subdimension, or overall scale level) and these two dependent variables. The results are presented in Table 3 and show strong predictive validity for the Retail Service Quality Scale at the dimension, subdimension, or overall level.3 Dabholkar et al. / RETAIL SERVICE QUALITY 13 DISCUSSION Our proposed measurement tool is suited for studying retail businesses that offer a mix of services and goods, such as department or specialty stores, to gather bench- mark data regarding current levels of service quality as well as to conduct periodic "checks" to measure service improvement. The instrument could serve as a diagnostic tool that will allow retailers to determine service areas that are weak and in need of attention. One way to do this is by testing the three forms of the generalized hierarchical model. If retailers are greatly concerned about parsimony, they may use only the model with the five basic dimen- sions. However, given that no additional items are needed to run the model with subdimensions, retailers may appre- ciate the additional information on subdimensions ob- tained by further partitioning the variance. Finally, by proposing retail service quality as a second-order factor, retailers can capture the extent of common variance or the extent to which the basic dimensions represent overall service quality. Another way to use the instrument as a diagnostic tool at different levels of analysis does not require the use of structural models. Service quality analysis can be per- formed at the overall level (using the full scale in an additive fashion), at the factor level (using items within a given dimension in an additive fashion), and at the subdi- mension level (using items within a given subdimension in an additive fashion). Analysis of data at these different levels would allow evaluations of overall quality and di- mension quality and would permit managers to identify problem areas within their stores (at the dimension or subdimension level) to concentrate resources on improv- ing particular aspects of service quality. The hierarchical structure of the scale has implications for practitioners as well as academics. Practitioners are often interested in determining overall service quality as well as dimensions of service quality. Past studies have typically used single-item measures of overall service quality where it is possible that customers could focus on certain aspects of the services in their minds while re- sponding to these questions. Consequently, these measures may not accurately reflect overall service quality. Al- though no researcher can claim to definitively capture customer perceptions of overall service quality, we believe that we come closer to capturing these overall evaluations because the second-order factor extracts the underlying commonality among dimensions. If the respondents have thoughtfully answered all the questions, then in addition to obtaining their evaluations of the dimensions, the sec- ond-order factor model captures the common variance among these dimensions, reflecting the respondents' over- all assessment of service quality. Future academic research on scale development in a variety of contexts could inves- tigate the appropriateness of hierarchical structures for scales. In addition to determining any common variance as explained, an investigation of subdimensions would allow researchers to further partition the variance in a meaningful way.
  • 12. 14 JOURNALOF THE ACADEMYOFMARKETINGSCIENCE WINTER 1996 An obvious extension of this research is to conduct replication studies for other retailers who offer a mix of services and goods. In addition, the scale can be modified to measure service quality at a departmental level within the store if the retail manager wants to compare customer evaluations across departments. It can also be easily modi- fied to compare evaluations of retail service quality for competing retailers. We see the scale as a generalized retail service quality scale that can be adapted to specific circum- stances. For example, future research could explore whether an adaptation of this scale, de-emphasizing the personal interaction dimension, would be appropriate for self-service stores. Continued refinement of the retail service quality scale proposed and supported in this study is certainly possible based on further qualitative research and changes in retail- ing trends. Such modifications could include the addition or deletion of items, or even a modification of the hierar- chical factor structure if so indicated. Although we at- tempted to cover all aspects of retail service quality by examining the retailing literature and by conducting a broad range of qualitative research, we recognize that there may be aspects of retail service quality that may have been omitted or that may become relevant as new trends in retailing evolve. In future research, customers may reveal new aspects of retail service quality that are important to them, and these would have to be incorporated in the scale to ensure a valid measure of retail service quality on an ongoing basis. The development and testing of the Retail Service Quality Scale has implications for other service industries as well. Based on this study, as well as the other studies cited, it appears that a measure of service quality across industries is not feasible. Therefore, future research on service quality should involve the development of industry-specific measures of service quality following the triangulation of qualitative research procedures and the cross-validation technique used in this study. APPENDIX Factor Structure for the Retail Service Quality Scale SERVQUAL Dimension Retail Service Quality Dimension Retail Service Quality Subdimension Perception Item Mean SD Tangibles Tangibles Tangibles (NI) (NI) (NI) Reliability Reliability Reliability (NI) Reliability Assurance Assurance Assurance Responsiveness Responsiveness Responsiveness Empathy Assurance (NI) Physical aspects Physical aspects Physical aspects Physical aspects Physical aspects Physical aspects Reliability Reliability Reliability Reliability Reliability Personal interaction Personal interaction Personal interaction Personal interaction Personal interaction Personal interaction Personal interaction Personal interaction Personal interaction Appearance Appearance Appearance Appearance Convenience Convenience Promises Promises Doing it right Doing it right Doing it right Inspiring confidence Inspiring confidence Inspiring confidence Courteousness/ helpfulness Courteousness/ helpfulness Courteousness/ helpfulness Courteousness/ helpfulness Courteousness/ helpfulness Courteousness/ helpfulness P1. This store has modern-looking equipment and fixtures. P2. The physical facilities at this store are visually appealing. P3. Materials associated with this store's service (such as shopping bags, catalogs, or statements) are visually appealing P4. This store has clean, attractive, and convenient public areas (restrooms, fitting rooms). P5. The store layout at this store makes it easy for customers to find what they need. P6. The store layout at this store makes it easy for customers to move around in the store. P7. When this store promises to do something by a certain time, it will do so. PS. This store provides its services at the time it promises to do so. P9. This store performs the service right the first time. P10. This store has merchandise available when the customers want it. P11. This store insists on error-free sales transactions and records. P12. Employees in this store have the knowledge to answer customers' questions. P13. The behavior of employees in this store instill confidence in customers. P14. Customers feel safe in their transactions with this store. P15. Employees in this store give prompt service to customers. P16. Employees in this store tell customers exactly when services will be performed. P17. Employees in this store are never too busy to respond to customer's requests. P18. This store gives customers individual attention. P19. Employees in this store are consistently courteous with customers. P20. Employees of this store treat customers courteously on the telephone. 4.19 4.39 4.37 4.37 4.34 4.39 4.30 4.37 4.30 4.21 4.21 4.48 4.40 4.54 4.48 4.25 4.39 4.46 4.54 4.33 1.01 0.85 0.85 0.84 0.92 0.92 0.83 0.76 0.83 0.91 0.89 0.64 0.76 0.72 0.74 0.83 0.77 0.75 0.71 0.86
  • 13. Dabholkar et al. / RETAIL SERVICE QUALITY 15 APPENDIX Continued SERVQUAL Dimension Retail Service Retail Service Quality Quality Dimension Subdimension Perception Item Mean SD NI) Problem solving None Reliabifity Problem solving None (NI) Problem solving None (NI) Policy None (NI) Policy None Empathy Policy None (NI) Policy None (NI) Policy None P21. This store willingly handles returns and exchanges. 4.54 0.73 P22. When a customer has a problem, this store shows a 4.45 0.75 sincere interest in solving it. P23. Employees of this store are able to handle customer 4.40 0.75 complaints directly and immediately. P24. This store offers high quality merchandise. 4.40 0.94 P25. This store provides plenty of convenient parking for 4.60 0.67 customers. P26. This store has operating hours convenient to all their 4.34 0.83 customers. P27. This store accepts most major credit cards. 4.58 0.72 P28. This store offers its own credit card. 4.76 0.57 NOTE: The items are labeled P~to denote perceptions. (NI) = Item is not included in SERVQUAL. ACKNOWLEDGMENTS The first two authors contributed equally to this article. NOTES 1. The same procedure was used on the five SERVQUALdimensions (using the 22 original items) to provide a standard of comparison with our proposed scale. The model fit for SERVQUAL (Z2 = 140.75, df= 30, AGFI = 0.76, CFI = 0.92, RMSR = .04) was found to be not as good. Although the CFI does indicate that this model is acceptable, our scale has a much better fit. Further, our scale has greater content validity for the retail context given the extensive qualitative research and review of the retail literature carried out to develop the relevant dimensions, whereas SERVQUAL is not specifically geared to retailing. 2. Again, a comparison with the five SERVQUAL dimensions was conducted and revealed that the fit using SERVQUAL was acceptable (Z2 = 95.68, df= 30, AGFI = 0.80, CFI = 0.94, RMSR = .03), but not as good as the fit for our proposed scale. 3. We attempted to use structural equations to test predictive validity, but due to high multicollinearity among the five dimensions, we found only some of the dimensions to have a s!,~ificant effecton the dependent variables. Yet the variance explained (R) was quite high--.55 for inten- tion to recommend the store to others and .52 for intention to shop at the store in the future--thus suggesting high predictive validity. We con- ducted a test for multicollinearity using forward stepwise regression and confirmedthat it was very high. Therefore, we decided to use correlations as an unbiased indicator of predictive validity. REFERENCES Babakus, Emin and Gregory W. Boller. 1991. "Empirical Assessmentof SERVQUAL Scale." Journal of Business Research 24:253-268. Babakus, Emin and W. Glynn Mangold. 1989. "Adapting the SERVQUAL Scale to Health Care Environment: An Empirical Assess- ment." In Enhancing Knowledge Development inMarketing, editedby P. Bloom, 195. Chicago: American Marketing Association. Bagozzi, Richard P. and Todd E Heatherton. 1994. "A General Approach to Representing Multifaceted Personality Constructs: Application to State Self-Esteem." Structural Equation Modeling 1 (1): 35-67. Baker, Julie, Dhruv Grewal, and A. Parasuraman. 1994. "The Influence of Store Environmenton Quality Inferencesand Store Image." Journal of the Academy of Marketing Science 22 (Fall): 328-339. Berry, Leonard L. 1986. "Retail Businesses Are Service Businesses." Journal ofRetailing 62 (Spring): 3-6. Bowers, Michael and John E. Swan. 1992. "Generic Versus Service Specific Dimensions of Service Quality: Does SERVQUAL Cover Hospital Health Care?" Unpublished manuscript, Birmingham, AL. Brensinger, Ronald and Douglas M. Lambert. 1990. "Can the SERVQUAL Scale Be Generalized to Business-to-Business Ser- vices?" In Knowledge Development in Marketing, AMA Educators' Proceedings, edited by W. Bearden, R. Deshpande, T. J. Madden, P.R. Varadarajan, A. Parasuraman, V. S. Folkes, D. W. Stewart, and W. L. Wilkie, 289. Chicago: American Marketing Association. Bmwn, Tom J., Gilbert A. Churchill, and J. Paul Peter. 1993. "Impmving the Measurement ofService Quality."JournalofRetatTing69(Spring): 127-139. Carman, James M. 1990. "Consumer Perceptions of Service Quality: An Assessmentof the SERVQUAL Dimensions." Journal ofRetailing 66 (Spring): 33-55. Cronin, J. Joseph and Steven A. Taylor. 1992. "Measuring Service Qual- ity: A Reexamination and Extension."Journal ofMarketing 56 (July): 55-68. - - and .1994. "SERVPERF Versus SERVQUAL: Reconcil- ing Performance-Based and Perceptions-Minus-Expectations Mea- surement of Service Quality." Journal of Marketing 58 (January): 125-131. Finn, David W. and Charles W. Lamb. 1991. "An Evaluation of the SERVQUAL Scales in a Retailing Setting." In Advances in Consumer Research, edited by R. Holman and M. R. Solomon, 483-490. Provo, UT: Association for Consumer Research. Guiry, Michael, Wes Hutchinson, and Barton A. Weitz. 1992. "Consum- ers' Evaluation of Retail Store Service Quality and Its Influence on Store Choice." Working paper, University of Florida. Gutman, Jonathan and Scott D. Alden. 1985. "Adolescents' Cognitive Structures of Retail Stores and Fashion Consumption: A Means-End Chain Analysis of Quality." In Perceived Quality: How Consumers View Stores and Merchandise, edited by Jacob Jacoby and Jerry C. Olson, 99-114. Lexington, MA: Lexington Books. Hart, Christopher W. L., James L. Heskett, and W. Earl Sasser, Jr. 1990. "The Profitable Art of Service Recovery." Harvard Business Review 68 (July-August): 148-156. Hull, Jay C., Daniel A. Lehn, and Judith C. Tedlie. 1991. "A General Approach to Testing Multifaceted Personality Constructs." Journal of Personality and Social Psychology 61:932-945. Hummel, J. W. and Ronald Savitt. t988. "Integrated Customer Service and Retail Strategy." International Journal of Retailing 3 (2): 5-21.
  • 14. 16 JOURNALOF THE ACADEMYOF MARKETING SCIENCE WINTER 1996 Kelley, Scott W. and Mark A. Davis 91994 9"Antecedents to Customer Expectations for Service Recovery." Journal oftheAcademyofMar- ketingScience 22 (Winter): 52-61. Marsh, Herbert W. and Dennis Hocevar. 1985. "Application of Confir- matory Factor Analysis to the Study of Self-Concept: First and Higher Order Factor Models and Their Invariance Across Groups." Psycho- logicalBulletin97(3):562-582 9 Mazursky, David and Jacob Jacohy. 1985 9"Forming Impressions of Merchandise and Service Quality." In PerceivedQuality:How Con- sumers1,~ewStoresandMerchandise,edited by Jacob Jacoby andJerry C. Olson, 139-153. Lexington, MA: Lexington Books. Oliver, Richard. 1981 9"Measurement and Evaluation of Satisfaction Processes in Retail Settings." JournalofRetailing57 (Fall): 25-48. Parasuraman, A., Leonard L. Berry, and Valarie A. Zeithaml. 1991 9 "Refinement and Reassessment of the SERVQUAL Scale." Journalof Retailing67 (Winter): 420-450 9 Parasuraman, A., Valarie A. Zeithaml, and Leonard L. Berry. 1988. "SERVQUAL: A Multiple-Item Scale for Measuring Consumer Per- ceptions of ServiceQuality." JournalofRetailing64 (Spring): 12-40. , , and .1994a. "Reassessment of Expectations as a Comparison Standard inMeasuring Service Quality: Implications for Future Research." Journal ofMarketing58 (January): 111-124. , --, and --. 1994b. "Moving Forward in Service Quality Research: Measuring Different Customer-Expectation Levels, Comparing Alternative Scales, and Examining the Performance-Be- havioral Intentions Link." Workingpaper, Marketing Science Institute, Cambridge, MA. Pitt, Leyland L., Pierre Oosthuizen, and Michael H. Morris. 1992. "Ser- vice Quality in a High-Tech Industrial Market: An Application of SERVQUAL." In Proceedings of American Marketing Association Summer Educators' Conference,edited by R. Leone and V. Kumar, 46-53. Chicago: American Marketing Association. Reichheld, Frederick E and W. Earl Sasser, Jr 91990 9"Zero Defections: Quality Comes to Services." HarvardBusinessReview68 (5): 105-111. Rust, Roland T. and Richard L. Oliver. 1994. "ServiceQuality: Insights and Managerial Implications From the Frontier 9 In Service Quality: New Directionsin Theoryand Practice,edited by Roland T. Rust and Richard L 9Oliver, 1-19 9 London: Sage. Sellers, P. 1990. "What Customers Really Want." Fortune 121 (13): 58-68. Smith, T. 1989 9 "Nurturing a Customer Service Culture." RetailControl, October, 15-18. Spreng, Richard A. and A. K. Singh. 1993."An Empirical Assessment of the SERVQUAL Scale and the Relationship Between Service Quality and Satisfaction." In EnhancingKnowledgeDevelopmentinMarket- ing, edited by David W. Cravens and Peter Dickson, 1-6. Chicago: American Marketing Association. Teas, R. Kenneth. 1993. "Expectations, Performance Evaluation, and Consumers' Perceptions of Quality." Journal of Marketing 57 (October): 18-34. 91994 9"Expectations as a Comparison Standard in Measuring ServiceQuality: An Assessment of a Reassessment." JournalofMar- keting58 (January): 132-139 9 Westbrook, Robert A. 1981 9"Sources of Consumer Satisfaction With Retail Outlets." JournalofRetailing57 (Fall): 68-85. ABOUT THE AUTHORS Pratibha A.Dabholkar is assistant professor of marketing at the University of Tennessee, Knoxville. She received her Ph.D. from Georgia State University 9Her research interests include attitude and choice models, service quality and customer satisfaction issues, technology in service delivery, and business-to-business relationships 9 She has published articles in the Journal of the Academy of Marketing Science, Journal of Business Research, Journal of Consumer Research, Journal of Consumer Satisfac- tion, Dissatisfaction, and Complaining Behavior, Journal of Health Care Management, International Journal of Research in Marketing, and Psychology and Marketing, as well as in various conference proceedings. Dayle I. Thorpe is a doctoral candidate in marketing at the University of Tennessee, Knoxville. She also holds a B.S. and an M.S. from Florida State University and an M.B.A. from Mercer University 9Her research interests include services marketing, service quality, retailing, and manager-employee relationships. Her publications include articles in the Journal of Consumer Satisfaction, Dissatisfaction, and Complaining Behavior, The Service Industries Journal, and in various conference proceed- ings. Joseph O. Rentz is associate professor of marketing at the University of Tennessee, Knoxville. He received his Ph.D. from the University of Georgia. His research interests include cohort analysis, measurement issues, generalizability studies, and cus- tomer satisfaction. He has published articles in the Journal of the Academy of Marketing Science, Journal ofAdvertising, Journal ofMarketing, Journal ofMarketing Research, and the Journal of Personal Selling and Sales Management, as well as in several conference proceedings.