Download to read offline
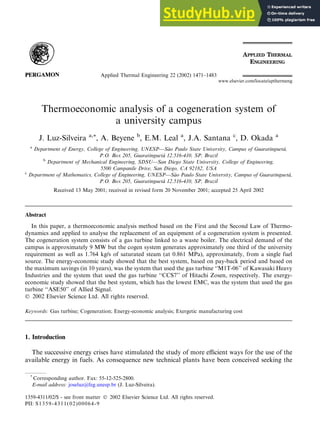
![cogeneration plant generates approximately one third of the campus’ electrical requirements as
well as 1.764 kg/s of saturated steam (at 0.861 MPa) from a single fuel source. Fig. 1 shows a
schematic of the current SDSU cogeneration plant.
3. Energy analysis
The following equations are based on the thermodynamic principals according to the indicated
procedures by Wu [1] and Taki et al. [2]. The equations are valid for any situation described in the
previous items.
T2 ¼ T1=gc
ð Þ P2=P1
½ ðK1Þ=K
n
1
o
þ T1T2 ð1Þ
T3 ¼ ðT4
½
f T1Þ þ T2ð1 gtÞ=ð1 gtÞg ð2Þ
Ef ¼ mCpðT3 T2Þ=gcc ¼ mgCPF ð3Þ
W ¼ mCp½ðT3 T4Þ ðT2 T1Þ ð4Þ
Hd ¼ mCpðT4 T1Þ ð5Þ
Ep ¼ ggW ð6Þ
gt ¼ gcc ðT3
½ T4 T2 þ T1Þ=ðT3 T2Þ ð7Þ
gel ¼ Ep=Ef ð8Þ
Ec ¼ mCpðT4 TeÞ ð9Þ
Fig. 1. Schematic of the current SDSU cogeneration plant.
1474 J. Luz-Silveira et al. / Applied Thermal Engineering 22 (2002) 1471–1483](https://image.slidesharecdn.com/acontributionforthermoeconomicmodellingamethodologyproposal-230804175506-3c070078/85/A-Contribution-For-Thermoeconomic-Modelling-A-Methodology-Proposal-4-320.jpg)
![ghr ¼ Ec=Ef ð10Þ
gG ¼ ðEp þ EcÞ=Ef ¼ gel þ ghr ð11Þ
To calculate the recovered heat flux in the form of steam Eq. (12) may be used.
Hs ¼ msðhs hwÞ ¼ wbEc ð12Þ
Table 1
Gas turbines systems selected [3]
Reference Manufacturer Models Ep (kW) gT (%) m (kg/s) T4 (°C)
1 Deutz MWM-Gastechnik RA 151 4907a
30.57a
19.69a
476.67a
4459b
29.87b
18.11b
490.97b
2 Ishikawajima–Harima
Heavy Industries
IM400
HI-FLECS
6450a
37.91a
18.51a
496.67a
5861b
37.04b
17.03b
511.57b
3 Solar Turbines Taurus 60S 5200a
30.33a
21.36a
480.56a
4725b
29.63b
19.66b
494.98b
4 Deutz MWM-Gastechnik RA 141 4214a
29.92a
17.74a
510.00a
3829b
29.23b
16.32b
525.30b
5 European Gas Turbines Typhoon 4.3 4340a
29.92a
17.74a
510.00a
3944b
29.23b
16.32b
525.30b
6 European Gas Turbines Typhoon 4.7 4694a
30.38a
18.78a
510.56a
4226b
29.69b
17.28b
525.88b
7 Solar Turbines Centaur 50S 4345a
29.23a
19.01a
501.11a
3949b
28.56b
17.85b
516.14b
8 Stewart Stevenson TG-Typhoon 4907a
30.62a
19.69a
513.89a
4459b
29.92b
18.11b
529.31b
9 Hitachi Zosen CCS7 5943a
38.54a
17.92a
524.44a
5,401b
37.66b
16.48b
540.17b
10 Kawasaki Heavy Industries M1T-03 2680a
20.30a
18.10a
540.00a
2435b
19.83b
16.65b
556.20b
11 Kawaski Heavy Industries M1T-06 2670a
20.98a
18.60a
525.00a
2426b
20.50b
17.11b
540.75b
12 Allison Engine Company 501-KB5 3926a
28.67a
15.60a
549.44a
3568b
28.02b
14.35b
565.92b
13 Dresser–Rand KG2-3E 1830a
16.19a
14.97a
550.00a
1663b
15.82b
13.77b
566.50b
14 Allied Signal ASE50 3815a
30.71a
14.29a
562.22a
3,467b
30.00b
13.15b
579.09b
15 Allison Engine Company 501-KB5S 4103a
29.49a
15.60a
579.44a
3729b
28.82b
14.36b
596.82b
16 Centrax Gas Turbine CX501-KB5 3832a
27.90a
15.69a
571.00a
3482b
27.26b
14.44b
588.13b
17 Hitachi Zosen GT10-5 4096a
28.81a
15.60a
576.67a
3722b
28.15b
14.36b
593.97b
18 Ishikawajima–Harima
Heavy Industries
IM400 4540a
29.77a
16.42a
577.22a
4126b
29.09b
15.11b
594.54b
a
ISO conditions.
b
Local conditions.
J. Luz-Silveira et al. / Applied Thermal Engineering 22 (2002) 1471–1483 1475](https://image.slidesharecdn.com/acontributionforthermoeconomicmodellingamethodologyproposal-230804175506-3c070078/85/A-Contribution-For-Thermoeconomic-Modelling-A-Methodology-Proposal-5-320.jpg)
![In order to select gas turbine systems commercially available, the following considerations were
made [4]:
(a) The gas turbine systems were selected in the ISO conditions (ambient temperature of 15 °C; sea
level; relative humidity of 60%) and for the performance correction on site were used the local
conditions (average ambient temperature of 25 °C; relative humidity of 80%);
(b) exhaust gases temperature in the atmosphere in steam production at 150 °C (‘‘pinch-point’’
method);
(c) for the calorific power of natural gas the value of 35,356 kJ/N m3
was used;
(d) for specific heat at constant pressure the value of 1.055 kJ/kg K was used;
(e) for the mechanical yield of the electrical generator was used the value of 95%;
(f) for the combustion chamber efficiency, the value of 97% was used;
(g) for the waste recuperation boiler was used the value of 70%.
Considering the necessary values for the mass flux of exhaust gases and turbine exit temper-
ature, the turbine systems selected are shown in Table 1. These equipments are selected in thermal
parity. Table 2 displays the results of energy analysis of the turbine systems selected.
4. Energy-economic analysis
The investment decisions are usually based on capital costs and on the payback period. The
costs of electricity and steam production can be determined from the Eqs. (13)–(16) [4]. These
Table 2
Results for energy analysis of the systems selected
Reference Manufacturer Models Ef (kW) Ec (kW) gel (%) ghr (%) gG (%)
1 Deutz MWM-Gastechnik RA 151 15,715.23 6555.481 28.38 29.46 57.83
2 Ishikawajima-Harima
Heavy Industries
IM400
HI-FLECS
16,655.77 6624.998 35.19 28.09 63.28
3 Solar Turbines Taurus 60S 16,784.89 7142.096 28.15 30.05 58.20
4 Deutz MWM-Gastechnik RA 141 13,788.41 6649.257 27.77 34.05 61.83
5 European Gas Turbines Typhoon 4.3 14,200.69 6649.257 27.77 33.07 60.84
6 European Gas Turbines Typhoon 4.7 15,126.00 7003.682 28.20 32.70 60.90
7 Solar Turbines Centaur 50S 14,554.90 6876.817 27.13 33.37 60.49
8 Stewart Stevenson TG-Typhoon 15,687.07 7376.283 28.43 33.21 61.63
9 Hitachi Zosen CCS7 15,095.89 7000.620 35.78 32.75 68.52
10 Kawasaki Heavy Industries M1T-03 12,926.03 7380.537 18.84 40.32 59.16
11 Kawaski Heavy Industries M1T-06 12,460.28 7246.198 19.47 41.07 60.54
12 Allison Engine Company 501-KB5 13,404.78 6651.547 26.61 35.04 61.66
13 Dresser-Rand KG2-3E 11,063.14 6427.239 15.03 41.03 56.06
14 Allied Signal ASE50 12,163.24 6376.801 28.50 37.02 65.53
15 Allison Engine Company 501-KB5S 13,620.64 7185.013 27.37 37.25 64.63
16 Centrax Gas Turbine CX501-KB5 13,447.76 7070.278 25.90 37.13 63.02
17 Hitachi Zosen GT10-5 13,917.06 7135.573 26.75 36.21 62.95
18 Ishikawajima–Harima
Heavy Industries
IM400 14,928.05 7471.048 27.64 35.34 62.98
1476 J. Luz-Silveira et al. / Applied Thermal Engineering 22 (2002) 1471–1483](https://image.slidesharecdn.com/acontributionforthermoeconomicmodellingamethodologyproposal-230804175506-3c070078/85/A-Contribution-For-Thermoeconomic-Modelling-A-Methodology-Proposal-6-320.jpg)
![equations consider all the pertinent aspects for the construction and operation of a cogeneration
plant, since they do not fasten important parameters such as the total plant capital cost including
capital taxes and insurance (IPL) or interest rate (r).
Yel ¼ ðIPL
½ IHRÞf =ðHEpÞ þ ðYf =EpÞðEf
Ec ðLos=2ÞÞ
þ UGT ð13Þ
Ys ¼ IRBf
½ =ðHHsÞ þ ðYf =HsÞðEc
½ þ ðLos=2ÞÞ þ URB ð14Þ
f ¼ qk
q
ð
1Þ
= qk
1
ð15Þ
q ¼ 1 þ r=100
ð Þ ð16Þ
In these equations (Eqs. (13)–(16)), the cost of electricity production (Yel) and steam production
(Ys) is a function of the plant capital cost including capital taxes and insurance (IPL), the operation
cost and maintenance cost. The annuity factor (f) associated to the plant capital cost is a function
of payback period (k) and the annual interest rate (r).
Eqs. (17) and (18) show the savings due to electric power production in case of electrical surplus
and in case of an electrical deficit, respectively. The savings due to steam production can be
determined by using the Eq. (19). The total annual saving is calculated using the Eq. (20) [4].
Sel ¼ ErHðTel YelÞ þ ðEp ErÞHðTSel YelÞ ð17Þ
Sel ¼ EpHðTel YelÞ ð18Þ
Ss ¼ HsHðPEs YsÞ ð19Þ
R ¼ Sel þ Ss ð20Þ
Table 3 shows the considerations for the energy-economic analysis applied to the cogeneration
plant. Table 4 displays the cogeneration products costs for the energy-economic analysis.
5. Exergy-economic analysis
The development of design techniques for an energy system with minimized costs is a necessity
in a world with finite natural resources and the increase of the energy demand. The presented
method combines the Second Law of Thermodynamics through the exergy concept, associated to
Table 3
Considerations for energy-economic analysis [4]
Annual interest rate (r) 8%
Fuel cost (Yf ) 0.0200 US$/kW h
Electricity tariff (Tel) 0.1000 US$/kW h
Sale tariff of the electricity surplus (TSel) 0.0800 US$/kW h
Pay-back period (k) 10 years
Equivalent utilization period (H) 7200 h/year
Electricity required (Er) 3000 kW
J. Luz-Silveira et al. / Applied Thermal Engineering 22 (2002) 1471–1483 1477](https://image.slidesharecdn.com/acontributionforthermoeconomicmodellingamethodologyproposal-230804175506-3c070078/85/A-Contribution-For-Thermoeconomic-Modelling-A-Methodology-Proposal-7-320.jpg)
![an economical approach of the thermal system. For the analysis of the cogeneration system in
question, the following steps were taken:
1. identification of the system functions of cogeneration as a whole and each unit individually;
2. evaluation of the exergy input and output stream value of each unit;
3. construction of the thermoeconomic function diagram;
4. selection of the fixed parameters and its values;
5. formulation of the exergetic increment function associated with the output and input of each
unit;
6. formulation of the exergetic manufacturing cost equation.
According to Moran and Sciubba [5] and Kotas [6], in the evaluation of the exergy input and
output stream value of each unit, the steam exergy is defined by:
ei ¼ ½ðhi hoÞ Toðsi soÞ ð21Þ
The exergy of the air and gas stream are defined by [4]:
ei ¼ CpGðTiÞ: Ti
½ To ln Ti=To
ð Þ þ RGTo ln Pi=Po
ð Þ ð22Þ
where: CpG
is Cpair
or Cpgas , for specific heat of air and gases, respectively.
Table 4
Results for energy-economic analysis (cogeneration products costs)
Manufacturer Models For k ¼ 10 years Based on pay
back period
Electricity Steam Savingsa
Yel (US$/kW h) Ys (US$/kW h) R (US$/year) k (year)
Deutz MWM-Gastechnik RA 151 0.0591 0.0496 2,972,185 1.10
Ishikawajima–Harima
Heavy Industries
IM400
HI-FLECS
0.0558 0.0483 3,381,534 1.21
Solar Turbines Taurus 60S 0.0588 0.0491 3,203,936 1.01
Deutz MWM-Gastechnik RA 141 0.0580 0.0464 3,040,208 1.00
European Gas Turbines Typhoon 4.3 0.0583 0.0471 3,027,733 1.02
European Gas Turbines Typhoon 4.7 0.0578 0.0472 3,194,990 1.02
Solar Turbines Centaur 50S 0.0586 0.0470 3,087,812 1.08
Stewart Stevenson TG-Typhoon 0.0573 0.0467 3,370,287 0.99
Hitachi Zosen CCS7 0.0534 0.0448 3,629,887 1.06
Kawasaki Heavy Industries M1T-03 0.0659 0.0453 2,860,070 0.93
Kawaski Heavy Industries M1T-06 0.0647 0.0448 2,857,643 0.92
Allison Engine Company 501-KB5 0.0587 0.0462 2,988,714 0.99
Dresser-Rand KG2-3E 0.0744 0.0459 2,256,037 0.97
Allied Signal ASE50 0.0567 0.0445 2,993,921 0.97
Allison Engine Company 501-KB5S 0.0568 0.0447 3,280,092 0.94
Centrax Gas Turbine CX501-KB5 0.0583 0.0451 3,148,199 0.95
Hitachi Zosen GT10-5 0.0578 0.0454 3,211,048 0.96
Ishikawajima–Harima
Heavy Industries
IM400 0.0571 0.0456 3,391,485 0.96
a
Maximum savings.
1478 J. Luz-Silveira et al. / Applied Thermal Engineering 22 (2002) 1471–1483](https://image.slidesharecdn.com/acontributionforthermoeconomicmodellingamethodologyproposal-230804175506-3c070078/85/A-Contribution-For-Thermoeconomic-Modelling-A-Methodology-Proposal-8-320.jpg)
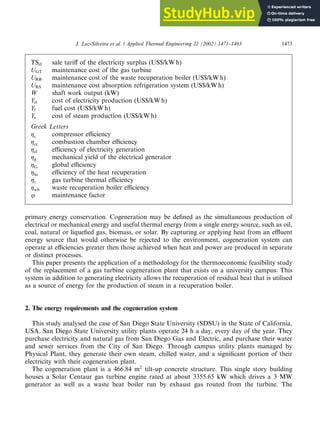
![5.1. Thermoeconomic functional diagram
The functional diagram of the cogeneration system, which allows the intended analysis, is
composed of geometric figures representing the units and a network of lines representing the
unitary function distributions in terms of exergy. These units correspond to the real plant’s
components. The notation Yi;j (jth input of ith unit) and Yik (kth output of ith unit) is used by
Frangopoulos and Evans [7] and Tuna and Silveira [8].
Fig. 2 shows the functional diagram of the system presented in Fig. 1. It is important, to follow
the development of the proposed method of this work, notice that each unit (or component) will
receive an identification number. It is also essential to understand the transposition of Fig. 1
(physical diagram) to Fig. 2 (functional diagram) that considered fluxes refers to the exergetic
increment and not to the absolute value of this thermodynamic property.
The frontier functional line is the one that takes apart the supplies and the products of the
system from the environment and leaves the process outside.
To evaluate the exergetic functions associated to the functional thermoeconomic diagrams and
in order to simplify the calculation procedures, the loss in the pipes was neglected.
Fig. 2. Cogeneration system functional diagram.
J. Luz-Silveira et al. / Applied Thermal Engineering 22 (2002) 1471–1483 1479](https://image.slidesharecdn.com/acontributionforthermoeconomicmodellingamethodologyproposal-230804175506-3c070078/85/A-Contribution-For-Thermoeconomic-Modelling-A-Methodology-Proposal-9-320.jpg)
![5.2. Exergetic increment function
From the physical diagram (Fig. 1) and from the thermodynamic property values of input and
output of each component, it is possible to obtain the exergetic increment functions associated
with the functional thermoeconomic diagram (Fig. 2). With this procedure, these expressions for
these functions are [8]:
Unit A: Compressor
YA;1 ¼ Exair
ð23Þ
YA;2 ¼ Wcomp ð24Þ
YA1 ¼ mairðe2 e1Þ ð25Þ
Unit B: Combustion chamber
YB;1 ¼ Exfuel
ð26Þ
YB;2 ¼ YA1 ð27Þ
YB1 ¼ Exgases ¼ mgasese3 ð28Þ
Unit C: Gas turbine
YC;1 ¼ YB1 ð29Þ
YC;3 ¼ YA;2 ð30Þ
YC1 ¼ Ep ð31Þ
YC2 ¼ mgasese4 ð32Þ
Unit D: Waste boiler
YD;1 ¼ YC2 ð33Þ
YD;2 ¼ mwf e9 ð34Þ
YD1 ¼ mwf e7
ð e9Þ ð35Þ
YD2 ¼ mgases e5
ð e4Þ ð36Þ
Unit F: Pump
YF1 ¼ YD;2 ð37Þ
YF;1 ¼ mwf e7
ð e8Þ ð38Þ
YF;2 ¼ Wpump ð39Þ
1480 J. Luz-Silveira et al. / Applied Thermal Engineering 22 (2002) 1471–1483](https://image.slidesharecdn.com/acontributionforthermoeconomicmodellingamethodologyproposal-230804175506-3c070078/85/A-Contribution-For-Thermoeconomic-Modelling-A-Methodology-Proposal-10-320.jpg)
![5.3. Thermoeconomic cost equations
Fig. 3 shows the costs diagram. The exergetic manufacturing cost (EMC) is defined by the
produced electricity cost plus the consumed steam cost plus the electricity cost bought from the
concessionaire in deficit situation (Eq. (40)) or minus the earnings received from the sell of
the electricity exceeding (Eq. (41)). Eqs. (42) and (43) show the expressions of specific costs Yel and
Ys, respectively [8].
EMC ¼ EpYel þ EcYs þ ðEr EpÞTel ð40Þ
EMC ¼ EpYel þ EcYs ðEp ErÞTSel ð41Þ
Yel ¼
ðIPL IWBÞf u
HYC1
þ Yf
ðYB;1 YD2Þ
YC1
ð42Þ
Ys ¼
IWBf u
HYD2
þ Yf
YB1
YD2
ð43Þ
Fig. 3. The cost diagram.
Table 5
Results for exergy-economic optimization.
Reference Manufacturer Models Electricity (Yel)
(US$/kW h)
Steam (Ys)
(US$/kW h)
EMC
(US$/year)
1 Deutz MWM-Gastechnik RA 151 0.1542 0.2103 6,483,294
2 Ishikawajima–Harima
Heavy Industries
IM400
HI-FLECS
0.1358 0.1961 6,324,524
3 Solar Turbines Taurus 60S 0.1554 0.2079 6,852,354
4 Deutz MWM-Gastechnik RA 141 0.1693 0.1971 6,458,717
5 European Gas Turbines Typhoon 4.3 0.1661 0.1997 6,469,866
6 European Gas Turbines Typhoon 4.7 0.1626 0.1997 6,679,015
7 Solar Turbines Centaur 50S 0.1687 0.2000 6,625,946
8 Stewart Stevenson TG-Typhoon 0.1629 0.1978 6,909,216
9 Hitachi Zosen CCS7 0.1436 0.1820 6,410,176
10 Kawasaki Heavy Industries M1T-03 0.2354 0.1950 7,007,572
11 Kawaski Heavy Industries M1T-06 0.2340 0.1927 6,902,036
12 Allison Engine Company 501-KB5 0.1765 0.1963 6,466,572
13 Dresser-Rand KG2-3E 0.2775 0.1980 6,472,360
14 Allied Signal ASE50 0.1755 0.1880 6,191,836
15 Allison Engine Company 501-KB5S 0.1781 0.1898 6,724,540
16 Centrax Gas Turbine CX501-KB5 0.1842 0.1923 6,695,837
17 Hitachi Zosen GT10-5 0.1775 0.1931 6,724,447
18 Ishikawajima–Harima
Heavy Industries
IM400 0.1710 0.1938 6,936,902
J. Luz-Silveira et al. / Applied Thermal Engineering 22 (2002) 1471–1483 1481](https://image.slidesharecdn.com/acontributionforthermoeconomicmodellingamethodologyproposal-230804175506-3c070078/85/A-Contribution-For-Thermoeconomic-Modelling-A-Methodology-Proposal-11-320.jpg)
![Table 5 shows the specific costs associated to the cogeneration products and the value of the
exergetic manufacturing cost. In Table 5, the best system, which has the lowest EMC, is the
system that used the gas turbine ‘‘ASE50’’ of Allied Signal followed by ‘‘IM400 HI-FLECS’’ of
Ishikawajima–Harima Heavy Industries. This result is associated with the irreversibility level of
each system and other parameters as the electricity sell price and the plant investment.
6. Conclusions
The feasibility of the replacement of the gas turbine system in a gas turbine cogeneration system
existing on a university campus has been shown. The system design and operational parameters
are important to evaluate cogeneration systems. The energy-economic study shown that the best
system, based on pay-back period, was the system that used the gas turbine ‘‘M1T-06’’ of Ka-
waski Heavy Industries followed by ‘‘M1T-03’’ of Kawasaki Heavy Industries. The best system,
based on the maximum savings (in 10 years), was the system that used the gas turbine ‘‘CCS7’’ of
Hitachi Zosen followed by ‘‘IM400’’ of Ishikawajima–Harima Heavy Industries.
The development of the EMC method, overcoming the initial complexities, is revealed a
powerful tool of optimization in cogeneration context. The advantage of this method is its lowest
computational time, because it is a direct algebraic method, easy to handle and to change its
parameters to others. In this paper, the exergy-economic study shown that the best system, which
has the lowest EMC, was that that used the gas turbine ‘‘ASE50’’ of Allied Signal followed by
‘‘IM400 HI-FLECS’’ of Ishikawajima–Harima Heavy Industries.
Acknowledgement
The authors wish to express their thanks to support of FAPESP (Fundac
ß~
a
ao de Amparo a
Pesquisa do Estado de S~
a
ao Paulo––Brazil, Process number 99/08851-0).
References
[1] C. Wu, Power optimization of an endoreversible Brayton gas heat engine, Energy Conversion Management 31
(1991) 561–565.
[2] Y. Taki, R.F. Babus’Haq, R.L. Elder, S.D. Propert, Design and analysis of a compact gas turbine for CHP system,
Heat Recovery System and CHP 11 (1991) 149–160.
[3] V. Biasi, For project planning, design and construction––gas turbine world, in: The 1997–98 Handbook, Pequot
Publishing, Washington, 1999.
[4] J.L. Silveira, A.C.S. Walter, C.A. Luengo, A case study of a compact cogeneration system for a hospital––techno-
economic analysis, Proceedings of third Asian-Pacific International Symposium on Combustion and Energy
Utilization, vol. 2, 1992, pp. 756–762.
[5] M. Moran, E. Sciubba, Exergy analysis: principles and practice, Journal of Engineering for Gas Turbines and Power
116 (1994) 285–290.
[6] T.J. Kotas, The Exergy Method of Thermal Plant Analysis, Anchor Brendon Ltd., Great Britain, 1985.
1482 J. Luz-Silveira et al. / Applied Thermal Engineering 22 (2002) 1471–1483](https://image.slidesharecdn.com/acontributionforthermoeconomicmodellingamethodologyproposal-230804175506-3c070078/85/A-Contribution-For-Thermoeconomic-Modelling-A-Methodology-Proposal-12-320.jpg)
![[7] C.A. Frangopoulos, R.B. Evans, Thermoeconomic isolation and the optimization of thermal systems components,
in: A. Bejan, R.L. Reid (Eds.), Second Law Aspects of Thermal Design, American Society of Mechanical Engineers,
New York, 1984.
[8] Heat and power systems, Proceedings of fifth ASME/JSME Thermal Engineering Joint Conference, CD-ROM,
1999, pp. 1–7.
J. Luz-Silveira et al. / Applied Thermal Engineering 22 (2002) 1471–1483 1483
All in-text references underlined in blue are linked to publications on ResearchGate, letting you access and read them immediately.](https://image.slidesharecdn.com/acontributionforthermoeconomicmodellingamethodologyproposal-230804175506-3c070078/85/A-Contribution-For-Thermoeconomic-Modelling-A-Methodology-Proposal-13-320.jpg)

This document presents a thermoeconomic analysis of replacing equipment in a cogeneration system at a university campus. The existing cogeneration system uses a gas turbine to generate approximately one-third of the campus' electricity needs and produces steam for use on campus. The analysis evaluates different gas turbine models to determine the best replacement option based on factors like payback period, annual savings, and exergetic manufacturing cost. Equations related to the thermodynamics and economics of the cogeneration system are provided.