This document discusses key concepts in managerial accounting related to cost estimation and classification. It covers:
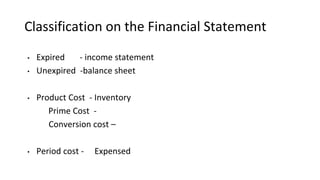
1) Direct and indirect costs and how they are classified on financial statements as expired or unexpired costs.
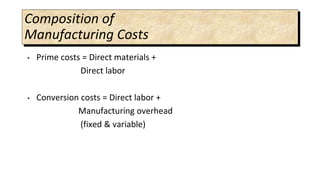
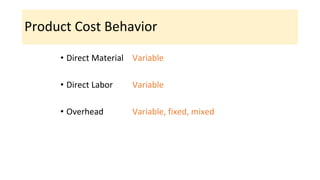
2) The composition of manufacturing costs including prime costs, conversion costs, and period costs.
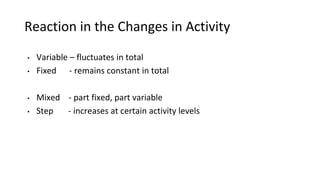
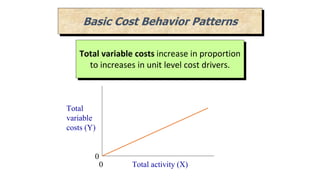
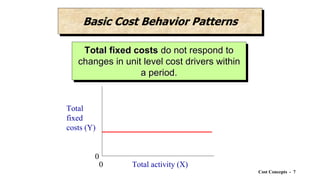
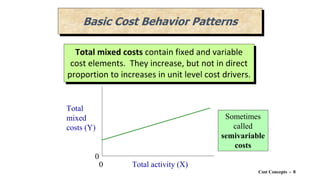
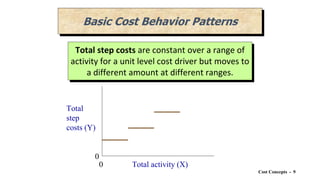
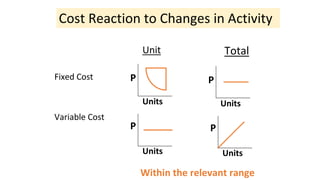
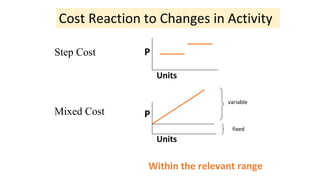
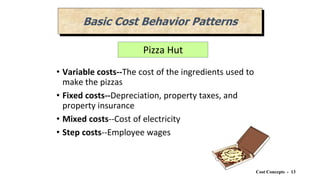
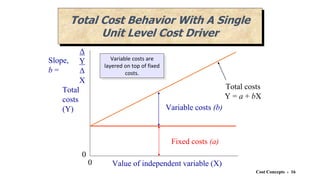
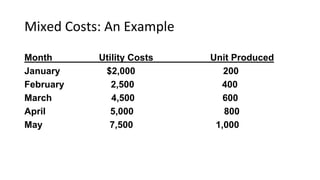
3) Basic cost behavior patterns including variable, fixed, mixed, and step costs and how they react to changes in activity.
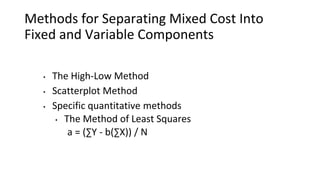
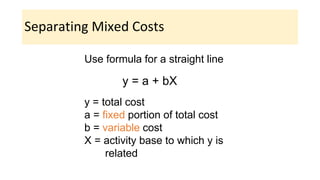
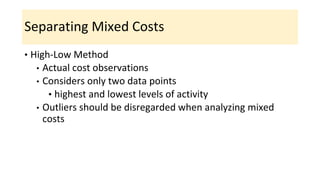
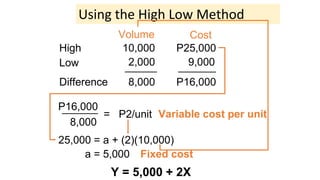
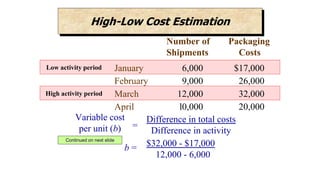
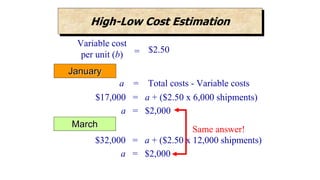
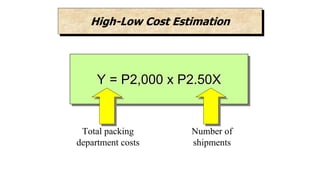
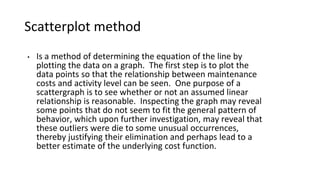
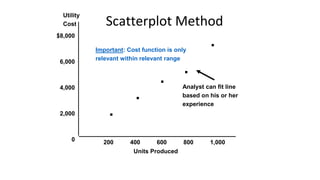
4) Methods for separating mixed costs into fixed and variable components such as the high-low method and scatterplot method.
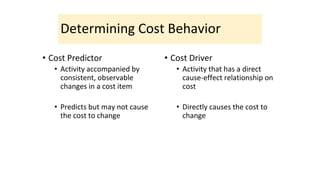
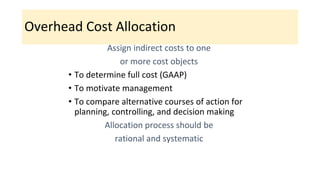
5) Key terms like cost predictors, cost drivers, and overhead cost allocation.