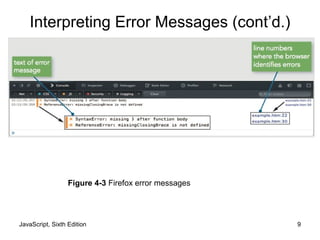
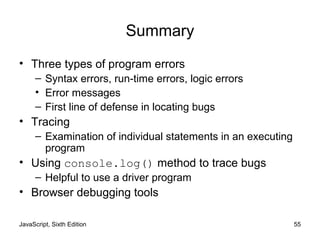
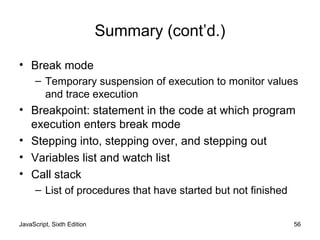
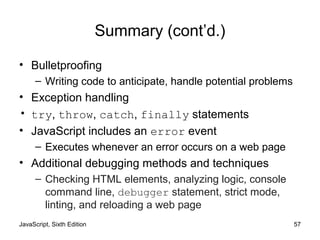
JavaScript, Sixth Edition
Chapter 4
Debugging and Error Handling
JavaScript, Sixth Edition
JavaScript, Sixth Edition 2
Objectives
When you complete this chapter, you will be able to:
• Recognize error types
• Trace errors with dialog boxes and the console
• Use comments to locate bugs
• Trace errors with debugging tools
• Write code to respond to exceptions and errors
JavaScript, Sixth Edition 3
Introduction to Debugging
• Programming languages have syntax (rules)
• Logic
– Order in which various program parts run (execute)
• Bug
– Any program error
• Causes program to function incorrectly due to
incorrect syntax or flaws in logic
• Debugging
– Process of tracing and resolving errors in a program
JavaScript, Sixth Edition 4
Understanding Syntax Errors
• Syntax errors
– Occur when interpreter fails to recognize code
– Causes
• Incorrect use of JavaScript code
• References to non-existent objects, methods, variables
JavaScript, Sixth Edition 5
Handling Run-Time Errors
• Run-time errors
– Occur when interpreter encounters a problem while
program executing
• Not necessarily JavaScript language errors
– Occur when interpreter encounters code it cannot
execute
– Run-time error can be caused by a syntax error
JavaScript, Sixth Edition 6
Identifying Logic Errors
• Logic errors
– Flaw in a program’s design
• Prevents program from running as anticipated
– “Logic” reference
• Execution of program statements and procedures in the
correct order to produce the desired results
– Example: multiplying instead of dividing
var divisionResult = 10 * 2;
document.write("Ten divided by two is equal to "↵
+ divisionResult);
JavaScript, Sixth Edition 7
Identifying Logic Errors (cont’d.)
– Example: infinite loop
for (var count = 10; count >= 0; count) {
document.write("We have liftoff in " + count);
}
– Example: infinite loop corrected
for (var count = 10; count >= 0; count--) {
document.write("We have liftoff in " + count);
}
JavaScript, Sixth Edition 8
Interpreting Error Messages
• First line of defense in locating bugs
– Browser console displays
• Line number where error occurred
• Error description
• Run-time errors
– Error messages generated by a web browser
• Can be caused by syntax errors but not by logic errors
– Example:
function missingClosingBrace() {
var message = "This function is missing a closing brace.";
window.alert(message);
JavaScript, Sixth Edition 9
Figure 4-3 Firefox error messages
Interpreting Error Messages (cont’d.)
JavaScript, Sixth Edition 10
Interpreting Error Messages (cont’d.)
• Error message
– Displays error’s general location in a program
• Not an exact indicator
• Browsers do not strictly enforce JavaScript syntax
• Mitigating bugs in JavaScript programs
– Always use good syntax
– Thoroughly test with every browser type, version
• Test browser if used by more than one percent of the
market
JavaScript, Sixth Edition 11
Using Basic Debugging Techniques
• Syntax errors can be difficult to pinpoint
• A few common techniques are helpful in tracking
down bugs
JavaScript, Sixth Edition 12
Tracing Errors with the
window.alert() Method
• Tracing
– Examining statements in an executing program
• window.alert() method
– A useful way to trace JavaScript code
– Place at different points within program
• Used to display variable or array contents or value
returned from a function
• Use multiple window.alert() methods
– Check values as code executes
• Example: function not returning correct result of 485
– Returning 5169107
JavaScript, Sixth Edition 13
function calculatePay() {
var payRate = 15; numHours = 40;
var grossPay = payRate * numHours;
window.alert(grossPay);
var federalTaxes = grossPay * .06794;
var stateTaxes = grossPay * .0476;
var socialSecurity = grossPay * .062;
var medicare = grossPay * .0145;
var netPay = grossPay - federalTaxes;
netPay *= stateTaxes;
netPay *= socialSecurity;
netPay *= medicare;
return netPay;
}
Tracing Errors with the
window.alert() Method (cont’d.)
JavaScript, Sixth Edition 14
Tracing Errors with the
window.alert() Method (cont’d.)
• Drawback
– Must close each dialog box for code to continue
executing
• Use selectively at key points
• Place debugging code at different indent level to
distinguish from program code
JavaScript, Sixth Edition 15
Tracing Errors with the
console.log() Method
• Trace a bug by analyzing a list of values
• Logging
– writing values directly to the console using the
console.log() method
– syntax: console.log(value);
– can log string literal, variable value, or combination
• Example
– calculatePay() function
JavaScript, Sixth Edition 16
Tracing Errors with the
console.log() Method (cont’d.)
function calculatePay() {
var payRate = 15; numHours = 40;
var grossPay = payRate * numHours;
console.log("grossPay is " + grossPay);
var federalTaxes = grossPay * .06794;
var stateTaxes = grossPay * .0476;
var socialSecurity = grossPay * .062;
var medicare = grossPay * .0145;
var netPay = grossPay - federalTaxes;
console.log("grossPay minus federalTaxes is " + netPay);
netPay *= stateTaxes;
console.log("netPay minus stateTaxes is " + netPay);
netPay *= socialSecurity;
console.log("netPay minus socialSecurity is " + netPay);
netPay *= medicare;
console.log("netPay minus medicare is " + netPay);
return netPay;
}
calculatePay();
JavaScript, Sixth Edition 17
Tracing Errors with the
console.log() Method (cont’d.)
Figure 4-11 Contents of the console after executing the calculatePay() function
JavaScript, Sixth Edition 18
Tracing Errors with the
console.log() Method (cont’d.)
• Driver program
– simplified, temporary program
– contains only the code you are testing
JavaScript, Sixth Edition 19
Using Comments to Locate Bugs
• Another method of locating bugs
– “Comment out” problematic lines
• Helps isolate statement causing the error
• When error message first received
– Start by commenting out only the statement specified
by the line number in the error message
– Continue commenting lines until error eliminated
JavaScript, Sixth Edition 20
Combining Debugging Techniques
• Combine debugging techniques
– Aid in search for errors
• Example:
– Use comments combined with an alert box or log
message to trace errors in the calculatePay()
function
JavaScript, Sixth Edition 21
function calculatePay() {
var payRate = 15;
var numHours = 40;
var grossPay = payRate * numHours;
window.alert(grossPay);
// var federalTaxes = grossPay * .06794;
// var stateTaxes = grossPay * .0476;
// var socialSecurity = grossPay * .062;
// var medicare = grossPay * .0145;
// var netPay = grossPay – federalTaxes;
// netPay *= stateTaxes;
// netPay *= socialSecurity;
// netPay *= medicare;
// return Math.round(netPay);
Combining Debugging Techniques
(cont’d.)
JavaScript, Sixth Edition 22
Dependencies
• Relationship in which one statement depends on
another statement executing successfully
• Can make debugging more challenging
• Important to retest program after fixing a bug to
ensure other parts aren't affected by change
JavaScript, Sixth Edition 23
Tracing Errors with Debugging Tools
• Available in current versions of all modern browsers
– Internet Explorer (IE)
– Chrome
– Firefox
• Accessible through same panel that opens when
you use the console
JavaScript, Sixth Edition 24
Tracing Errors with Debugging Tools
(cont’d.)
• Examining code manually
– Usually first step taken with a logic error
– Works fine with smaller programs
• Debugging tools
– Help trace each line of code
– More efficient method of finding and resolving logic
errors
JavaScript, Sixth Edition 25
Understanding the IE, Firefox, and
Chrome Debugger Windows
• Using Debugger Windows
– Open a document to debug in a browser
– Use keyboard shortcut or menu to open debugger
Table 4-1: Steps to open debuggers in IE, Firefox, and Chrome
JavaScript, Sixth Edition 26
Understanding the IE, Firefox, and
Chrome Debugger Windows (cont’d.)
• Debugger window
– Usually separate pane attached to bottom of browser
window
– Can also detach pane into separate window
JavaScript, Sixth Edition 27
Understanding the IE, Firefox, and
Chrome Debugger Windows (cont’d.)
• Internet Explorer
– Shows HTML code by default
– Click View sources to select a different file
JavaScript, Sixth Edition 28
Understanding the IE, Firefox, and
Chrome Debugger Windows (cont’d.)
• Firefox
– Lists JavaScript files alphabetically
– Click a filename to see its contents
JavaScript, Sixth Edition 29
Understanding the IE, Firefox, and
Chrome Debugger Windows (cont’d.)
• Chrome
– Displays no files by default
– press Ctrl + O (Win) or command + O (Mac) to select
from list of associated files
JavaScript, Sixth Edition 30
Setting Breakpoints
• Break mode
– Temporary suspension of program execution
– Used to monitor values and trace program execution
• Breakpoint
– Statement where execution enters break mode
• When program paused at a breakpoint
– Use debug tools to trace program execution
JavaScript, Sixth Edition 31
Setting Breakpoints (cont’d.)
• To set a breakpoint
– Click the line number of the statement where
execution should stop
• Resume button (Firefox/Chrome), Continue button
(IE)
– Executes rest of the program normally or until another
breakpoint encountered
JavaScript, Sixth Edition 32
Figure 4-20 tuba.js execution stopped at the line 63 breakpoint
Setting Breakpoints (cont’d.)
JavaScript, Sixth Edition 33
Clearing Breakpoints
• To clear a breakpoint
– Click the line number
• To clear all breakpoints
– Right-click any breakpoint
– Click "Remove all breakpoints" or "Delete all"
JavaScript, Sixth Edition 34
Stepping Through Your Scripts
• Stepping into
– Executes an individual line of code
• Pauses until instructed to continue
– Debugger stops at each line within every function
• Stepping over
– Allows skipping of function calls
– Program still executes function stepped over
• Stepping out
– Executes all remaining code in the current function
– Debugger stops at next statement in the calling
function
JavaScript, Sixth Edition 35
Tracing Variables and Expressions
• Variables list
– Displays all local variables within the currently
executing function
– Shows how different values in the currently executing
function affect program execution
• Watch list
– Monitors variables and expressions in break mode
JavaScript, Sixth Edition 36
Tracing Variables and Expressions
(cont’d.)
– To access watch list
• IE
– Displayed by default on right side of pane
– In break mode, local and global variables displayed
• Firefox
– Click Expand Panes button
– Shows watch and variables list on right side of pane
• Chrome
– Displayed by default on right side of pane
JavaScript, Sixth Edition 37
Tracing Variables and Expressions
(cont’d.)
– To add an expression to the watch list
• Locate an instance of the expression in the program
• Select it and copy it to the Clipboard
• Click "Click to add" (IE) or "Add watch expression
(Firefox or Chrome)
• Paste expression from Clipboard
• Press Enter
JavaScript, Sixth Edition 38
Examining the Call Stack
• Call stack
– Ordered lists of which procedures (functions,
methods, event handlers) have been called but
haven't finished executing
• Each time a program calls a procedure:
– Procedure added to top of the call stack
JavaScript, Sixth Edition 39
Examining the Call Stack
• IE and Chrome
– Call stack list displayed to right of code
• Firefox
– Call stack list displayed above code
JavaScript, Sixth Edition 40
Handling Exceptions and Errors
• Bulletproofing
– Writing code to anticipate and handle potential
problems
• One bulletproofing technique
– Validate submitted form data
• Exception handling
– Allows programs to handle errors as they occur in
program execution
• Exception
– Error occurring in a program
JavaScript, Sixth Edition 41
Throwing Exceptions
• Execute code containing an exception in a try
statement
• throw statement
– Specifies an error message in case an error that
occurs within a try block
try {
var lastName = document.getElementById("lName").value;
if (lastName === "") {
throw "Please enter your last name.";
}
}
JavaScript, Sixth Edition 42
Catching Exceptions
• Use a catch statement
– Handles, or “catches” the error
• Syntax:
catch(error) {
statements;
}
• Example:
catch(lNameError) {
window.alert(lNameError);
return false;
}
JavaScript, Sixth Edition 43
Executing Final Exception Handling
Tasks
• finally statement
– Executes regardless of whether its associated try
block throws an exception
– Used to perform some type of cleanup
• Or any necessary tasks after code evaluated with a
try statement
JavaScript, Sixth Edition 44
Implementing Custom Error Handling
• Primary purpose of exception handling
– Prevent users from seeing errors occurring in
programs
– Provide graceful way to handle errors
• Reason for using exception handling with JavaScript
– Evaluate user input
• Programmers may write their own error-handling
code
– Can write user-friendly messages
– Provides greater control over any errors
JavaScript, Sixth Edition 45
Implementing Custom Error Handling
(cont’d.)
• Catching errors with the error event
– Executes whenever error occurs on a Web page
– Name of function to handle JavaScript errors
• Assigned as event listener for error event
– Preventing the Web browser from executing its own
error handling functionality
• Return return a value of true from the error event
handler function
JavaScript, Sixth Edition 46
Implementing Custom Error Handling
(cont’d.)
• Writing custom error-handling functions
– JavaScript interpreter automatically passes three
arguments to the custom error handling function
• Error message, URL, line number
– Use these values in custom error handling
function
• By adding parameters to the function definition
– Use parameters in the function
• Show a user the location of any JavaScript errors
that may occur
JavaScript, Sixth Edition 47
Additional Debugging Techniques
• Includes
– Checking HTML elements
– Analyzing logic
– Testing statements with console command line
– Using the debugger statement
– Executing code in strict mode
– Linting
– Reloading a Web page
JavaScript, Sixth Edition 48
Checking HTML Elements
• If a bug cannot be located using methods described
in this chapter:
– Perform a line-by-line analysis of the HTML code
– Ensure all necessary opening and closing tags
included
• Use code editor specialized for web development
– Highlights syntax errors as you type
• Use the W3C Markup Validation Service to validate
a Web page
JavaScript, Sixth Edition 49
Analyzing Logic
• Some JavaScript code errors stem from logic
problems
– Can be difficult to spot using tracing techniques
• Analyze each statement on a case-by-case basis
JavaScript, Sixth Edition 50
Testing Statements with the Console
Command Line
• Console command line
– Testing and executing JavaScript statements
• Without HTML document or JavaScript source file
– Useful if trying to construct the correct syntax for a
mathematical expression
• Enter JavaScript statement at command line in web
browser’s console
• Including multiple statements at the command line
– Separate statements with a semicolon
JavaScript, Sixth Edition 51
Using the debugger statement
• When you include the debugger statement in your
code
– web browser stops executing JavaScript code when it
reaches the debugger statement
– equivalent of a breakpoint that's part of your
JavaScript code
JavaScript, Sixth Edition 52
Using Strict Mode
• Strict mode
– Removes some features from JavaScript
– Requires more stringent syntax for other features
• Example: must always use var to declare variables
• Many removed or altered features in strict mode are
known to cause hard to find bugs
• Include statement "use strict";
– Including at start of script section requests strict mode
for all code in that section
– Including at start of code block in function requests
strict mode just for that function
JavaScript, Sixth Edition 53
Linting
• Running code through a program that flags some
common issues that may affect code quality
• jslint is a commonly used linting program
• Similar result to using strict mode, but generates a
report containing line numbers
JavaScript, Sixth Edition 54
Reloading a Web Page
• Usually click the browser Reload or Refresh button
• Web browser cannot always completely clear its
memory
– Remnants of an old bug may remain
– Force web page reload
• Hold Shift key and click the browser’s Reload or
Refresh button
• May need to close browser window completely
• May need to delete frequently visited web pages
JavaScript, Sixth Edition 55
Summary
• Three types of program errors
– Syntax errors, run-time errors, logic errors
• Error messages
– First line of defense in locating bugs
• Tracing
– Examination of individual statements in an executing
program
• Using console.log() method to trace bugs
– Helpful to use a driver program
• Browser debugging tools
JavaScript, Sixth Edition 56
Summary (cont’d.)
• Break mode
– Temporary suspension of execution to monitor values
and trace execution
• Breakpoint: statement in the code at which program
execution enters break mode
• Stepping into, stepping over, and stepping out
• Variables list and watch list
• Call stack
– List of procedures that have started but not finished
JavaScript, Sixth Edition 57
Summary (cont’d.)
• Bulletproofing
– Writing code to anticipate, handle potential problems
• Exception handling
• try, throw, catch, finally statements
• JavaScript includes an error event
– Executes whenever an error occurs on a web page
• Additional debugging methods and techniques
– Checking HTML elements, analyzing logic, console
command line, debugger statement, strict mode,
linting, and reloading a web page

9781305078444 ppt ch04

  • 1.
    JavaScript, Sixth Edition Chapter4 Debugging and Error Handling JavaScript, Sixth Edition
  • 2.
    JavaScript, Sixth Edition2 Objectives When you complete this chapter, you will be able to: • Recognize error types • Trace errors with dialog boxes and the console • Use comments to locate bugs • Trace errors with debugging tools • Write code to respond to exceptions and errors
  • 3.
    JavaScript, Sixth Edition3 Introduction to Debugging • Programming languages have syntax (rules) • Logic – Order in which various program parts run (execute) • Bug – Any program error • Causes program to function incorrectly due to incorrect syntax or flaws in logic • Debugging – Process of tracing and resolving errors in a program
  • 4.
    JavaScript, Sixth Edition4 Understanding Syntax Errors • Syntax errors – Occur when interpreter fails to recognize code – Causes • Incorrect use of JavaScript code • References to non-existent objects, methods, variables
  • 5.
    JavaScript, Sixth Edition5 Handling Run-Time Errors • Run-time errors – Occur when interpreter encounters a problem while program executing • Not necessarily JavaScript language errors – Occur when interpreter encounters code it cannot execute – Run-time error can be caused by a syntax error
  • 6.
    JavaScript, Sixth Edition6 Identifying Logic Errors • Logic errors – Flaw in a program’s design • Prevents program from running as anticipated – “Logic” reference • Execution of program statements and procedures in the correct order to produce the desired results – Example: multiplying instead of dividing var divisionResult = 10 * 2; document.write("Ten divided by two is equal to "↵ + divisionResult);
  • 7.
    JavaScript, Sixth Edition7 Identifying Logic Errors (cont’d.) – Example: infinite loop for (var count = 10; count >= 0; count) { document.write("We have liftoff in " + count); } – Example: infinite loop corrected for (var count = 10; count >= 0; count--) { document.write("We have liftoff in " + count); }
  • 8.
    JavaScript, Sixth Edition8 Interpreting Error Messages • First line of defense in locating bugs – Browser console displays • Line number where error occurred • Error description • Run-time errors – Error messages generated by a web browser • Can be caused by syntax errors but not by logic errors – Example: function missingClosingBrace() { var message = "This function is missing a closing brace."; window.alert(message);
  • 9.
    JavaScript, Sixth Edition9 Figure 4-3 Firefox error messages Interpreting Error Messages (cont’d.)
  • 10.
    JavaScript, Sixth Edition10 Interpreting Error Messages (cont’d.) • Error message – Displays error’s general location in a program • Not an exact indicator • Browsers do not strictly enforce JavaScript syntax • Mitigating bugs in JavaScript programs – Always use good syntax – Thoroughly test with every browser type, version • Test browser if used by more than one percent of the market
  • 11.
    JavaScript, Sixth Edition11 Using Basic Debugging Techniques • Syntax errors can be difficult to pinpoint • A few common techniques are helpful in tracking down bugs
  • 12.
    JavaScript, Sixth Edition12 Tracing Errors with the window.alert() Method • Tracing – Examining statements in an executing program • window.alert() method – A useful way to trace JavaScript code – Place at different points within program • Used to display variable or array contents or value returned from a function • Use multiple window.alert() methods – Check values as code executes • Example: function not returning correct result of 485 – Returning 5169107
  • 13.
    JavaScript, Sixth Edition13 function calculatePay() { var payRate = 15; numHours = 40; var grossPay = payRate * numHours; window.alert(grossPay); var federalTaxes = grossPay * .06794; var stateTaxes = grossPay * .0476; var socialSecurity = grossPay * .062; var medicare = grossPay * .0145; var netPay = grossPay - federalTaxes; netPay *= stateTaxes; netPay *= socialSecurity; netPay *= medicare; return netPay; } Tracing Errors with the window.alert() Method (cont’d.)
  • 14.
    JavaScript, Sixth Edition14 Tracing Errors with the window.alert() Method (cont’d.) • Drawback – Must close each dialog box for code to continue executing • Use selectively at key points • Place debugging code at different indent level to distinguish from program code
  • 15.
    JavaScript, Sixth Edition15 Tracing Errors with the console.log() Method • Trace a bug by analyzing a list of values • Logging – writing values directly to the console using the console.log() method – syntax: console.log(value); – can log string literal, variable value, or combination • Example – calculatePay() function
  • 16.
    JavaScript, Sixth Edition16 Tracing Errors with the console.log() Method (cont’d.) function calculatePay() { var payRate = 15; numHours = 40; var grossPay = payRate * numHours; console.log("grossPay is " + grossPay); var federalTaxes = grossPay * .06794; var stateTaxes = grossPay * .0476; var socialSecurity = grossPay * .062; var medicare = grossPay * .0145; var netPay = grossPay - federalTaxes; console.log("grossPay minus federalTaxes is " + netPay); netPay *= stateTaxes; console.log("netPay minus stateTaxes is " + netPay); netPay *= socialSecurity; console.log("netPay minus socialSecurity is " + netPay); netPay *= medicare; console.log("netPay minus medicare is " + netPay); return netPay; } calculatePay();
  • 17.
    JavaScript, Sixth Edition17 Tracing Errors with the console.log() Method (cont’d.) Figure 4-11 Contents of the console after executing the calculatePay() function
  • 18.
    JavaScript, Sixth Edition18 Tracing Errors with the console.log() Method (cont’d.) • Driver program – simplified, temporary program – contains only the code you are testing
  • 19.
    JavaScript, Sixth Edition19 Using Comments to Locate Bugs • Another method of locating bugs – “Comment out” problematic lines • Helps isolate statement causing the error • When error message first received – Start by commenting out only the statement specified by the line number in the error message – Continue commenting lines until error eliminated
  • 20.
    JavaScript, Sixth Edition20 Combining Debugging Techniques • Combine debugging techniques – Aid in search for errors • Example: – Use comments combined with an alert box or log message to trace errors in the calculatePay() function
  • 21.
    JavaScript, Sixth Edition21 function calculatePay() { var payRate = 15; var numHours = 40; var grossPay = payRate * numHours; window.alert(grossPay); // var federalTaxes = grossPay * .06794; // var stateTaxes = grossPay * .0476; // var socialSecurity = grossPay * .062; // var medicare = grossPay * .0145; // var netPay = grossPay – federalTaxes; // netPay *= stateTaxes; // netPay *= socialSecurity; // netPay *= medicare; // return Math.round(netPay); Combining Debugging Techniques (cont’d.)
  • 22.
    JavaScript, Sixth Edition22 Dependencies • Relationship in which one statement depends on another statement executing successfully • Can make debugging more challenging • Important to retest program after fixing a bug to ensure other parts aren't affected by change
  • 23.
    JavaScript, Sixth Edition23 Tracing Errors with Debugging Tools • Available in current versions of all modern browsers – Internet Explorer (IE) – Chrome – Firefox • Accessible through same panel that opens when you use the console
  • 24.
    JavaScript, Sixth Edition24 Tracing Errors with Debugging Tools (cont’d.) • Examining code manually – Usually first step taken with a logic error – Works fine with smaller programs • Debugging tools – Help trace each line of code – More efficient method of finding and resolving logic errors
  • 25.
    JavaScript, Sixth Edition25 Understanding the IE, Firefox, and Chrome Debugger Windows • Using Debugger Windows – Open a document to debug in a browser – Use keyboard shortcut or menu to open debugger Table 4-1: Steps to open debuggers in IE, Firefox, and Chrome
  • 26.
    JavaScript, Sixth Edition26 Understanding the IE, Firefox, and Chrome Debugger Windows (cont’d.) • Debugger window – Usually separate pane attached to bottom of browser window – Can also detach pane into separate window
  • 27.
    JavaScript, Sixth Edition27 Understanding the IE, Firefox, and Chrome Debugger Windows (cont’d.) • Internet Explorer – Shows HTML code by default – Click View sources to select a different file
  • 28.
    JavaScript, Sixth Edition28 Understanding the IE, Firefox, and Chrome Debugger Windows (cont’d.) • Firefox – Lists JavaScript files alphabetically – Click a filename to see its contents
  • 29.
    JavaScript, Sixth Edition29 Understanding the IE, Firefox, and Chrome Debugger Windows (cont’d.) • Chrome – Displays no files by default – press Ctrl + O (Win) or command + O (Mac) to select from list of associated files
  • 30.
    JavaScript, Sixth Edition30 Setting Breakpoints • Break mode – Temporary suspension of program execution – Used to monitor values and trace program execution • Breakpoint – Statement where execution enters break mode • When program paused at a breakpoint – Use debug tools to trace program execution
  • 31.
    JavaScript, Sixth Edition31 Setting Breakpoints (cont’d.) • To set a breakpoint – Click the line number of the statement where execution should stop • Resume button (Firefox/Chrome), Continue button (IE) – Executes rest of the program normally or until another breakpoint encountered
  • 32.
    JavaScript, Sixth Edition32 Figure 4-20 tuba.js execution stopped at the line 63 breakpoint Setting Breakpoints (cont’d.)
  • 33.
    JavaScript, Sixth Edition33 Clearing Breakpoints • To clear a breakpoint – Click the line number • To clear all breakpoints – Right-click any breakpoint – Click "Remove all breakpoints" or "Delete all"
  • 34.
    JavaScript, Sixth Edition34 Stepping Through Your Scripts • Stepping into – Executes an individual line of code • Pauses until instructed to continue – Debugger stops at each line within every function • Stepping over – Allows skipping of function calls – Program still executes function stepped over • Stepping out – Executes all remaining code in the current function – Debugger stops at next statement in the calling function
  • 35.
    JavaScript, Sixth Edition35 Tracing Variables and Expressions • Variables list – Displays all local variables within the currently executing function – Shows how different values in the currently executing function affect program execution • Watch list – Monitors variables and expressions in break mode
  • 36.
    JavaScript, Sixth Edition36 Tracing Variables and Expressions (cont’d.) – To access watch list • IE – Displayed by default on right side of pane – In break mode, local and global variables displayed • Firefox – Click Expand Panes button – Shows watch and variables list on right side of pane • Chrome – Displayed by default on right side of pane
  • 37.
    JavaScript, Sixth Edition37 Tracing Variables and Expressions (cont’d.) – To add an expression to the watch list • Locate an instance of the expression in the program • Select it and copy it to the Clipboard • Click "Click to add" (IE) or "Add watch expression (Firefox or Chrome) • Paste expression from Clipboard • Press Enter
  • 38.
    JavaScript, Sixth Edition38 Examining the Call Stack • Call stack – Ordered lists of which procedures (functions, methods, event handlers) have been called but haven't finished executing • Each time a program calls a procedure: – Procedure added to top of the call stack
  • 39.
    JavaScript, Sixth Edition39 Examining the Call Stack • IE and Chrome – Call stack list displayed to right of code • Firefox – Call stack list displayed above code
  • 40.
    JavaScript, Sixth Edition40 Handling Exceptions and Errors • Bulletproofing – Writing code to anticipate and handle potential problems • One bulletproofing technique – Validate submitted form data • Exception handling – Allows programs to handle errors as they occur in program execution • Exception – Error occurring in a program
  • 41.
    JavaScript, Sixth Edition41 Throwing Exceptions • Execute code containing an exception in a try statement • throw statement – Specifies an error message in case an error that occurs within a try block try { var lastName = document.getElementById("lName").value; if (lastName === "") { throw "Please enter your last name."; } }
  • 42.
    JavaScript, Sixth Edition42 Catching Exceptions • Use a catch statement – Handles, or “catches” the error • Syntax: catch(error) { statements; } • Example: catch(lNameError) { window.alert(lNameError); return false; }
  • 43.
    JavaScript, Sixth Edition43 Executing Final Exception Handling Tasks • finally statement – Executes regardless of whether its associated try block throws an exception – Used to perform some type of cleanup • Or any necessary tasks after code evaluated with a try statement
  • 44.
    JavaScript, Sixth Edition44 Implementing Custom Error Handling • Primary purpose of exception handling – Prevent users from seeing errors occurring in programs – Provide graceful way to handle errors • Reason for using exception handling with JavaScript – Evaluate user input • Programmers may write their own error-handling code – Can write user-friendly messages – Provides greater control over any errors
  • 45.
    JavaScript, Sixth Edition45 Implementing Custom Error Handling (cont’d.) • Catching errors with the error event – Executes whenever error occurs on a Web page – Name of function to handle JavaScript errors • Assigned as event listener for error event – Preventing the Web browser from executing its own error handling functionality • Return return a value of true from the error event handler function
  • 46.
    JavaScript, Sixth Edition46 Implementing Custom Error Handling (cont’d.) • Writing custom error-handling functions – JavaScript interpreter automatically passes three arguments to the custom error handling function • Error message, URL, line number – Use these values in custom error handling function • By adding parameters to the function definition – Use parameters in the function • Show a user the location of any JavaScript errors that may occur
  • 47.
    JavaScript, Sixth Edition47 Additional Debugging Techniques • Includes – Checking HTML elements – Analyzing logic – Testing statements with console command line – Using the debugger statement – Executing code in strict mode – Linting – Reloading a Web page
  • 48.
    JavaScript, Sixth Edition48 Checking HTML Elements • If a bug cannot be located using methods described in this chapter: – Perform a line-by-line analysis of the HTML code – Ensure all necessary opening and closing tags included • Use code editor specialized for web development – Highlights syntax errors as you type • Use the W3C Markup Validation Service to validate a Web page
  • 49.
    JavaScript, Sixth Edition49 Analyzing Logic • Some JavaScript code errors stem from logic problems – Can be difficult to spot using tracing techniques • Analyze each statement on a case-by-case basis
  • 50.
    JavaScript, Sixth Edition50 Testing Statements with the Console Command Line • Console command line – Testing and executing JavaScript statements • Without HTML document or JavaScript source file – Useful if trying to construct the correct syntax for a mathematical expression • Enter JavaScript statement at command line in web browser’s console • Including multiple statements at the command line – Separate statements with a semicolon
  • 51.
    JavaScript, Sixth Edition51 Using the debugger statement • When you include the debugger statement in your code – web browser stops executing JavaScript code when it reaches the debugger statement – equivalent of a breakpoint that's part of your JavaScript code
  • 52.
    JavaScript, Sixth Edition52 Using Strict Mode • Strict mode – Removes some features from JavaScript – Requires more stringent syntax for other features • Example: must always use var to declare variables • Many removed or altered features in strict mode are known to cause hard to find bugs • Include statement "use strict"; – Including at start of script section requests strict mode for all code in that section – Including at start of code block in function requests strict mode just for that function
  • 53.
    JavaScript, Sixth Edition53 Linting • Running code through a program that flags some common issues that may affect code quality • jslint is a commonly used linting program • Similar result to using strict mode, but generates a report containing line numbers
  • 54.
    JavaScript, Sixth Edition54 Reloading a Web Page • Usually click the browser Reload or Refresh button • Web browser cannot always completely clear its memory – Remnants of an old bug may remain – Force web page reload • Hold Shift key and click the browser’s Reload or Refresh button • May need to close browser window completely • May need to delete frequently visited web pages
  • 55.
    JavaScript, Sixth Edition55 Summary • Three types of program errors – Syntax errors, run-time errors, logic errors • Error messages – First line of defense in locating bugs • Tracing – Examination of individual statements in an executing program • Using console.log() method to trace bugs – Helpful to use a driver program • Browser debugging tools
  • 56.
    JavaScript, Sixth Edition56 Summary (cont’d.) • Break mode – Temporary suspension of execution to monitor values and trace execution • Breakpoint: statement in the code at which program execution enters break mode • Stepping into, stepping over, and stepping out • Variables list and watch list • Call stack – List of procedures that have started but not finished
  • 57.
    JavaScript, Sixth Edition57 Summary (cont’d.) • Bulletproofing – Writing code to anticipate, handle potential problems • Exception handling • try, throw, catch, finally statements • JavaScript includes an error event – Executes whenever an error occurs on a web page • Additional debugging methods and techniques – Checking HTML elements, analyzing logic, console command line, debugger statement, strict mode, linting, and reloading a web page