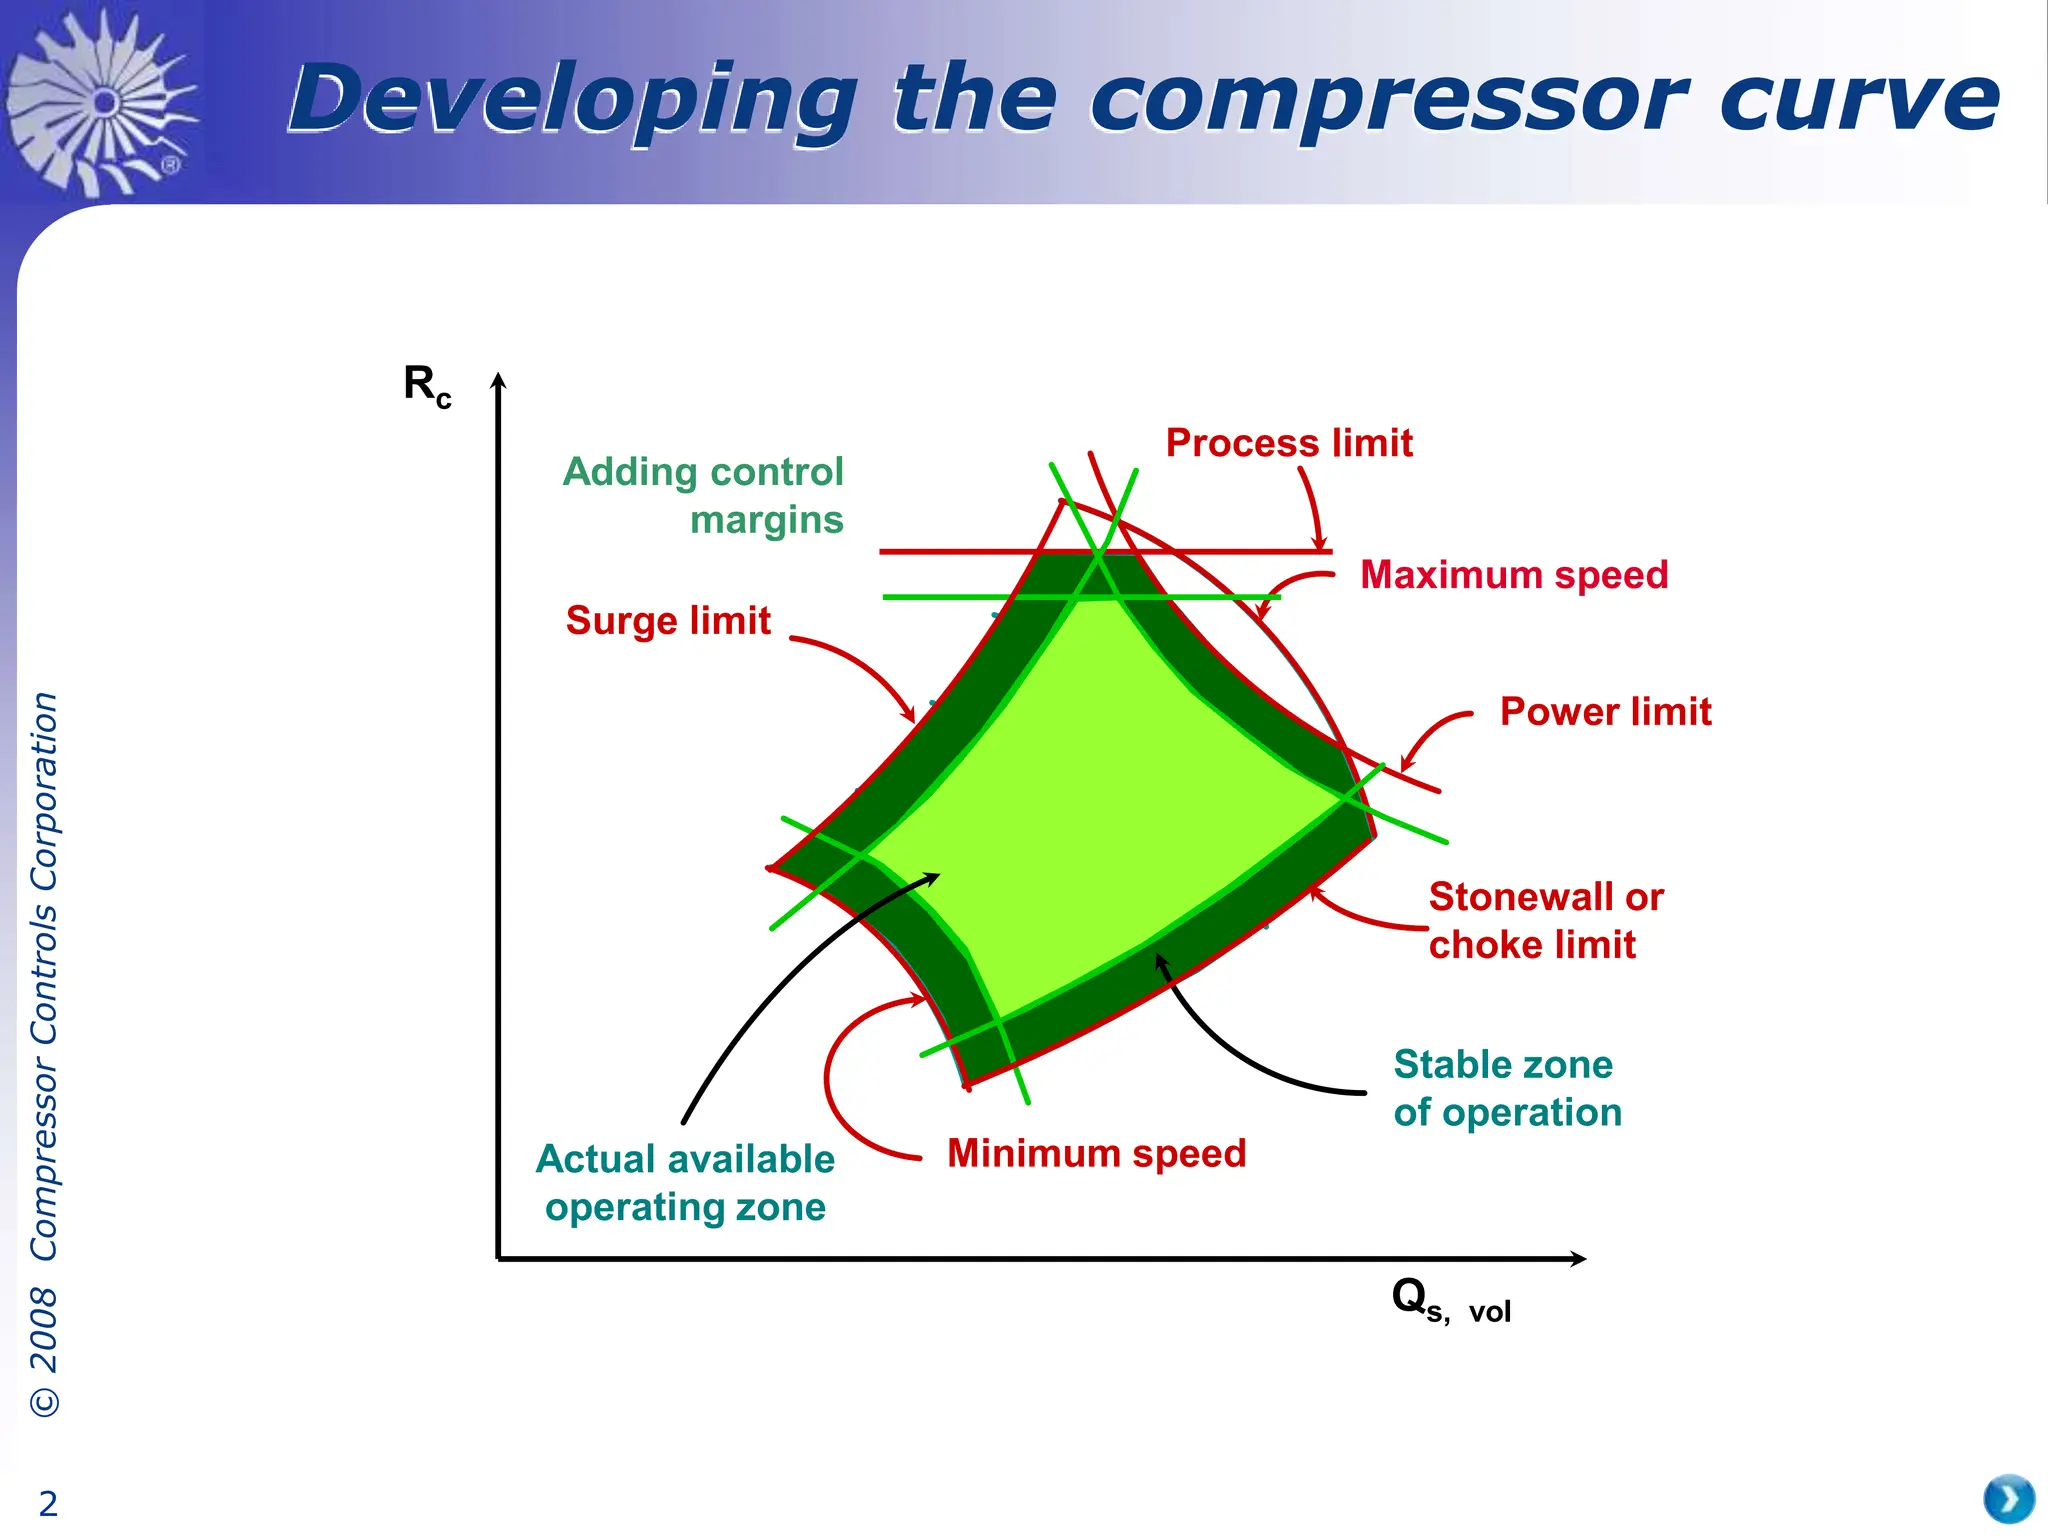
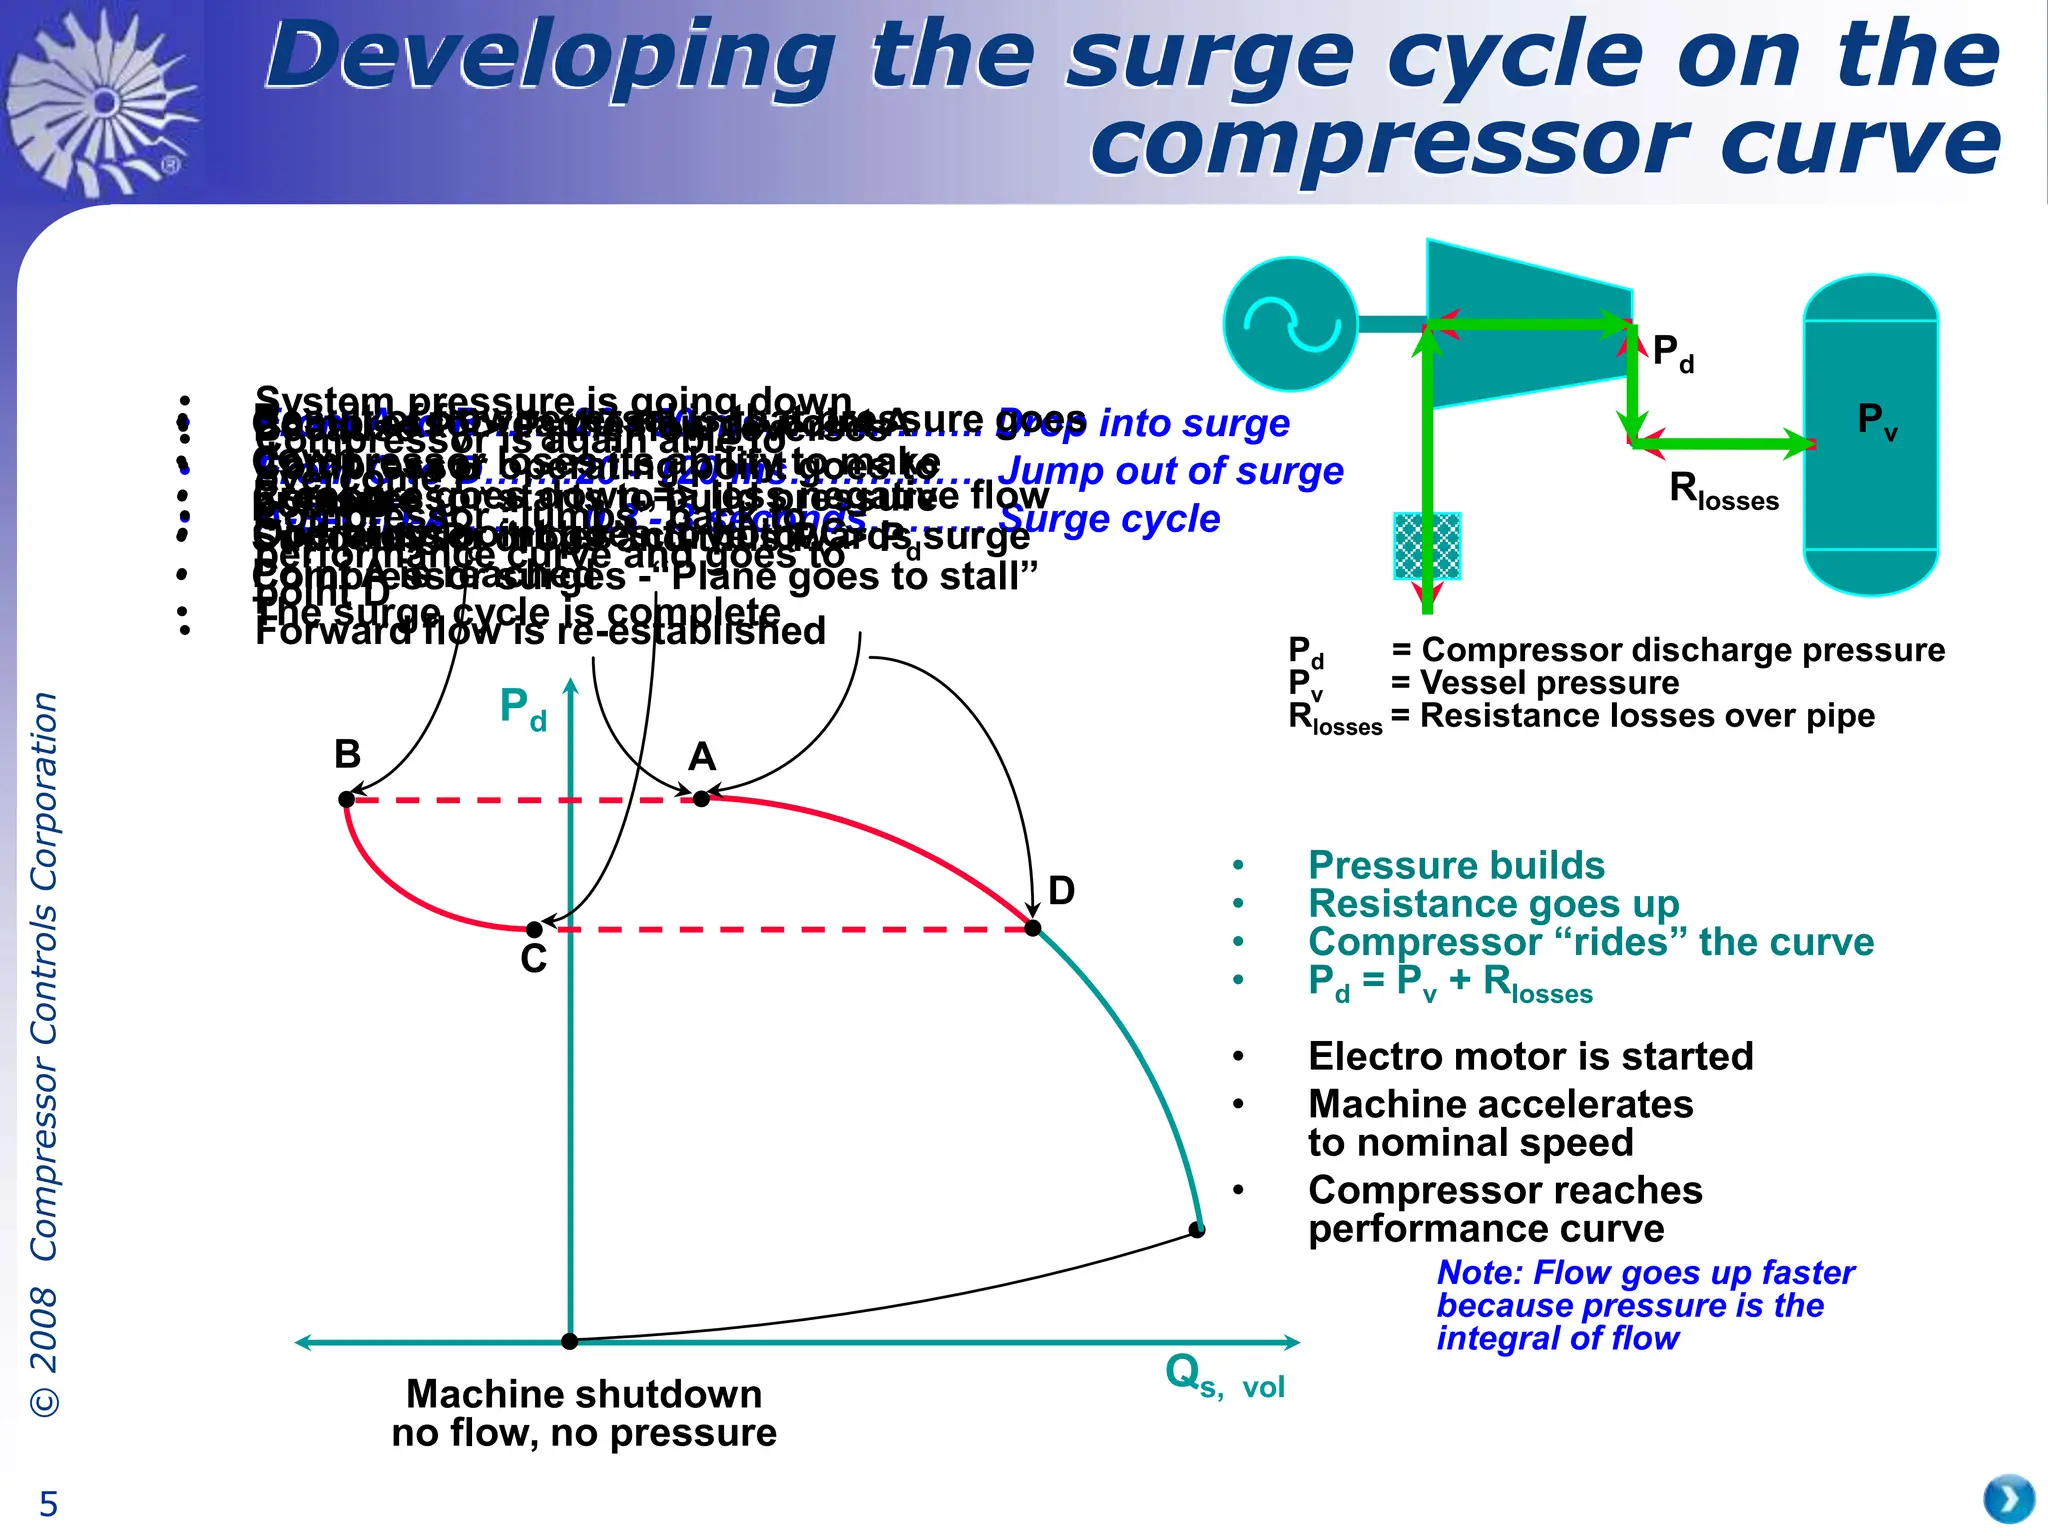
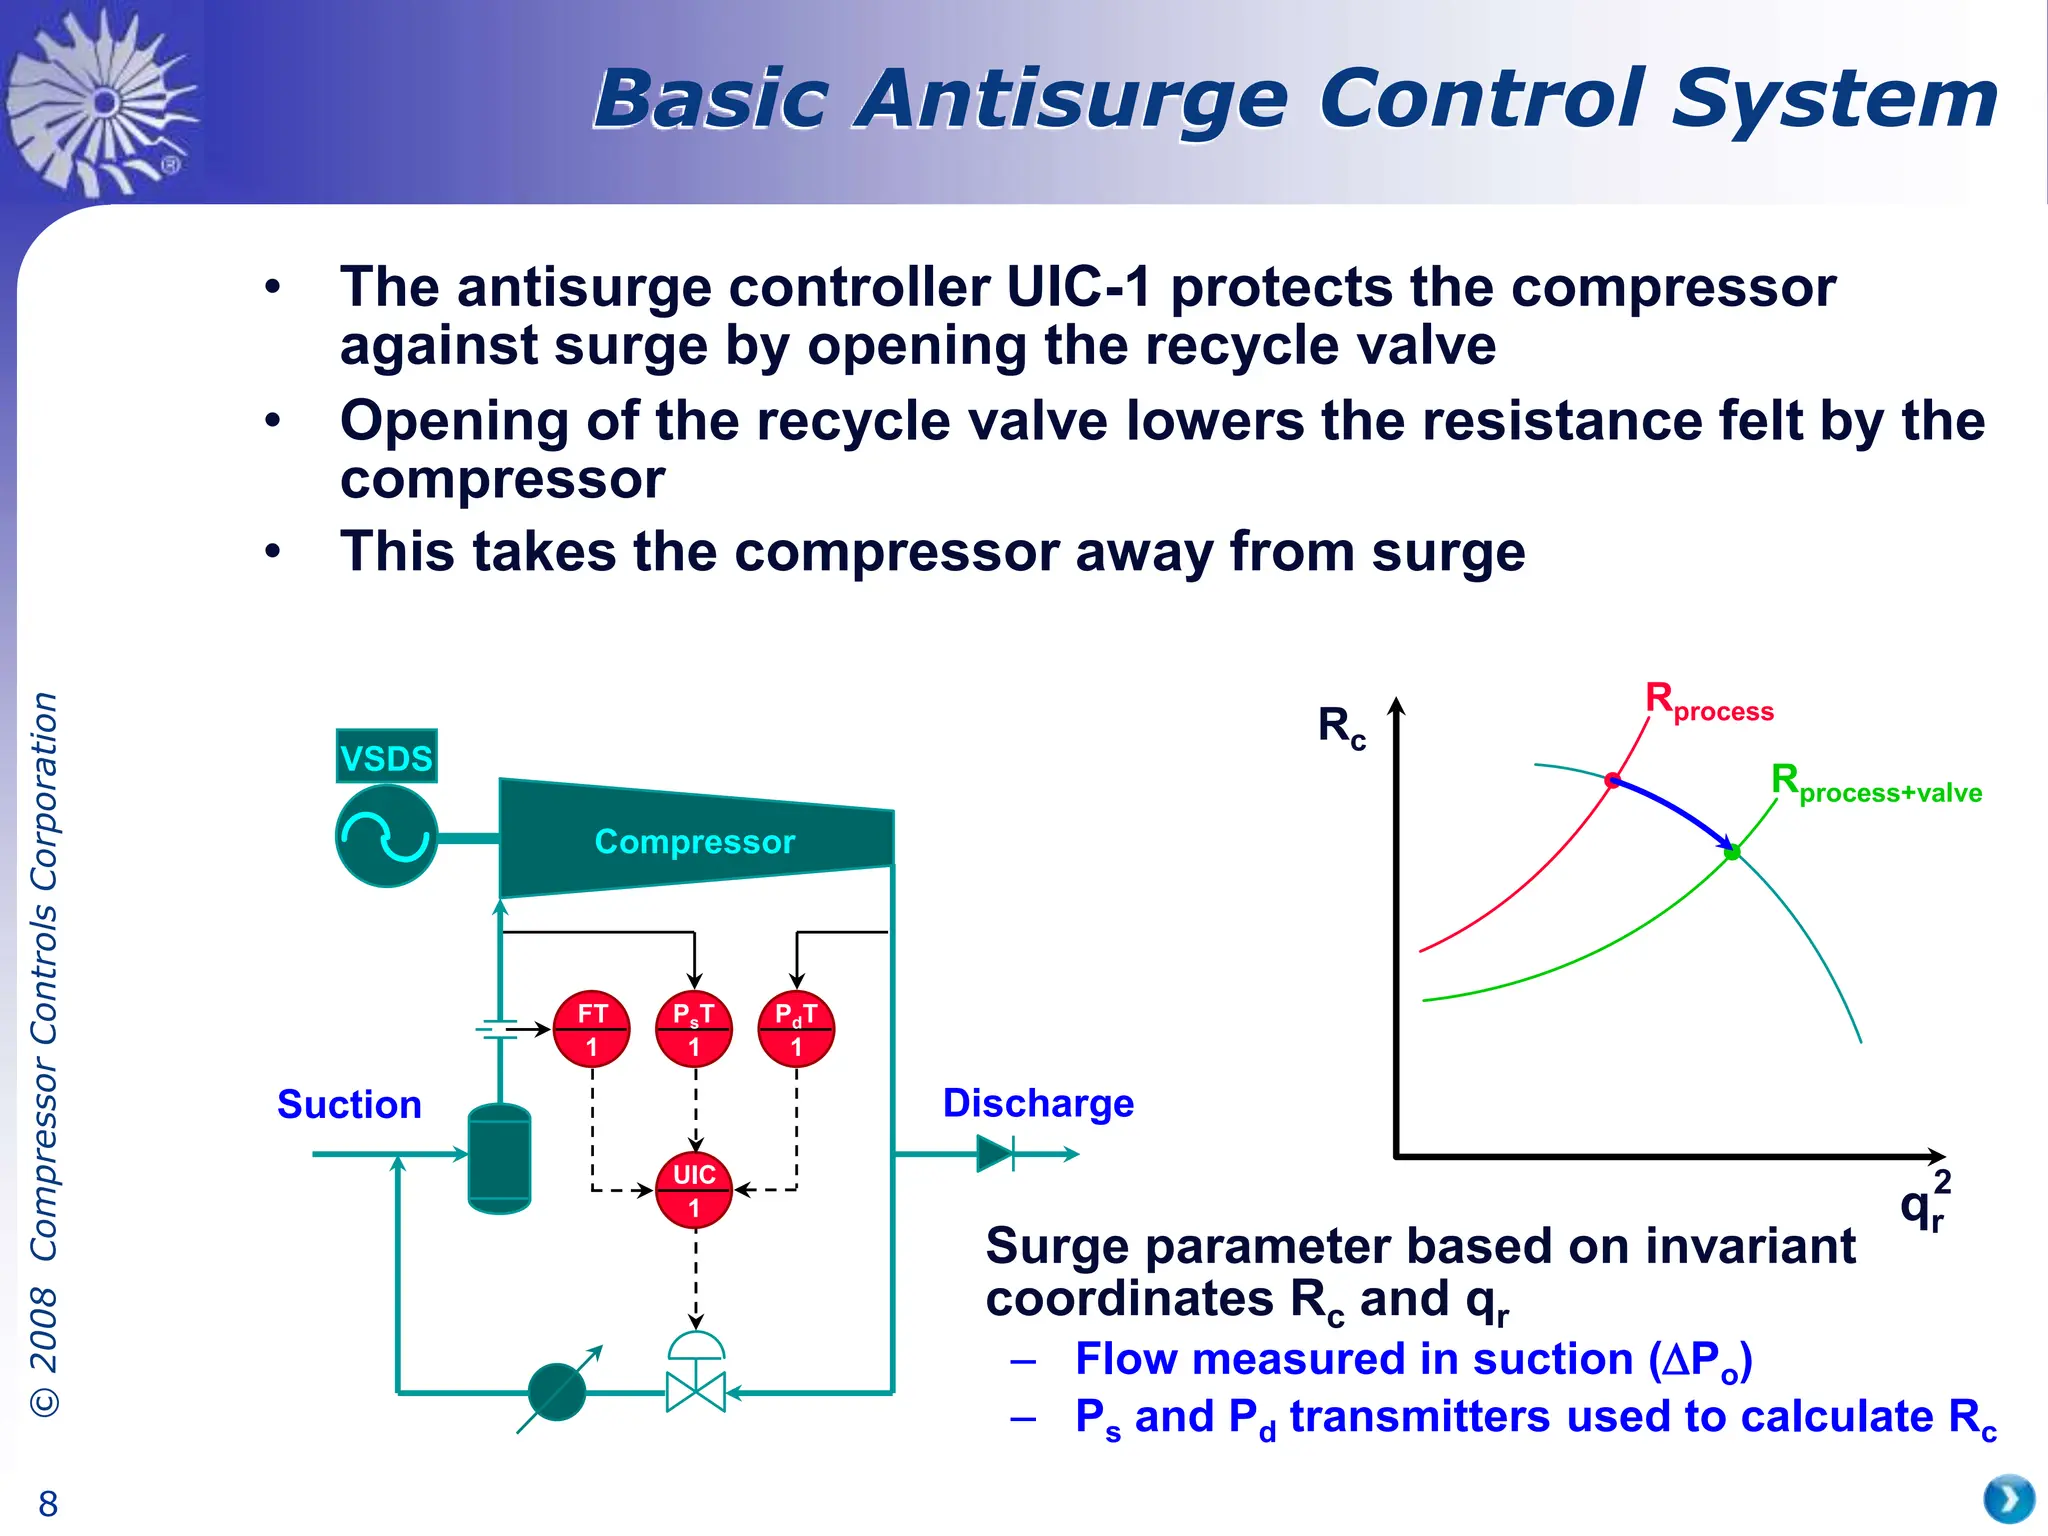
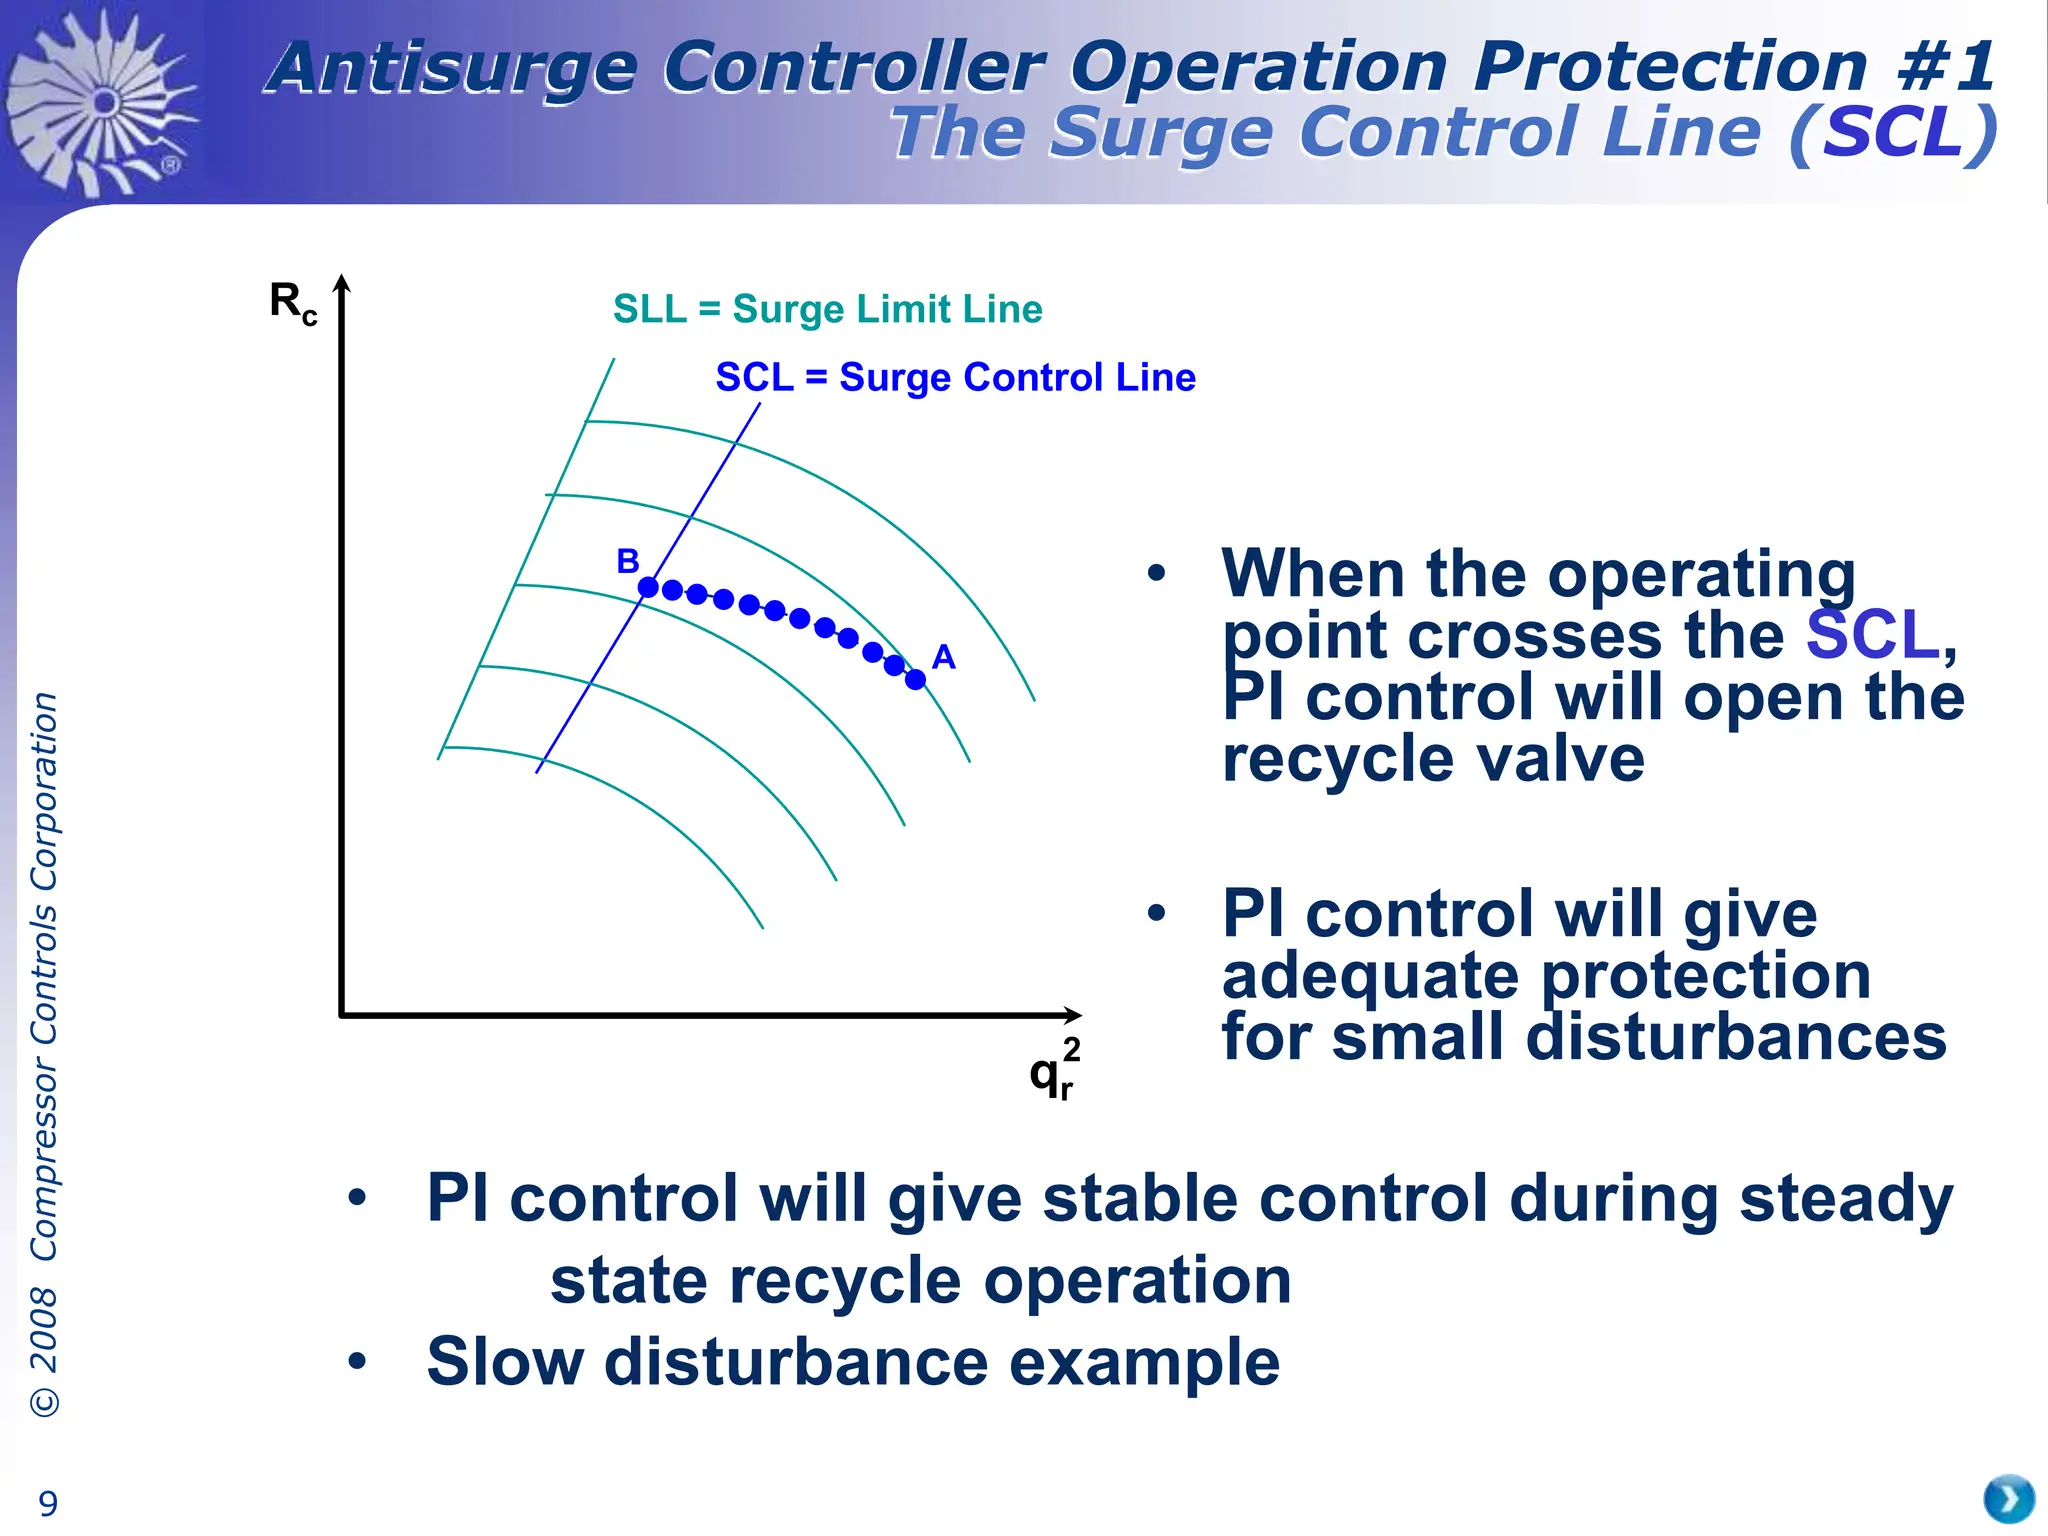
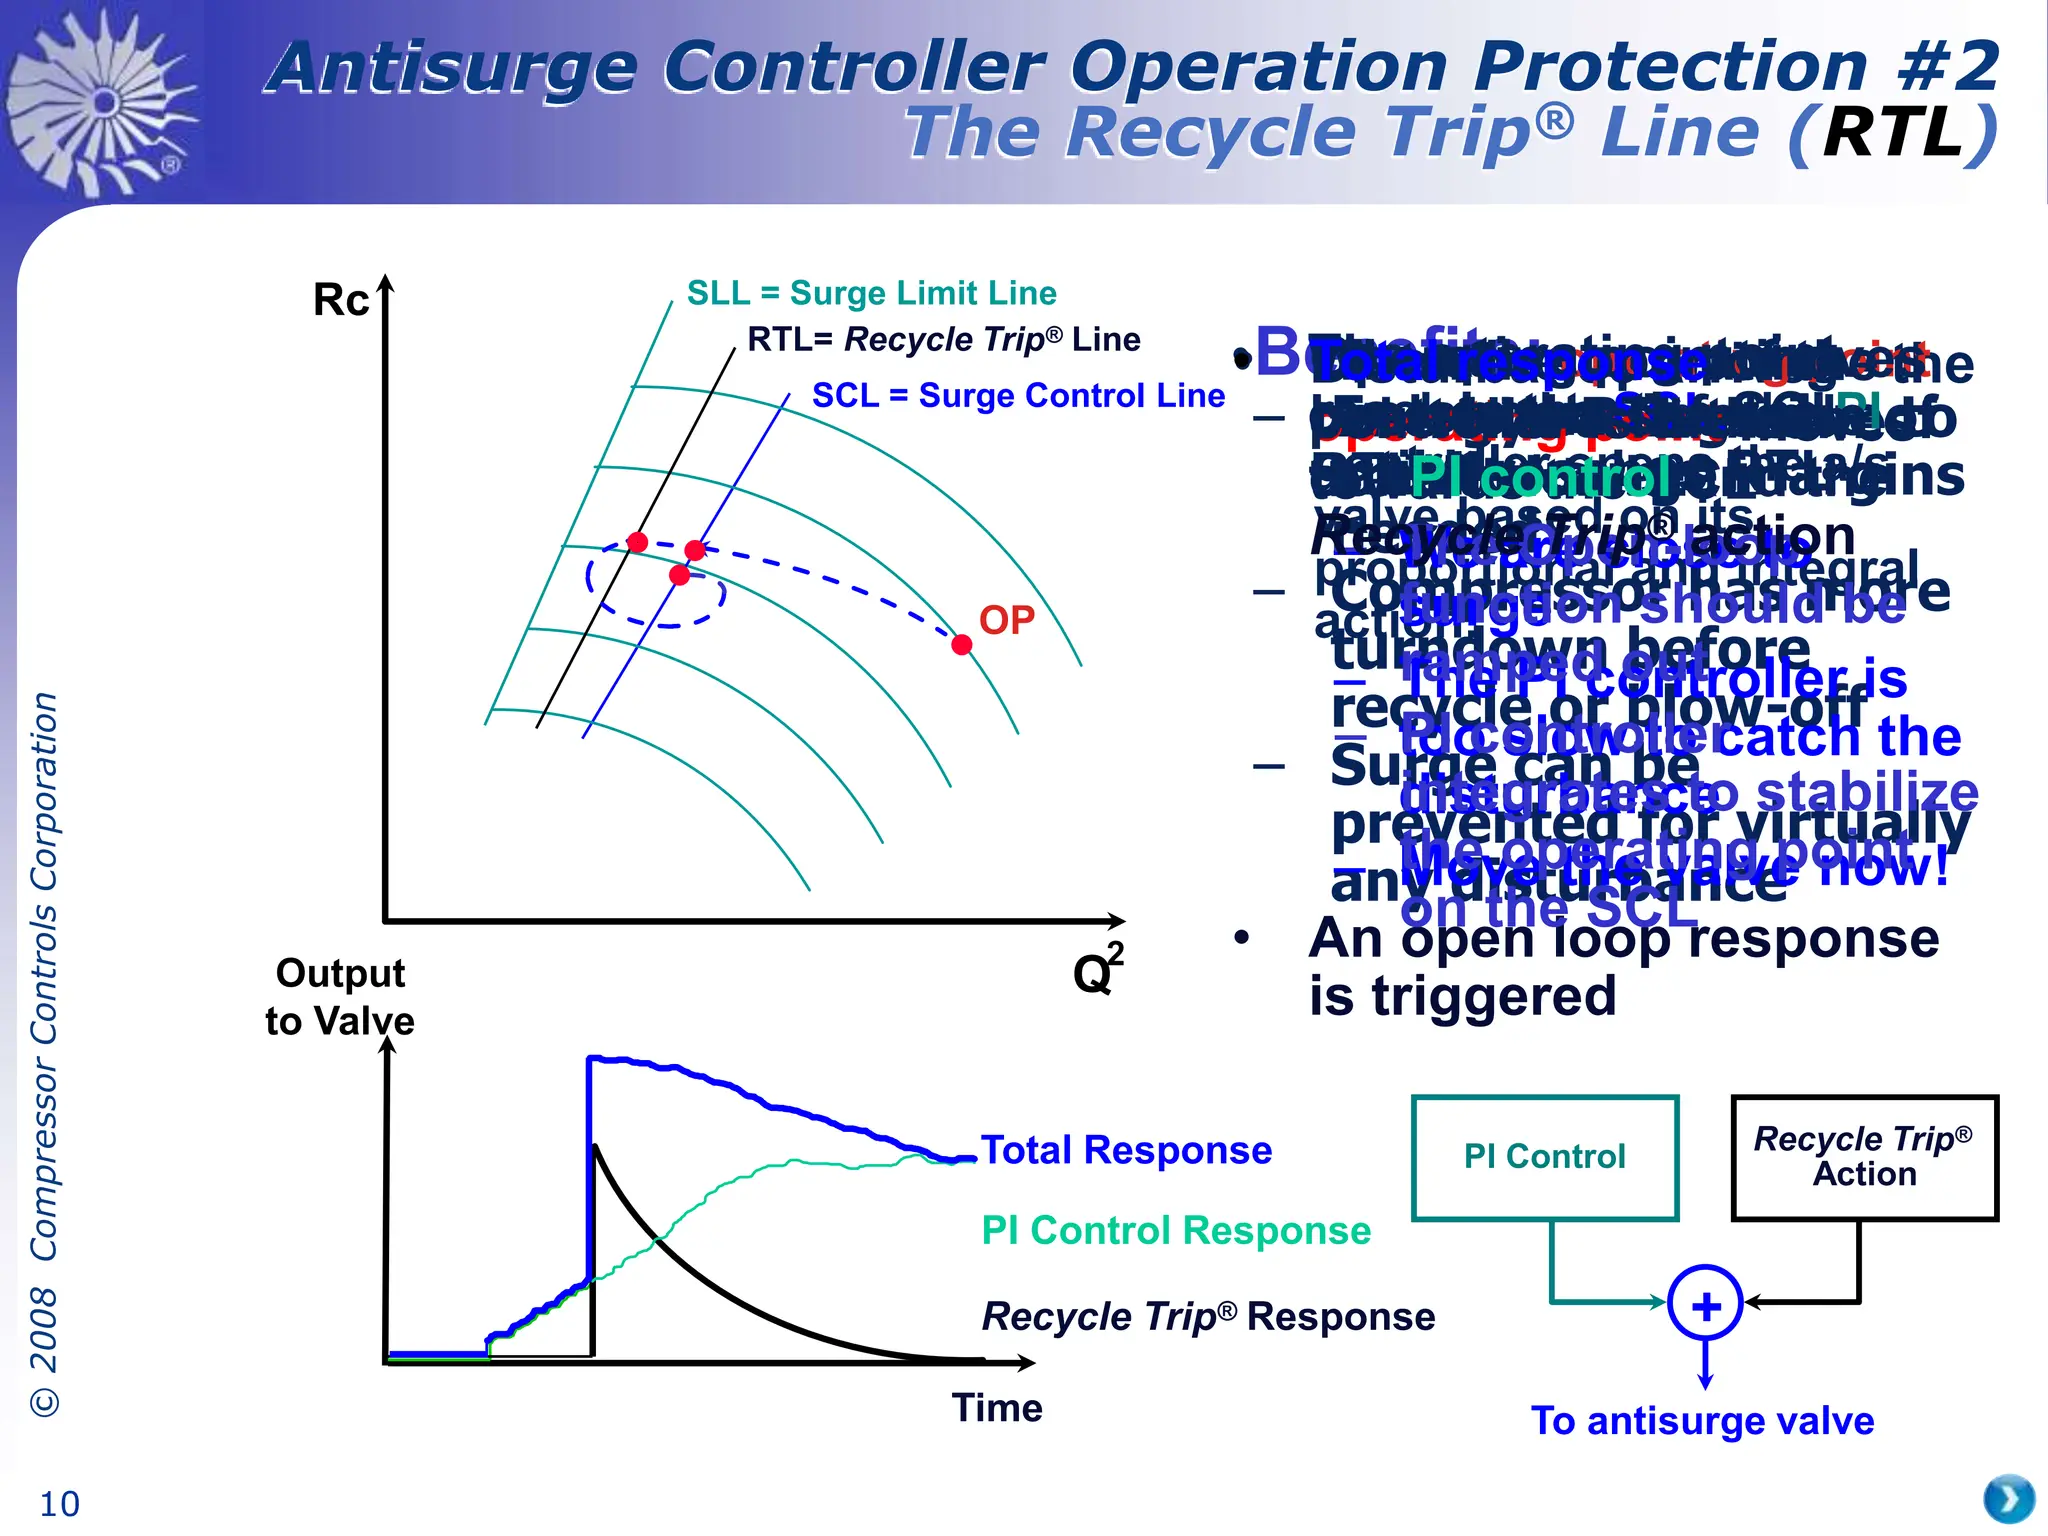
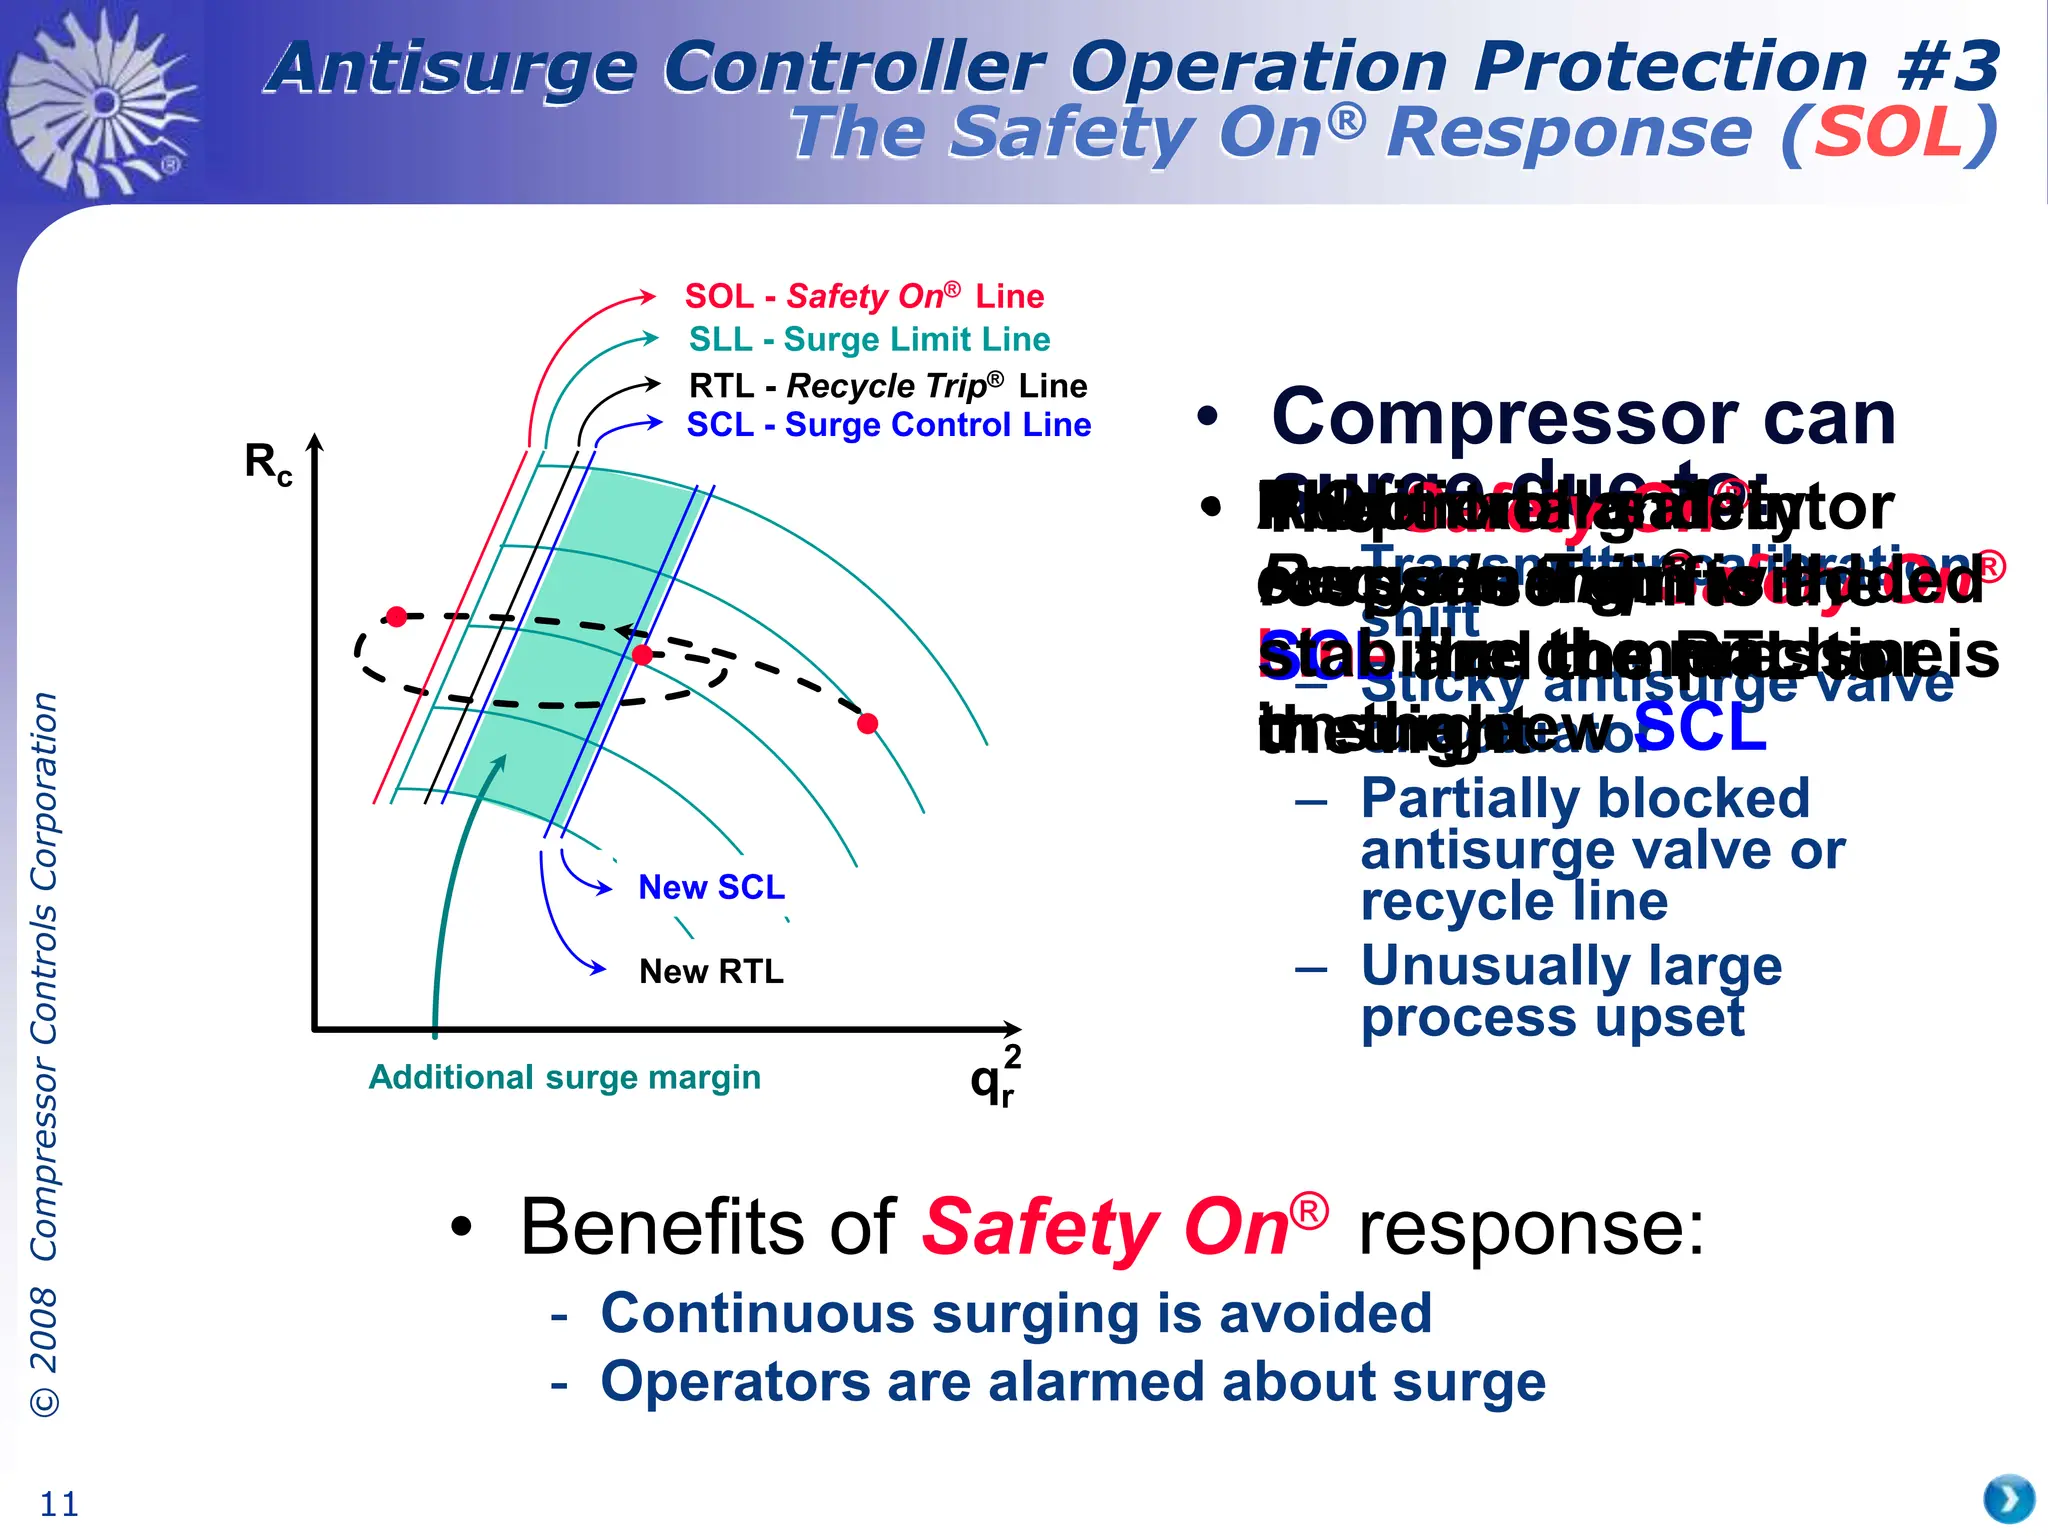
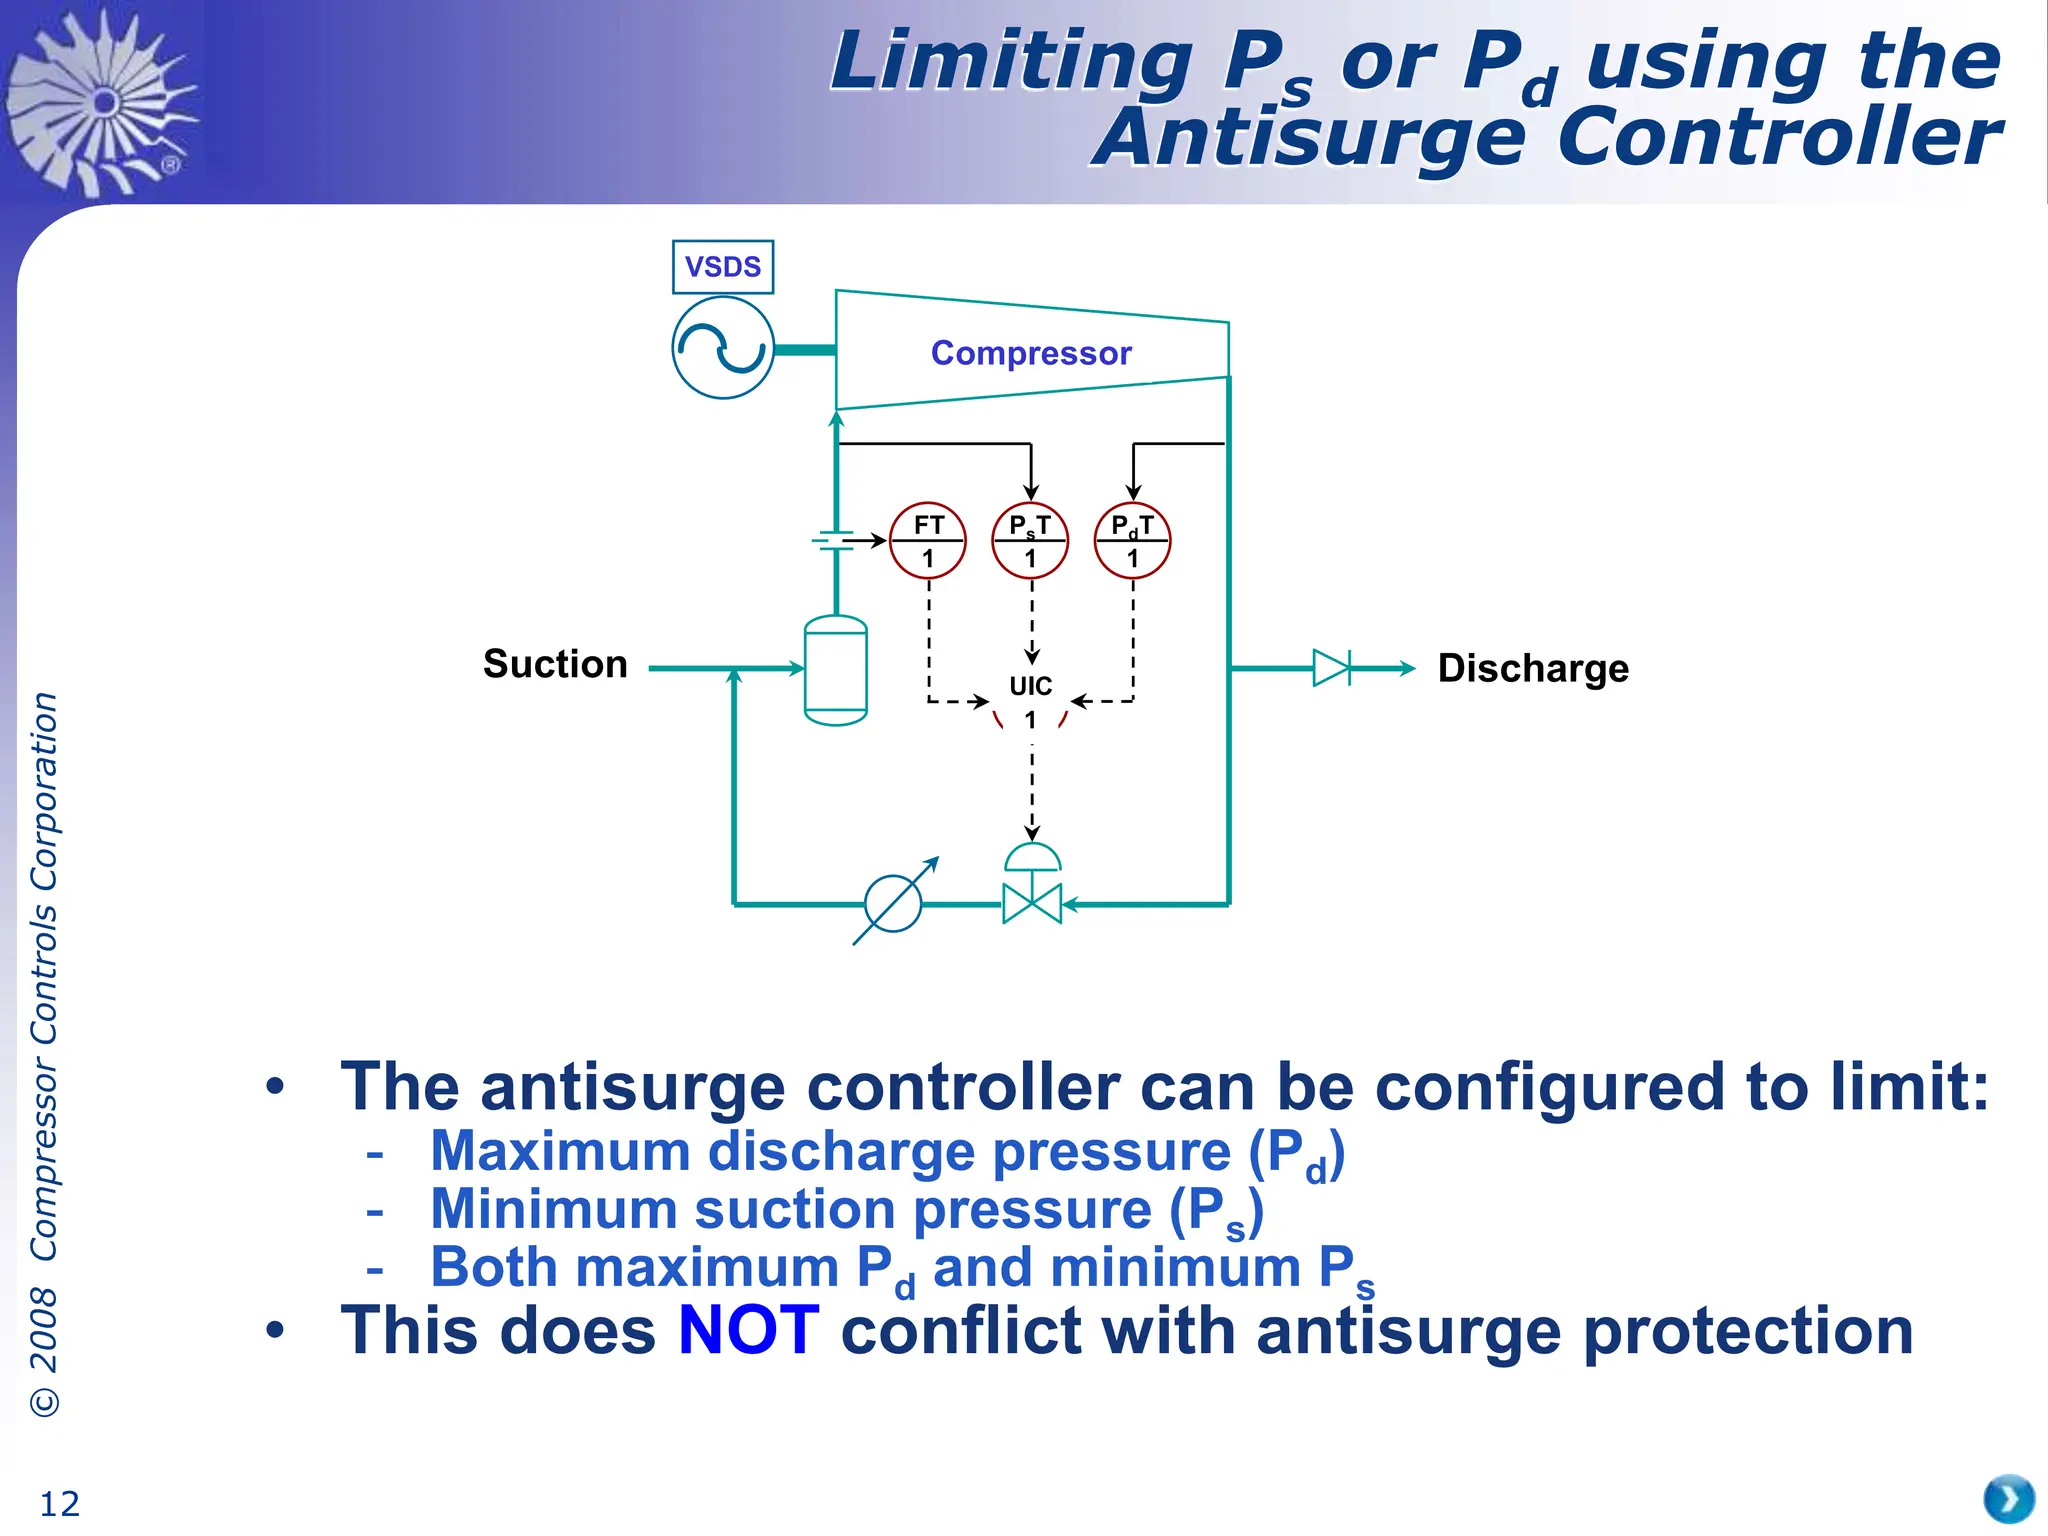
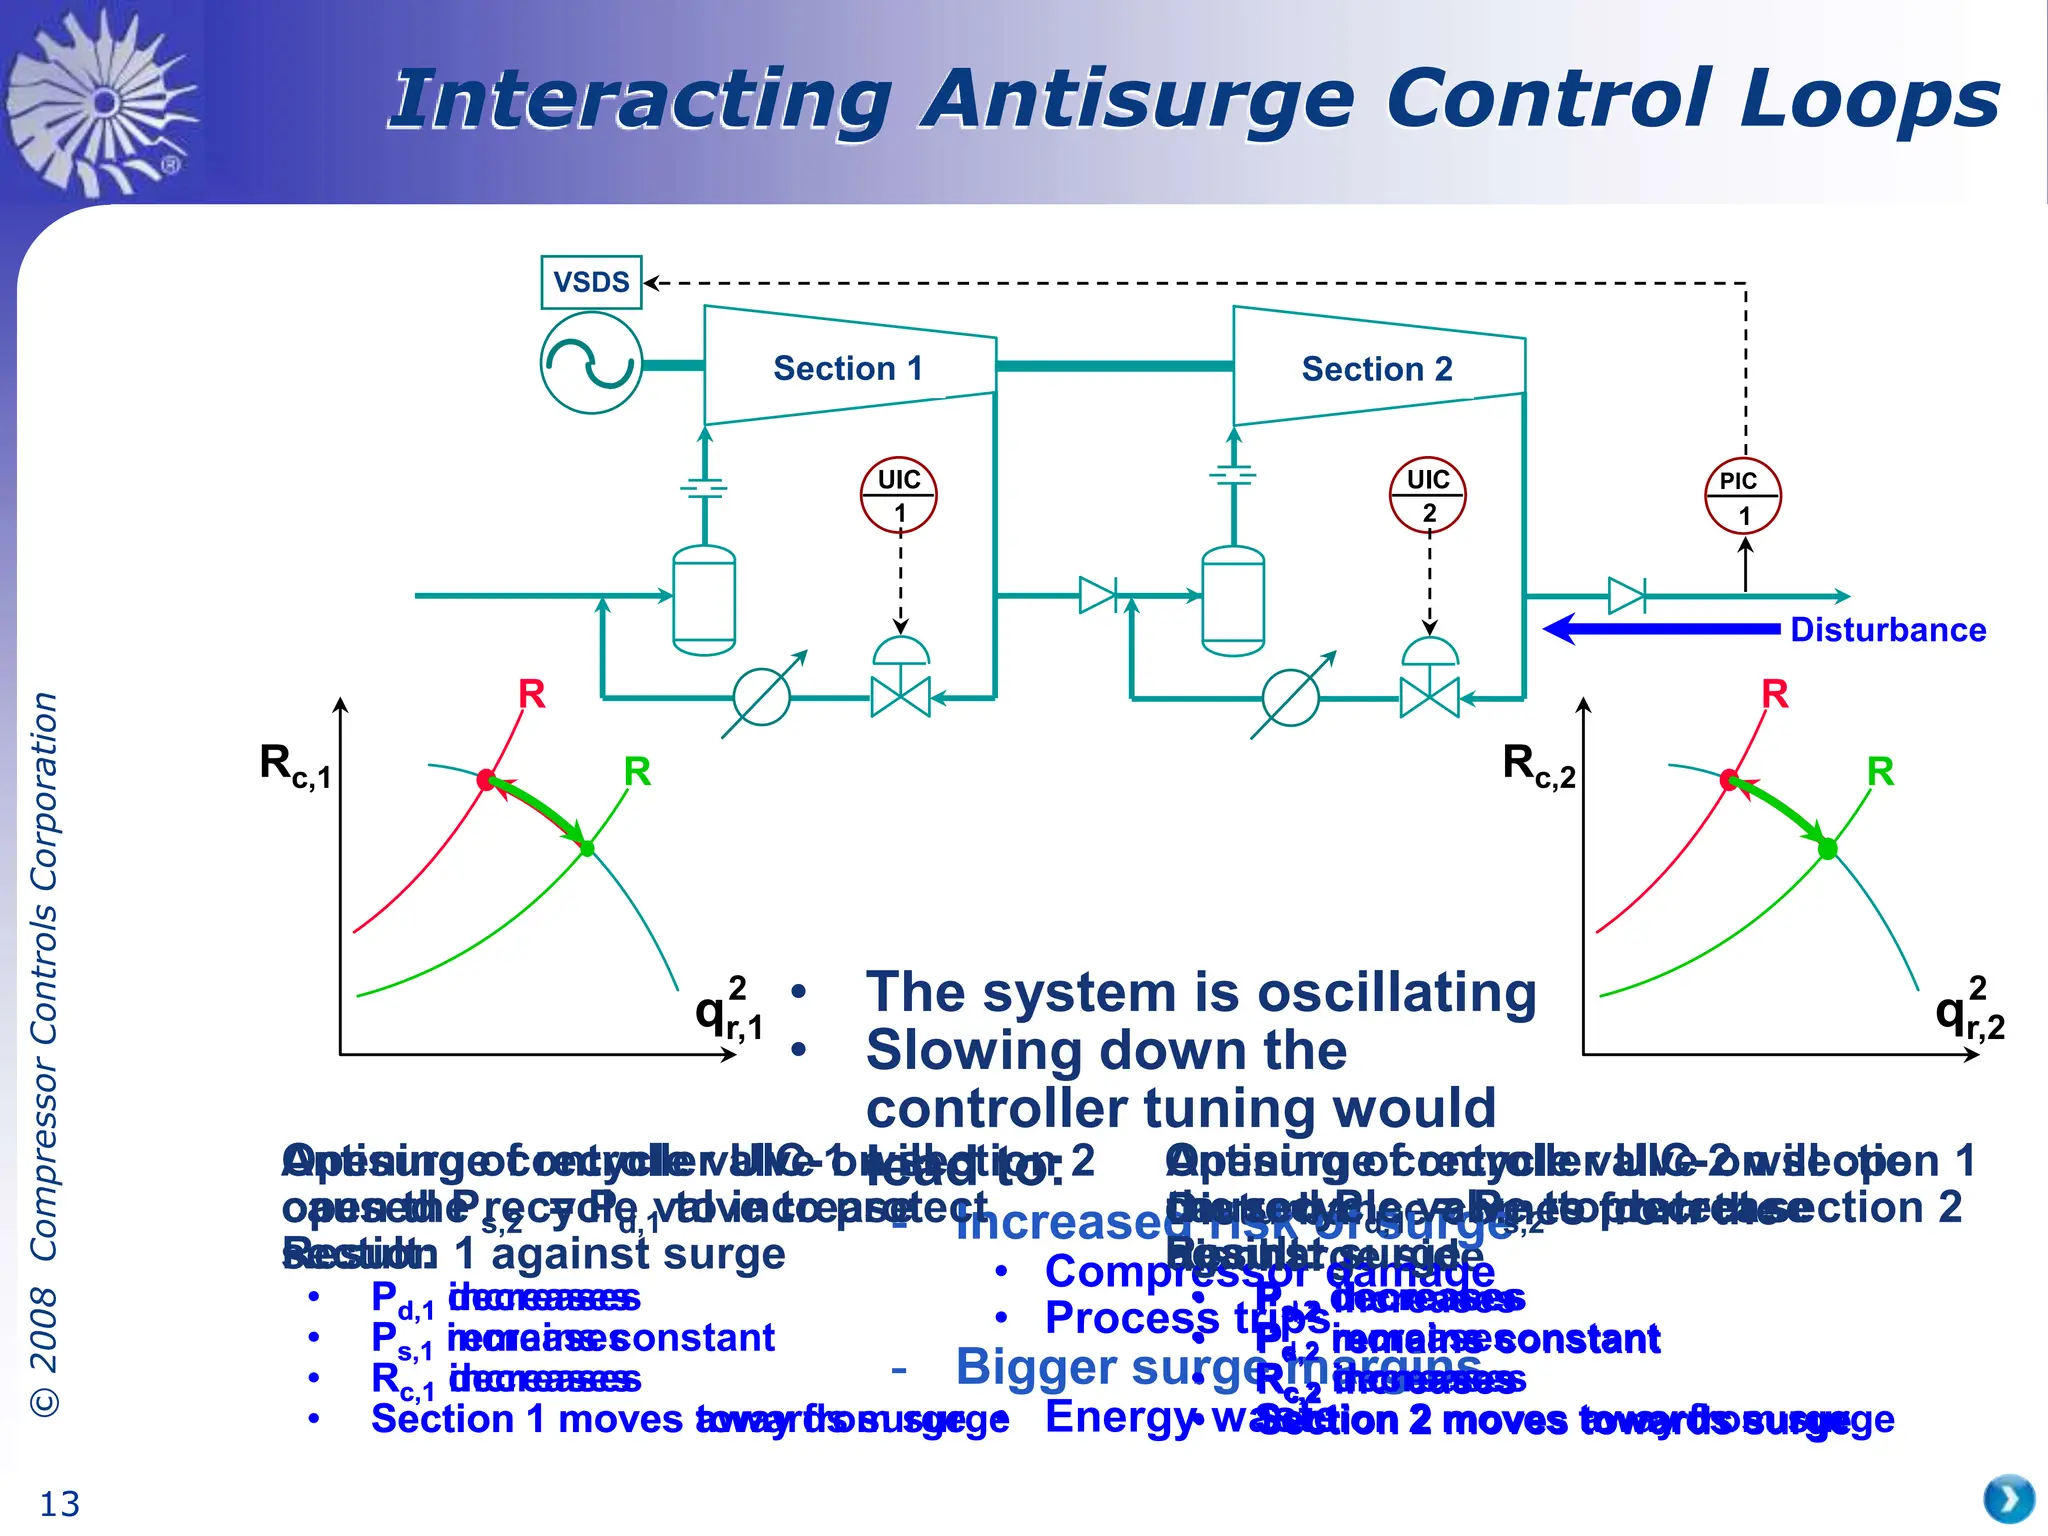
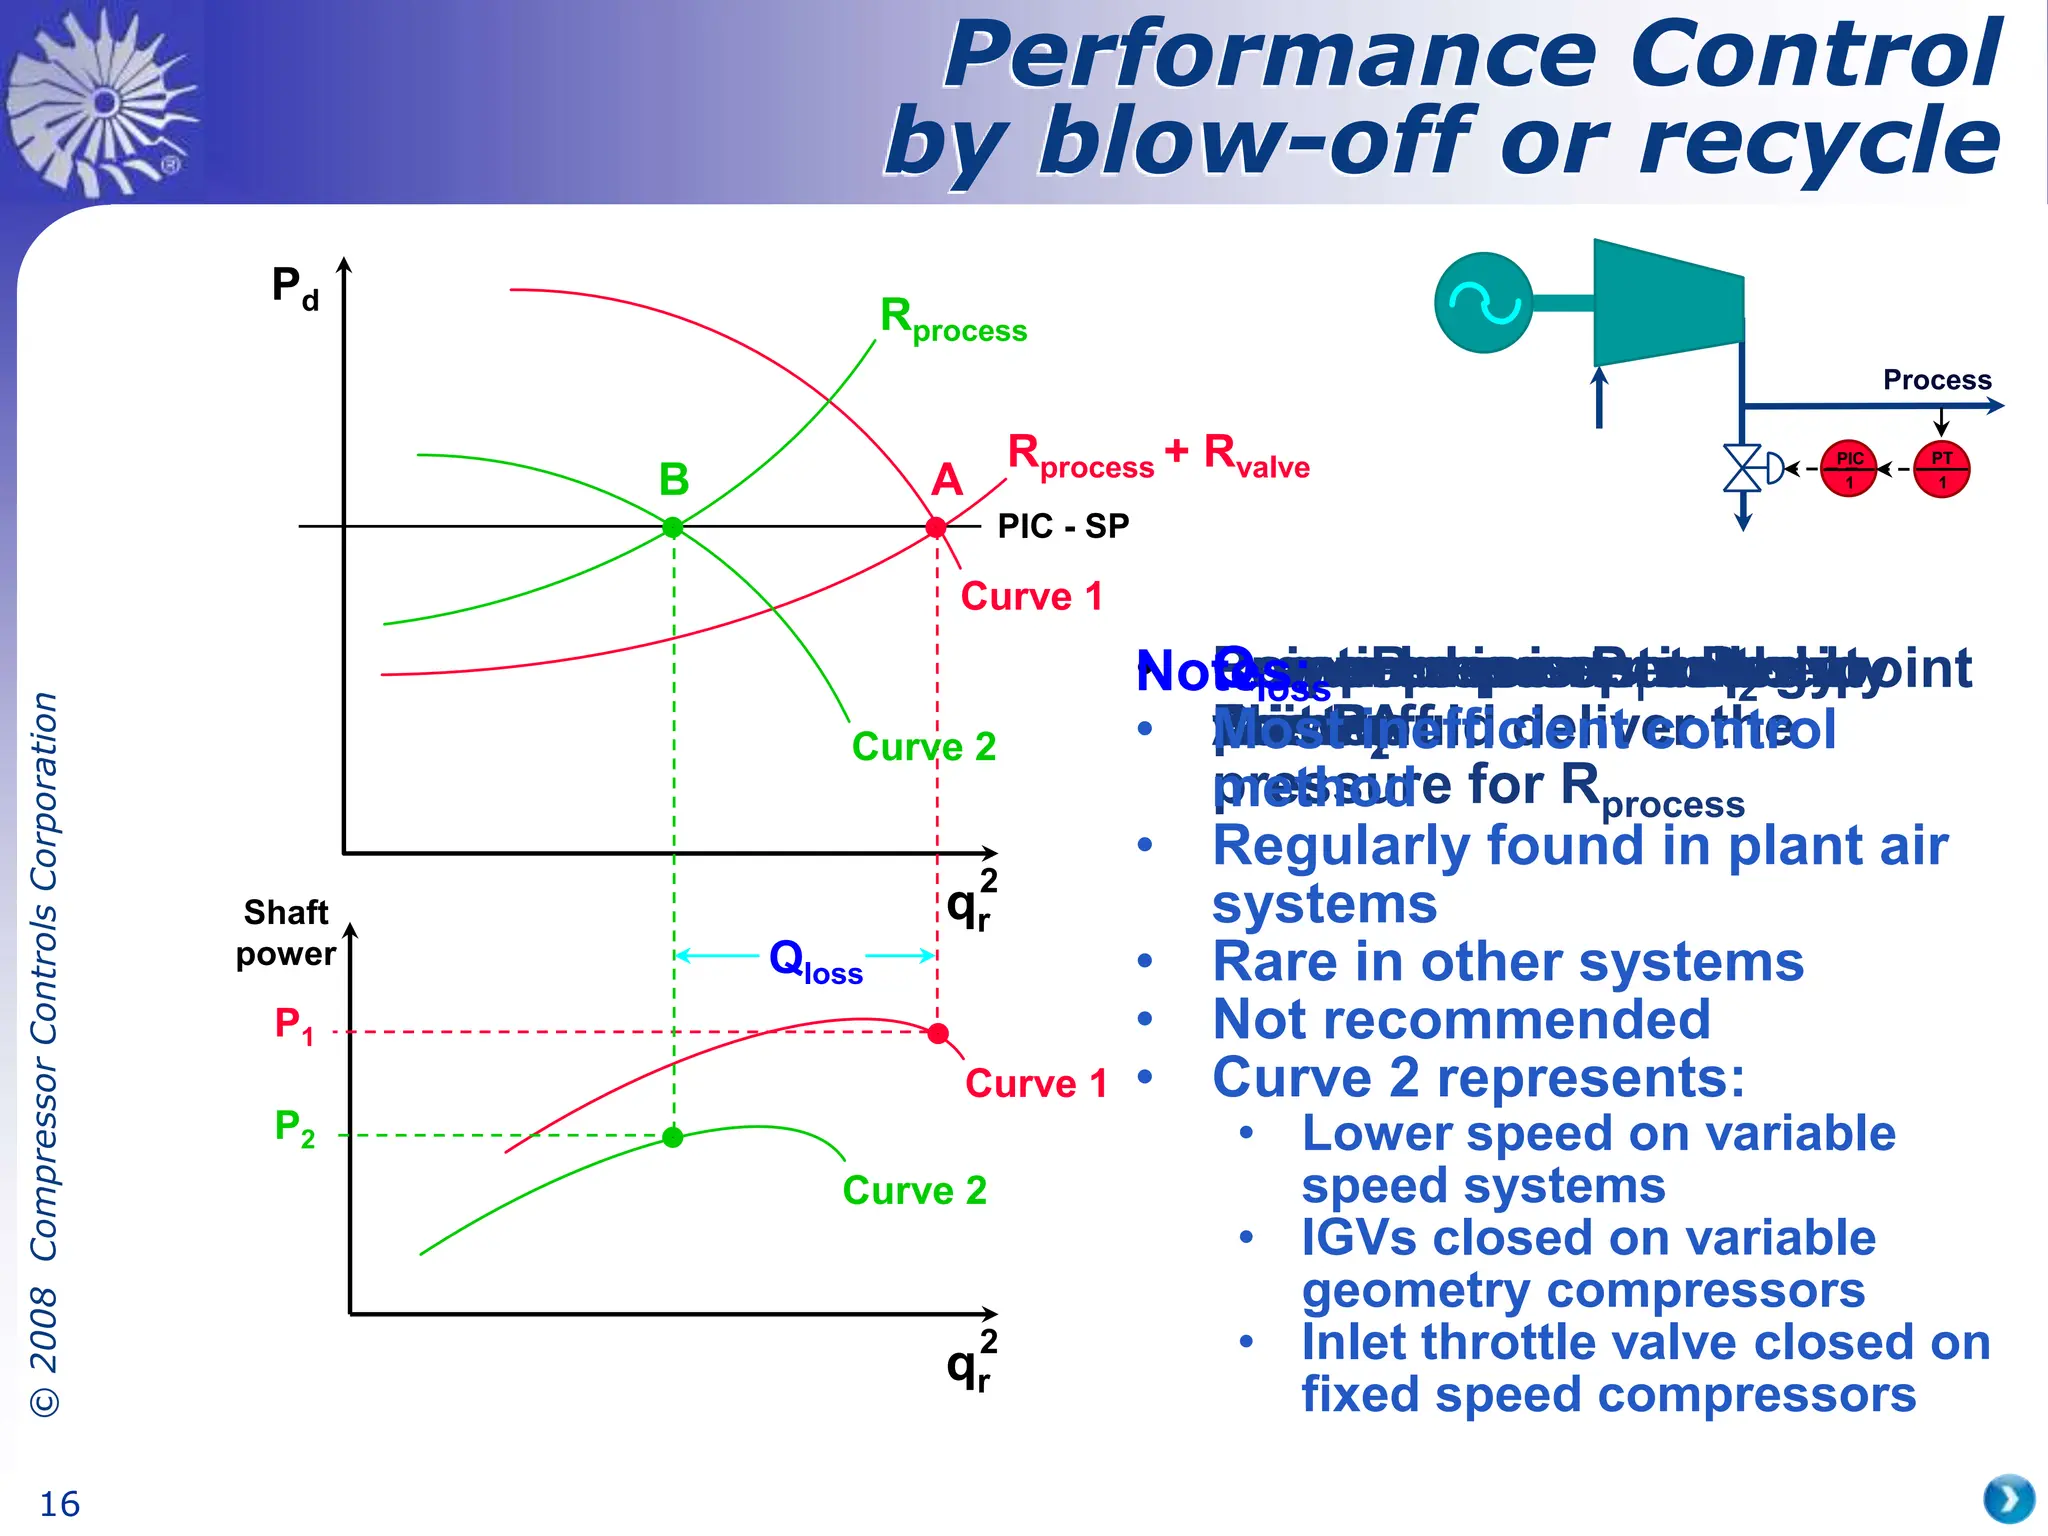
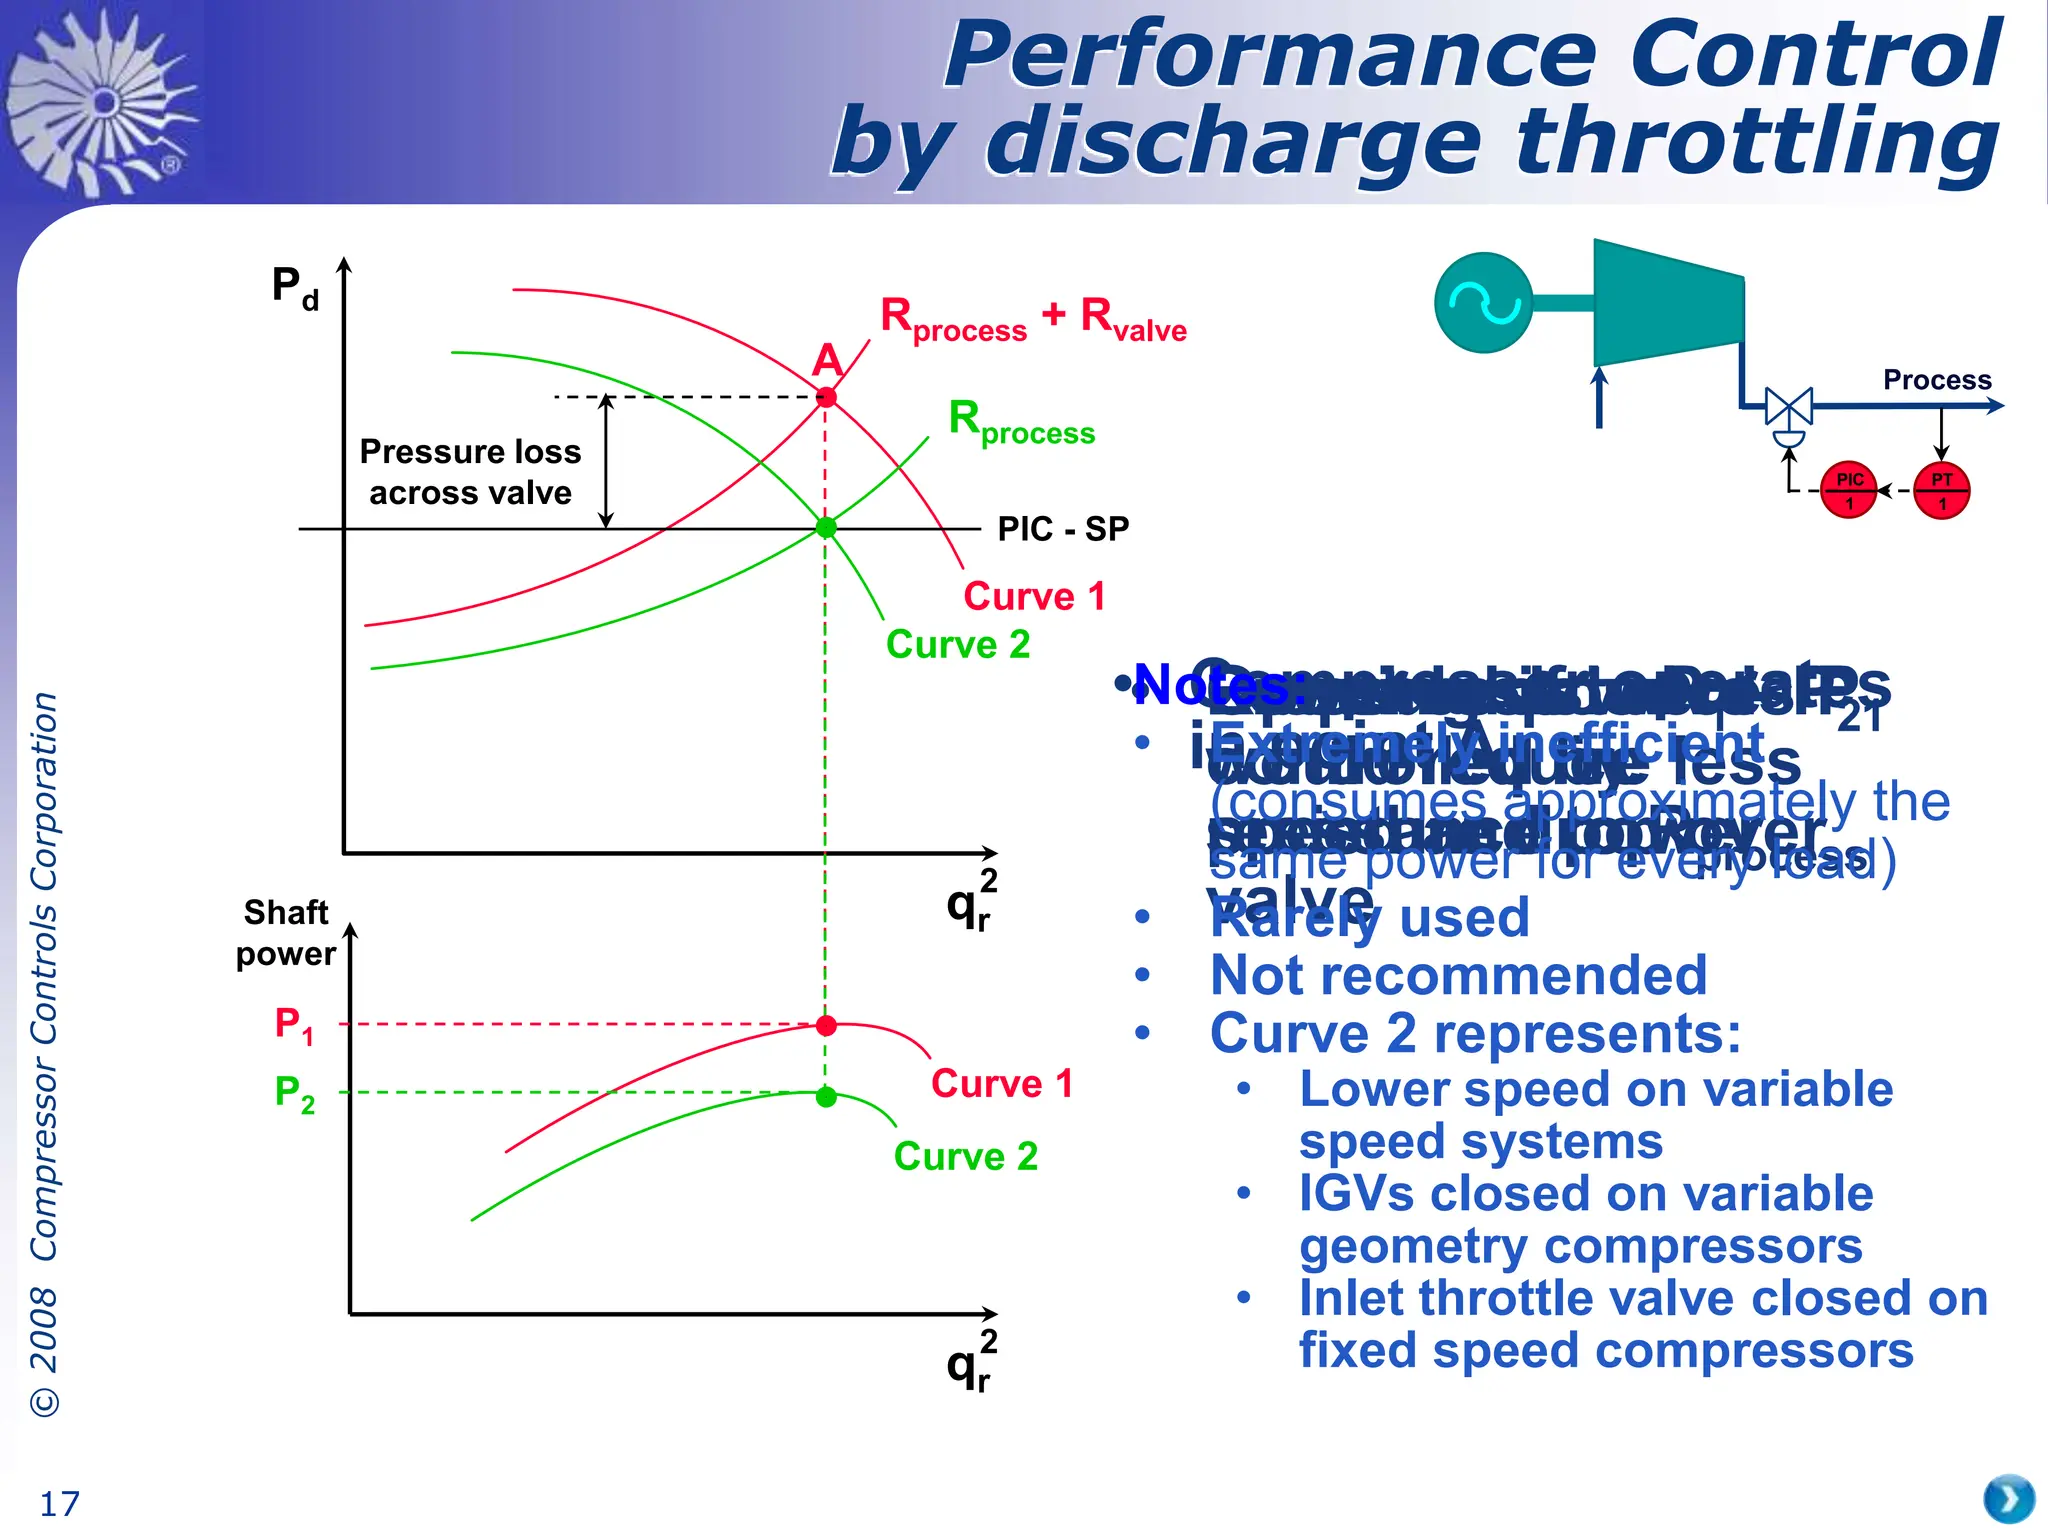
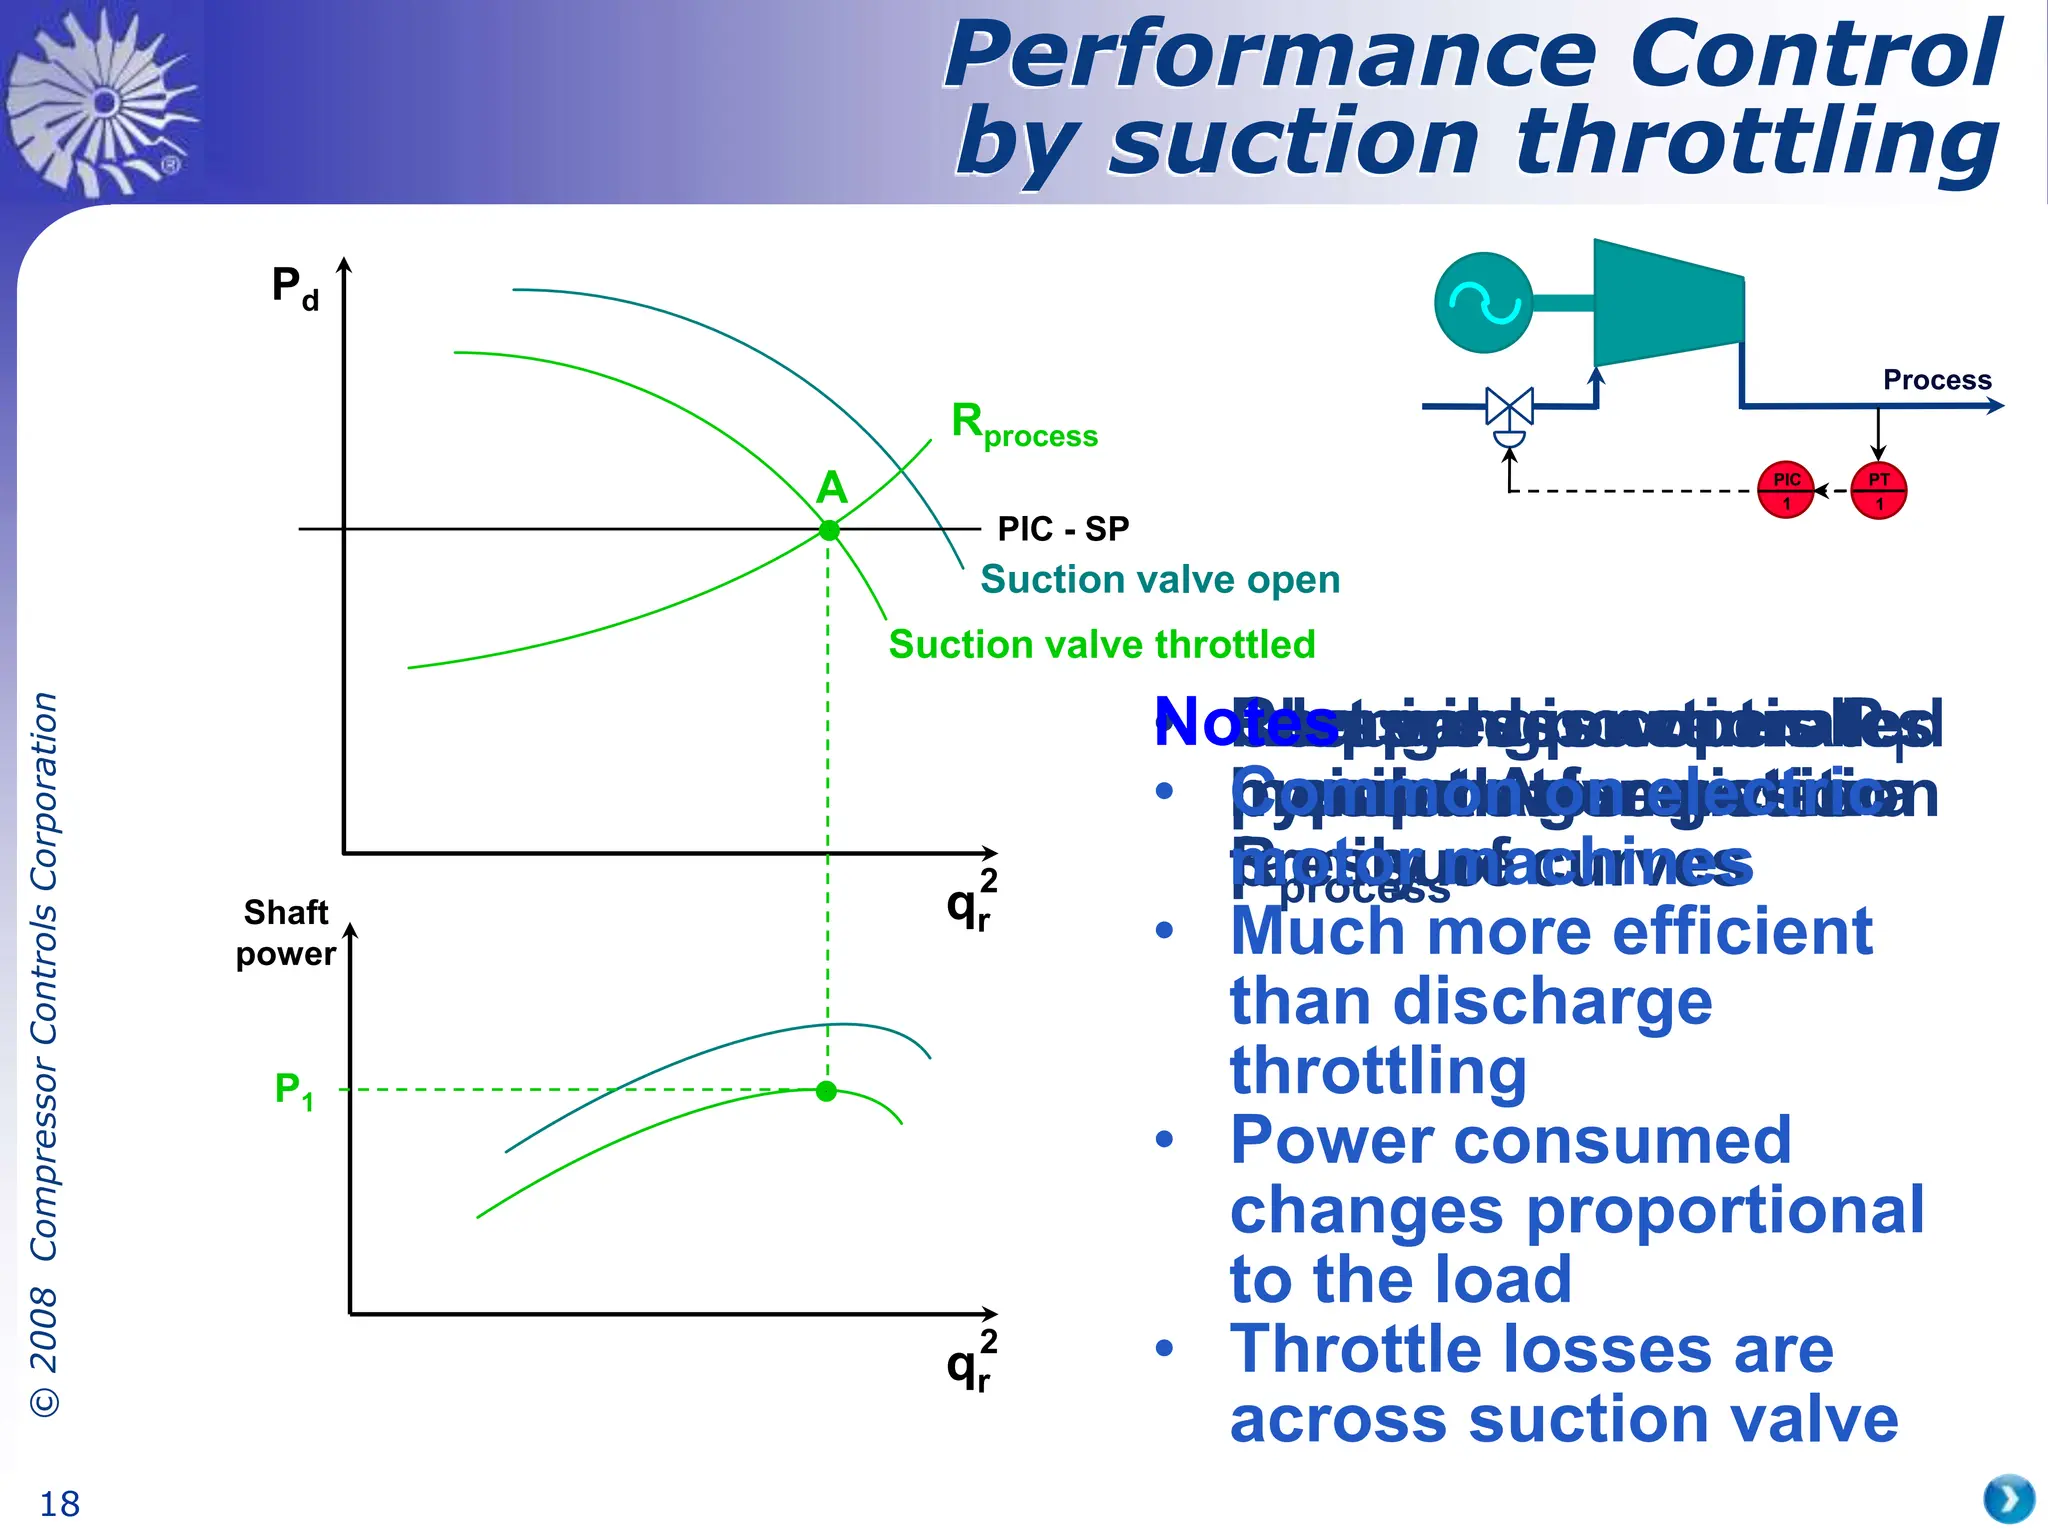
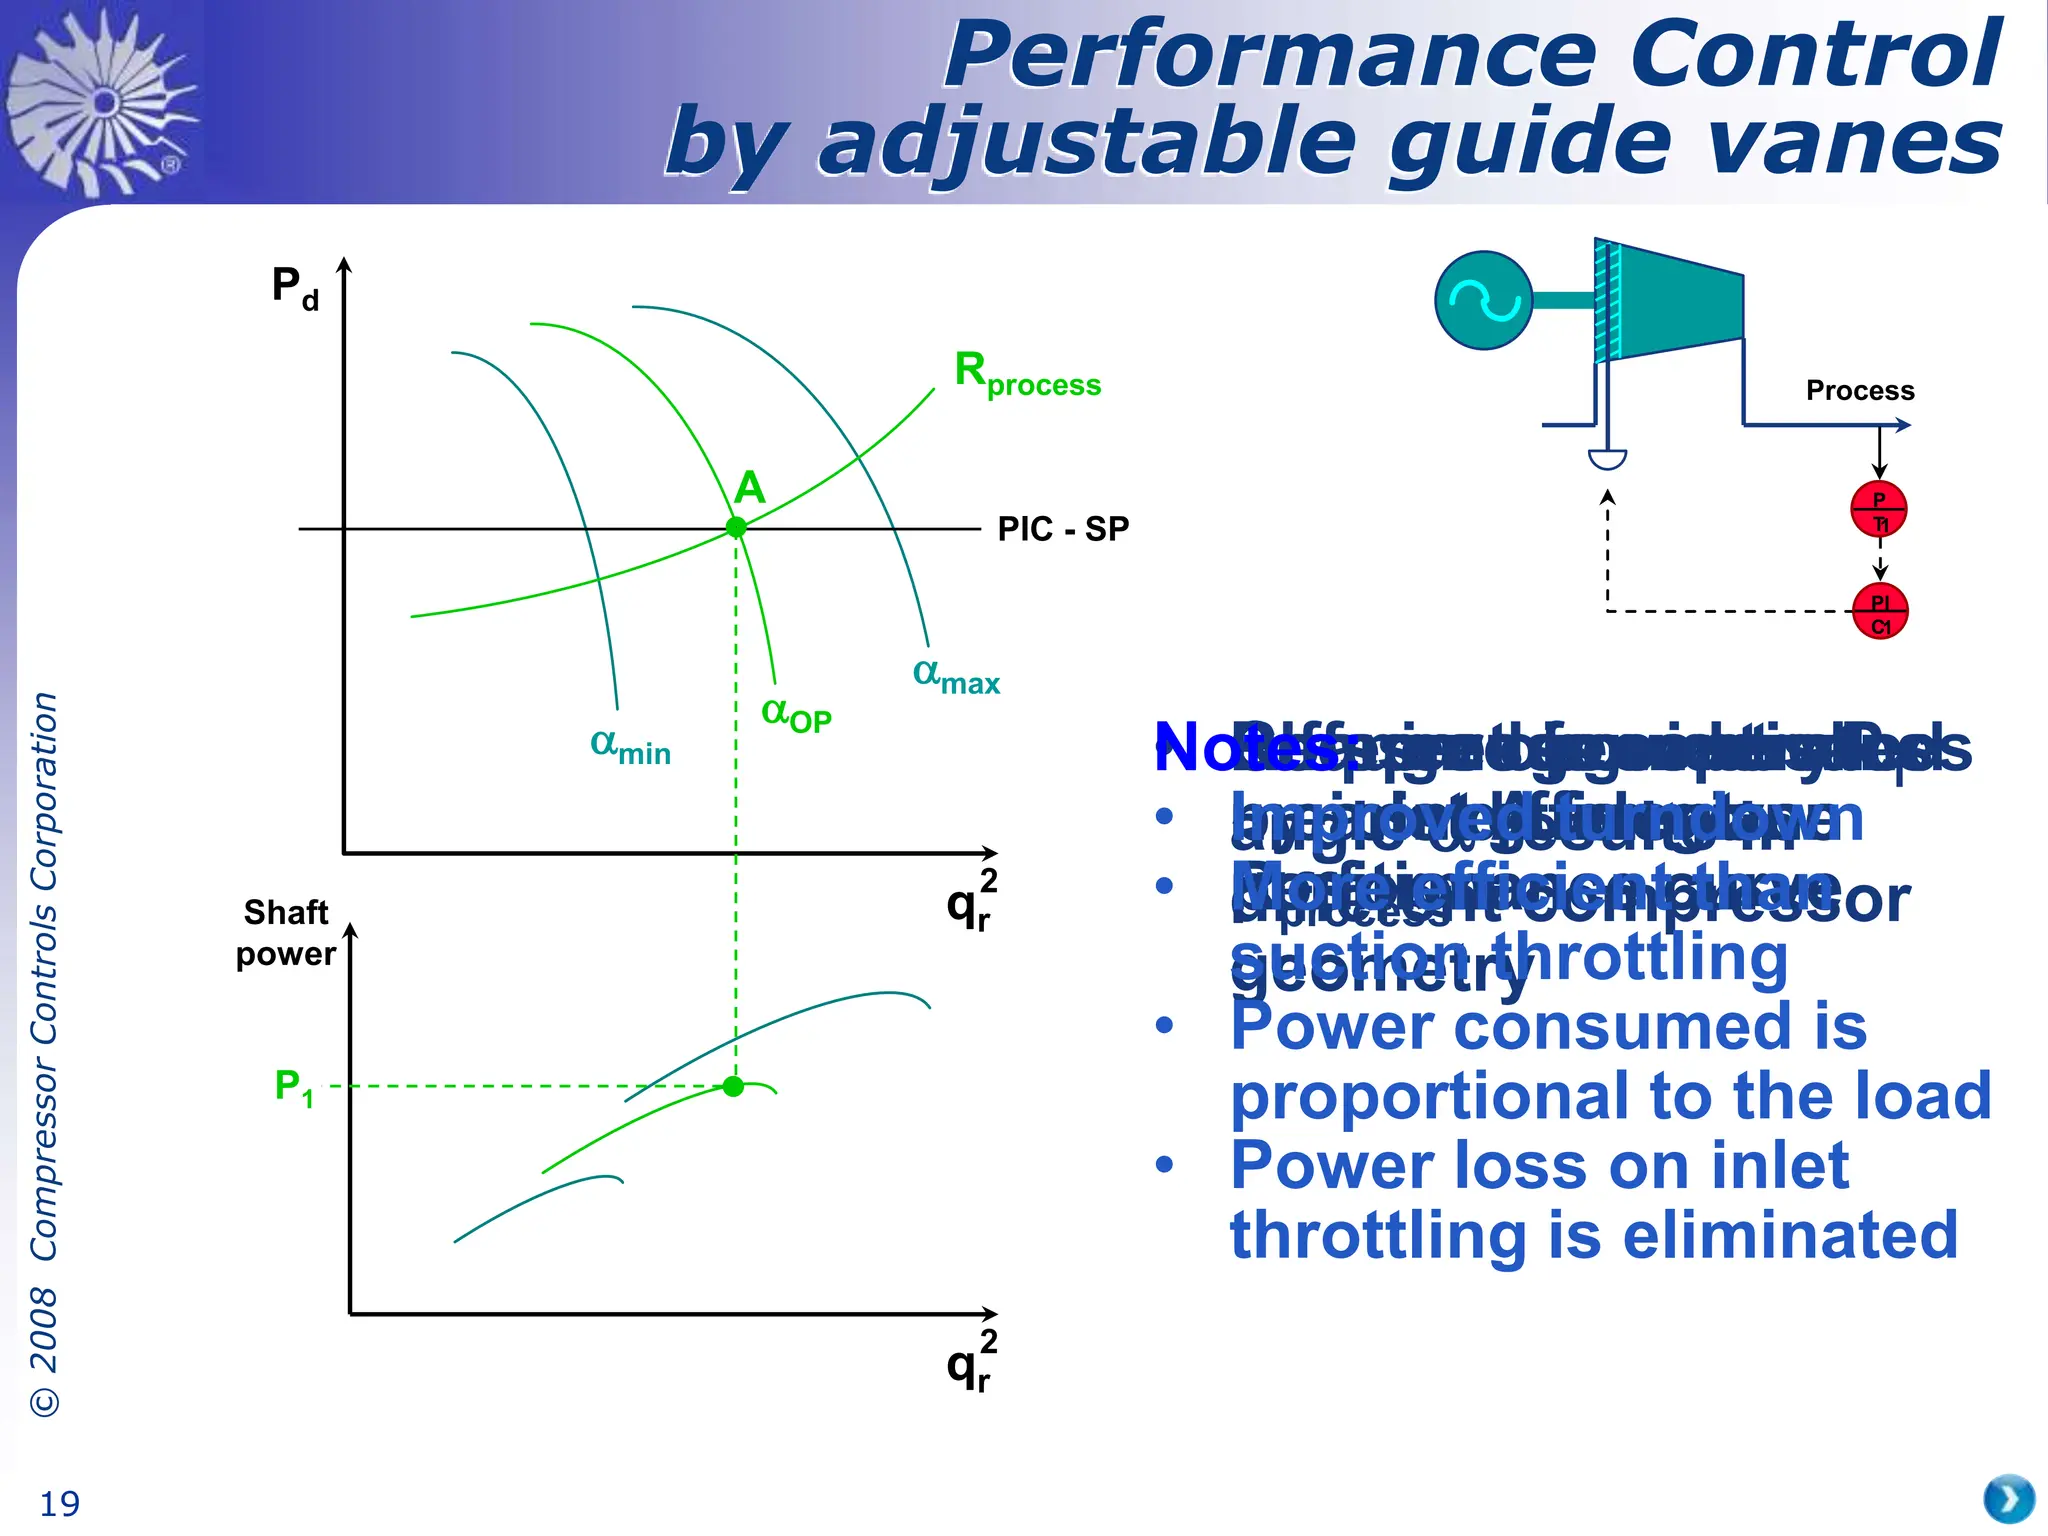
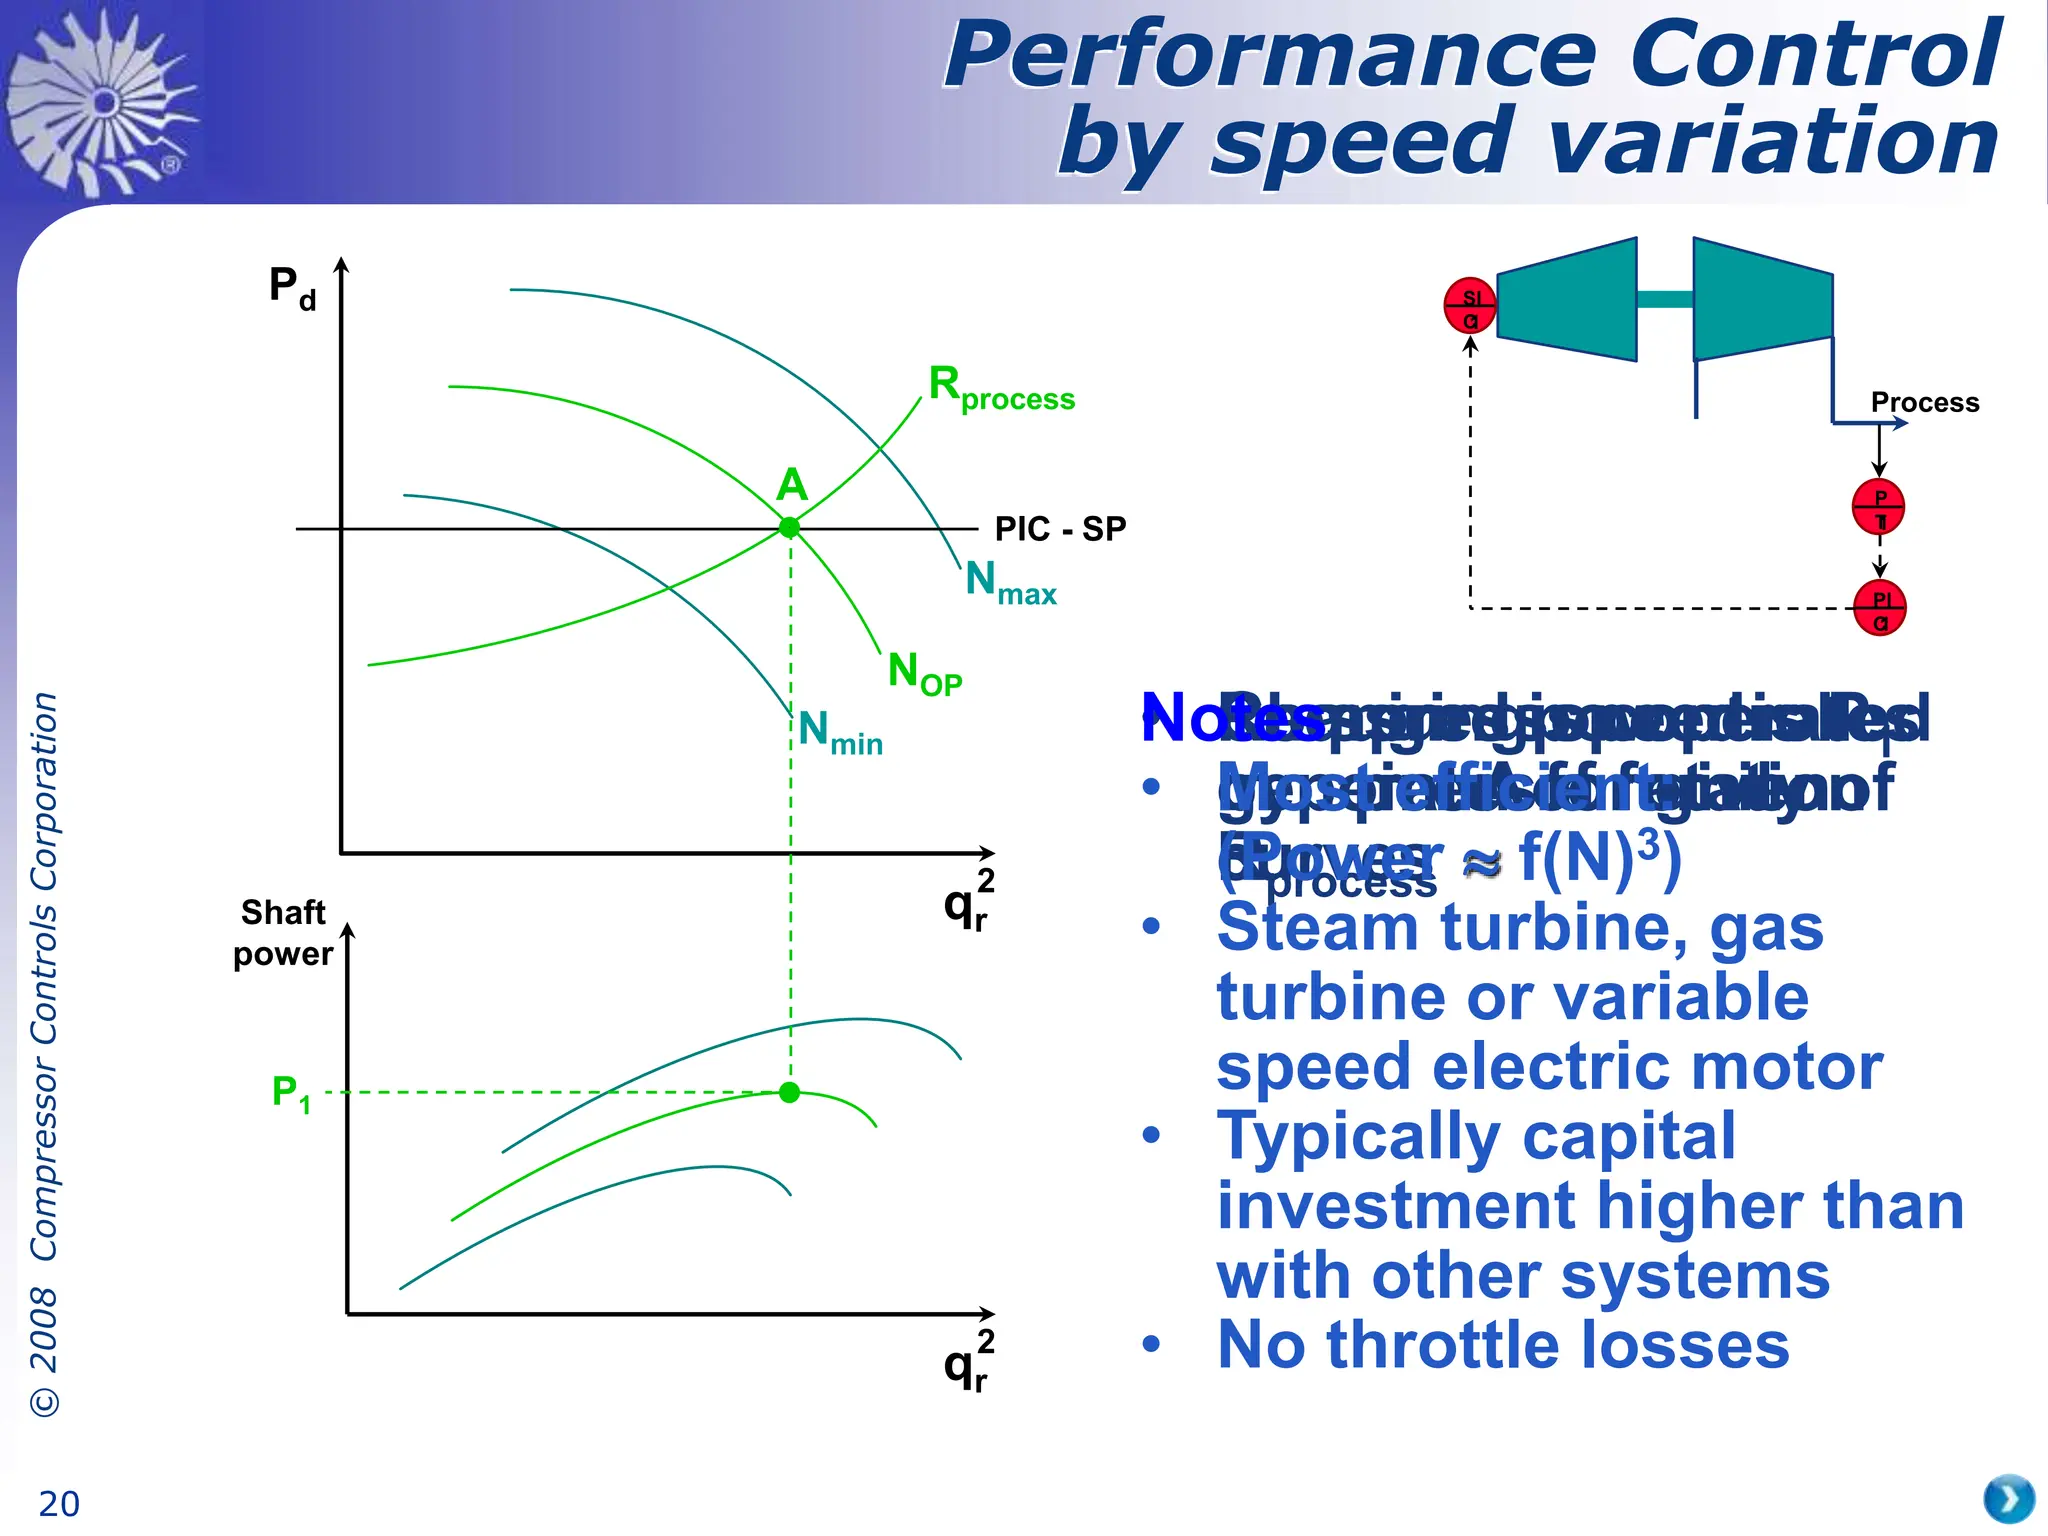
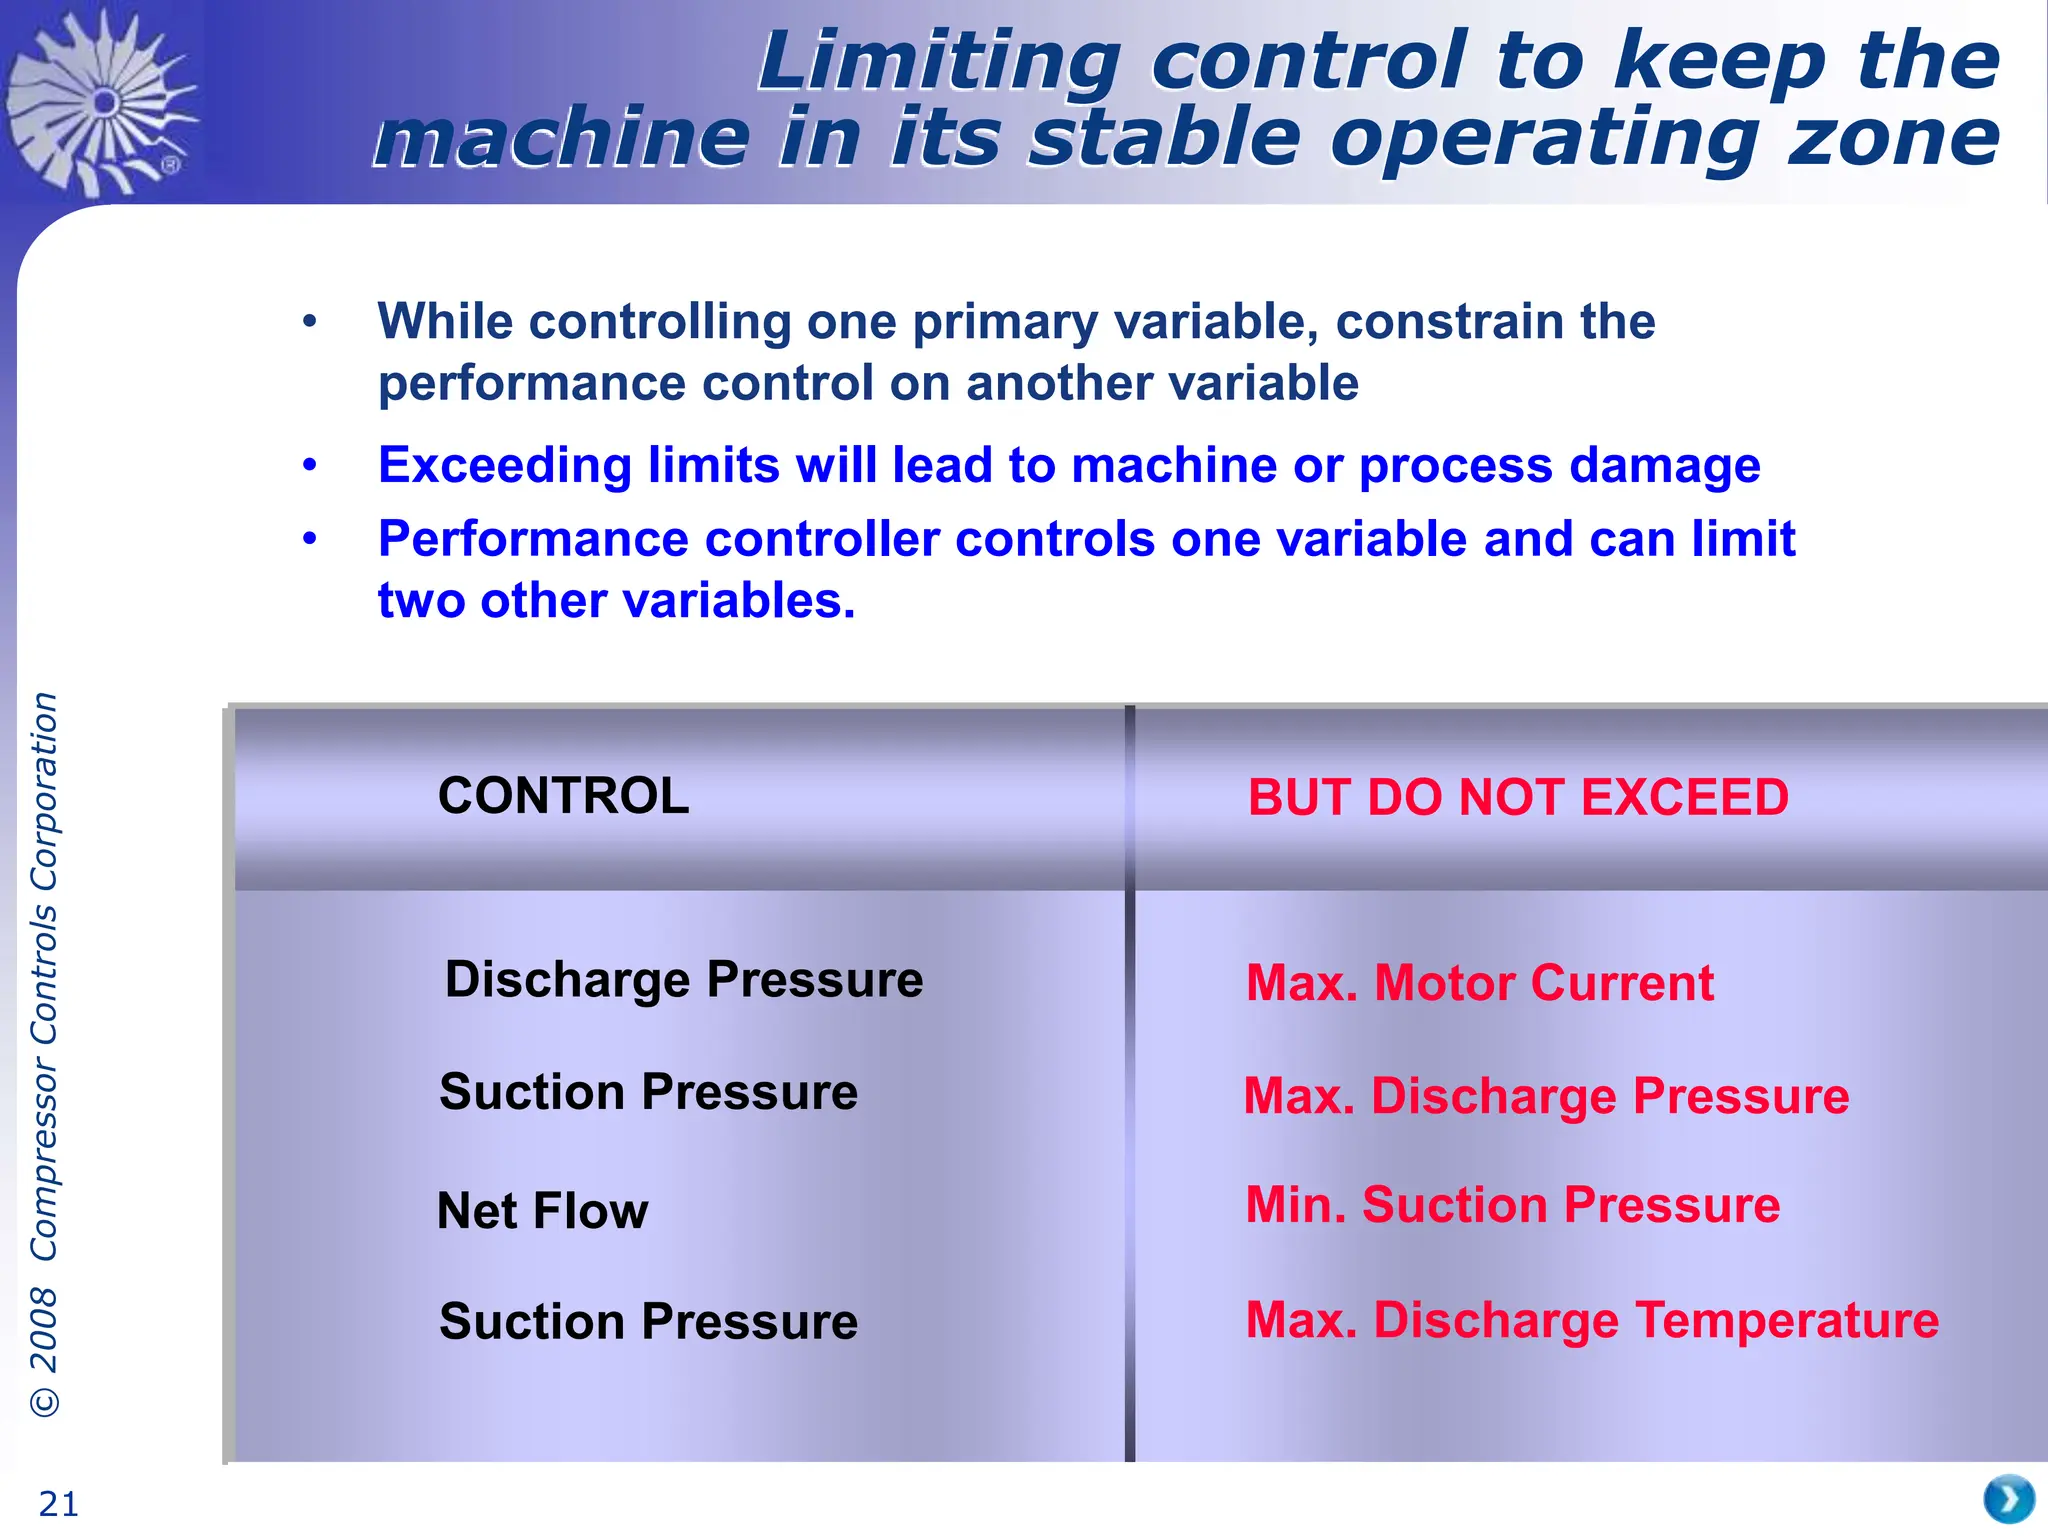
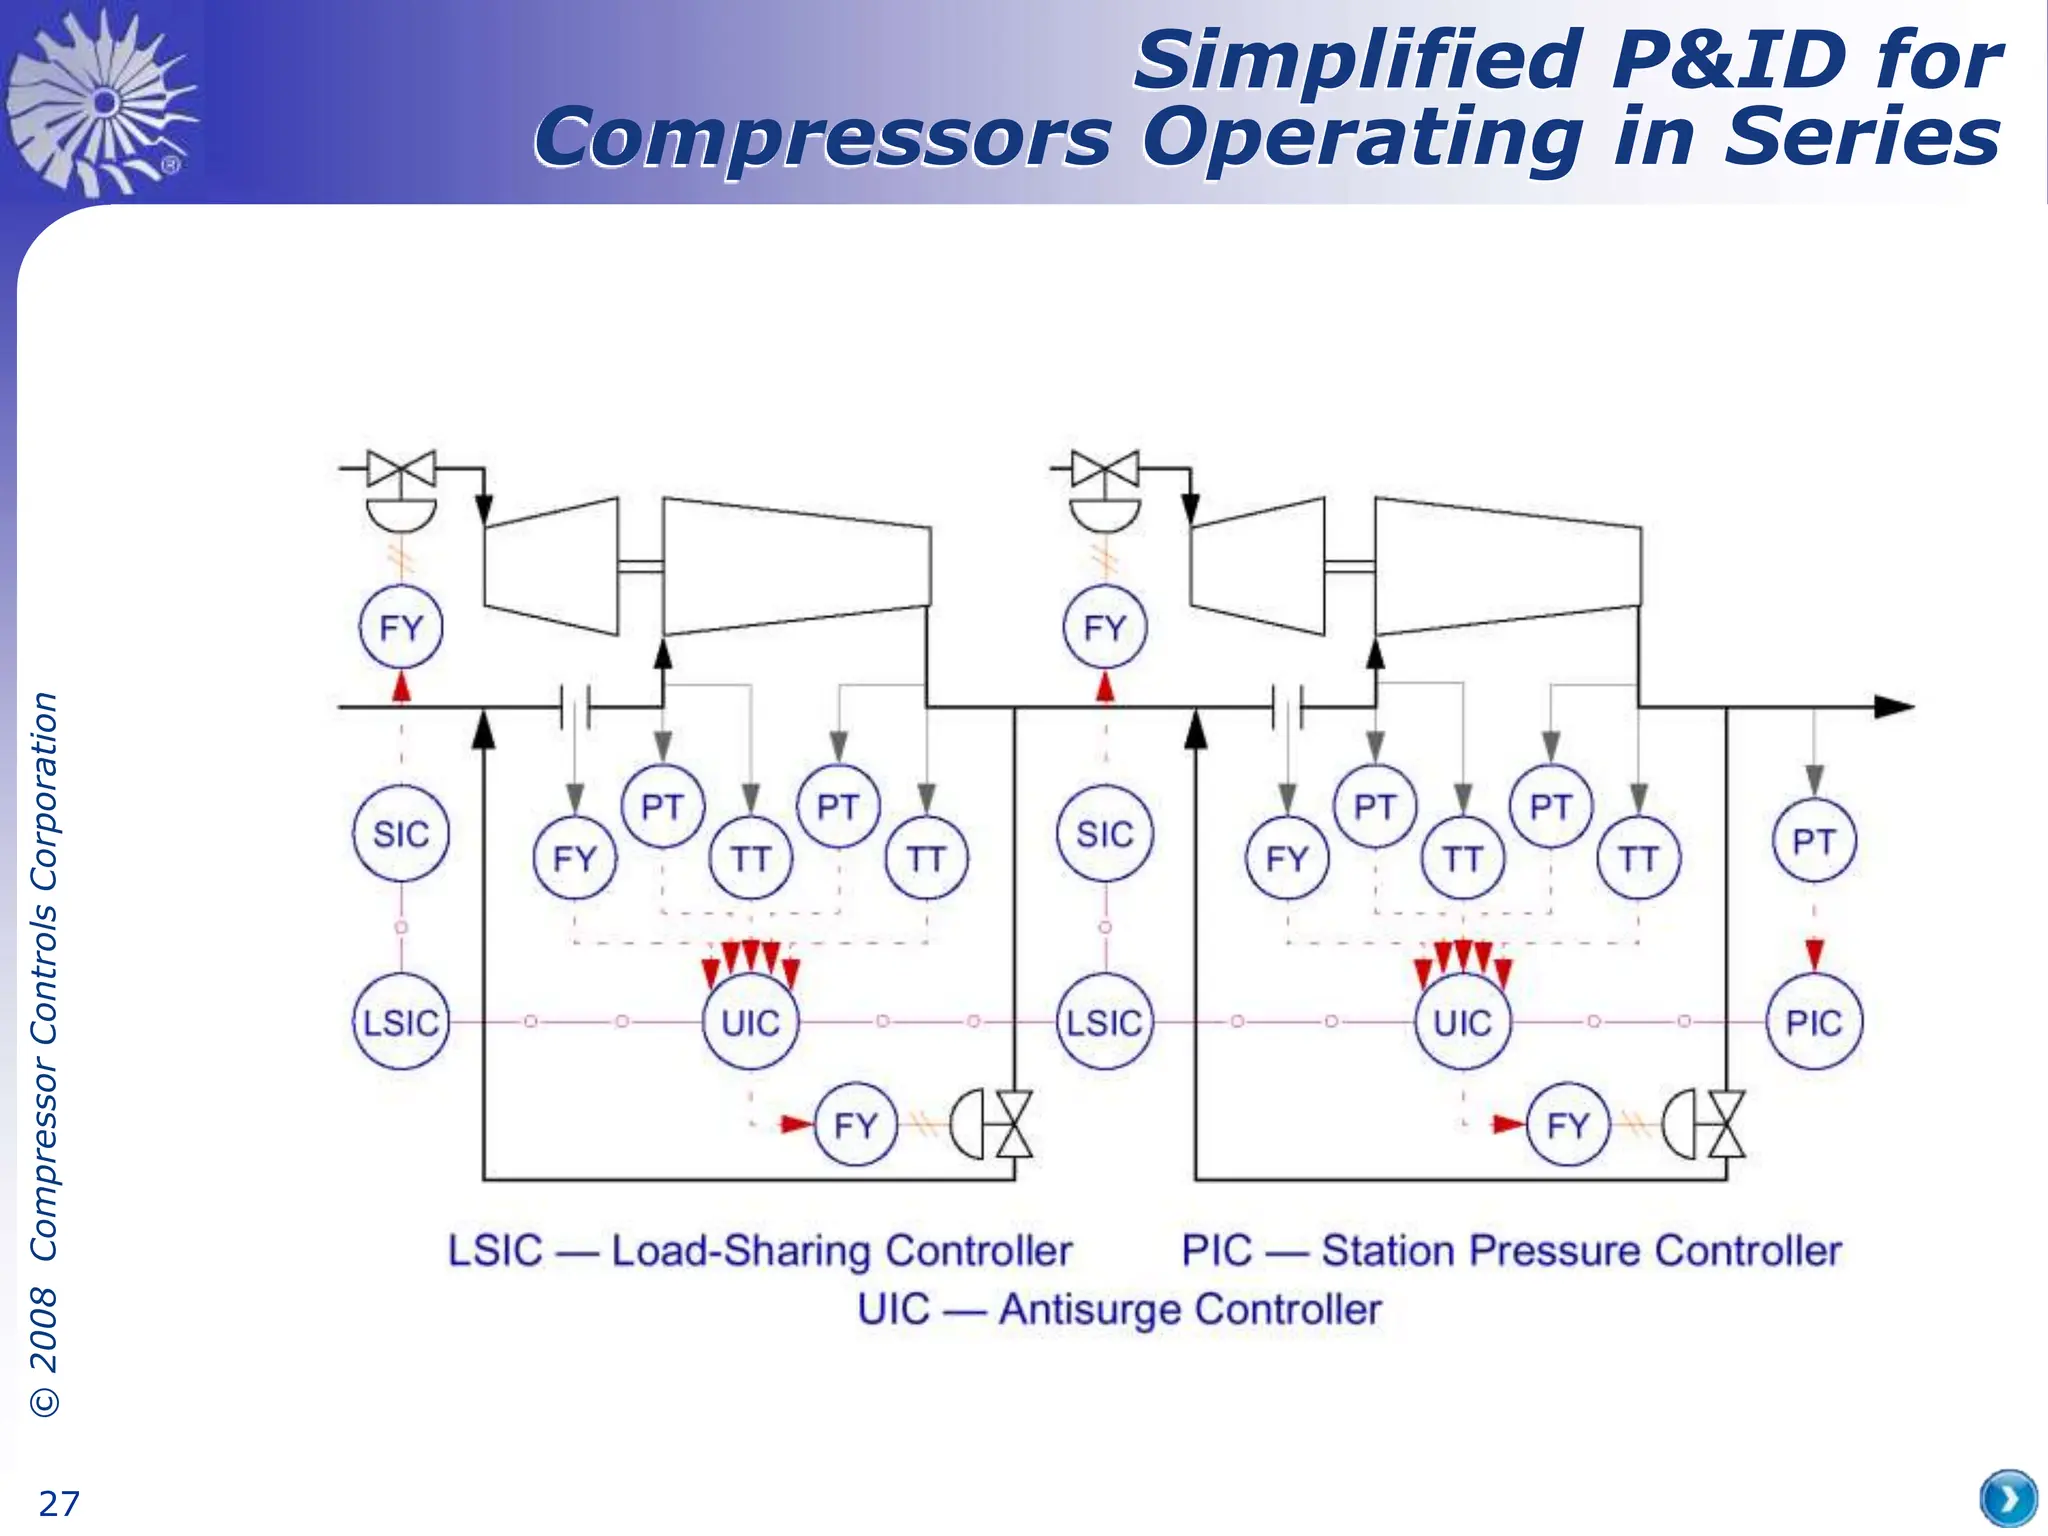
SlideShare a Scribd company logo
1 of 27
©
2008
Compressor
Controls
Corporation
1
What is Surge?
©
2008
Compressor
Controls
Corporation
2
Stable zone
of operation
Developing the compressor curve
Minimum speed
Power limit
Maximum speed
Process limit
Qs, vol
Adding control
margins
Stonewall or
choke limit
Surge limit
Rc
Actual available
operating zone
©
2008
Compressor
Controls
Corporation
3
• Flow reverses in 20 to 50 milliseconds
• Surge cycles at a rate of 0.3 s to 3 s
per cycle
• Compressor vibrates
• Temperature rises
• “Whooshing” noise
• Trips may occur
• Conventional instruments and human
operators may fail to recognize surge
Surge description
©
2008
Compressor
Controls
Corporation
4
Some surge consequences
• Unstable flow and pressure
• Damage in sequence with increasing
severity to seals, bearings, impellers,
shaft
• Increased seal clearances and
leakage
• Lower energy efficiency
• Reduced compressor life
©
2008
Compressor
Controls
Corporation
5
• From A to B…….20 - 50 ms…………….. Drop into surge
• From C to D…….20 - 120 ms…………… Jump out of surge
• A-B-C-D-A……….0.3 - 3 seconds……… Surge cycle
• Compressor reaches surge point A
• Compressor loses its ability to make
pressure
• Suddenly Pd drops and thus Pv > Pd
• Compressor surges -“Plane goes to stall”
Qs, vol
Pd
Machine shutdown
no flow, no pressure
• Electro motor is started
• Machine accelerates
to nominal speed
• Compressor reaches
performance curve
Note: Flow goes up faster
because pressure is the
integral of flow
• Pressure builds
• Resistance goes up
• Compressor “rides” the curve
• Pd = Pv + Rlosses
• Because Pv > Pd the flow reverses
• Compressor operating point goes to
point B
• Result of flow reversal is that pressure goes
down
• Pressure goes down => less negative flow
• Operating point goes to point C
• System pressure is going down
• Compressor is again able to
overcome Pv
• Compressor “jumps” back to
performance curve and goes to
point D
• Forward flow is re-established Pd = Compressor discharge pressure
Pv = Vessel pressure
Rlosses = Resistance losses over pipe
• Compressor starts to build pressure
• Compressor “rides” curve towards surge
• Point A is reached
• The surge cycle is complete
Developing the surge cycle on the
compressor curve
Pd
Pv
Rlosses
B A
C
D
©
2008
Compressor
Controls
Corporation
6
Factors leading to onset of surge
• Startup
• Shutdown
• Operation at reduced throughput
• Operation at heavy throughput with:
– Trips
– Power loss
– Operator errors
– Process upsets
– Load changes
– Gas composition changes
– Cooler problems
– Filter or strainer problems
– Driver problems
• Surge is not limited to times of reduced throughput.
• Surge can occur at full operation
©
2008
Compressor
Controls
Corporation
7
Antisurge
Control
©
2008
Compressor
Controls
Corporation
8
Surge parameter based on invariant
coordinates Rc and qr
– Flow measured in suction (DPo)
– Ps and Pd transmitters used to calculate Rc
• The antisurge controller UIC-1 protects the compressor
against surge by opening the recycle valve
1
UIC
VSDS
Compressor
1
FT
1
PsT
1
PdT
Discharge
Suction
• Opening of the recycle valve lowers the resistance felt by the
compressor
• This takes the compressor away from surge
Basic Antisurge Control System
2
Rc
qr
Rprocess
Rprocess+valve
©
2008
Compressor
Controls
Corporation
9
A
Rc
B
• When the operating
point crosses the SCL,
PI control will open the
recycle valve
• PI control will give
adequate protection
for small disturbances
SLL = Surge Limit Line
SCL = Surge Control Line
qr
2
Antisurge Controller Operation Protection #1
The Surge Control Line (SCL)
• PI control will give stable control during steady
state recycle operation
• Slow disturbance example
©
2008
Compressor
Controls
Corporation
10
Antisurge Controller Operation Protection #2
The Recycle Trip® Line (RTL)
Benefits:
– Energy savings due to
smaller surge margins
needed
– Compressor has more
turndown before
recycle or blow-off
– Surge can be
prevented for virtually
any disturbance
• Disturbance arrives - the
operating point moves
towards the SCL
SLL = Surge Limit Line
RTL= Recycle Trip® Line
SCL = Surge Control Line
Output
to Valve
Time
• When the operating point
reaches the SCL, the PI
controller opens the a/s
valve based on its
proportional and integral
action.
• The operating point
overshoots the SCL
until it reaches RTL
• When the operating
point hits RTL the
conclusion is:
– We are close to
surge
– The PI controller is
too slow to catch the
disturbance
– Move the valve now!
• An open loop response
is triggered
• Operating point moves
back to the safe side of
RTL
– The Open-loop
function should be
ramped out
– PI controller
integrates to stabilize
the operating point
on the SCL
Recycle Trip® Response
PI Control Response
• Total response of the
controller is the sum of
the PI control and the
Recycle Trip® action
PI Control
Recycle Trip®
Action
+
To antisurge valve
Total Response
Rc
Q
2
OP
©
2008
Compressor
Controls
Corporation
11
Additional surge margin
• Benefits of Safety On® response:
- Continuous surging is avoided
- Operators are alarmed about surge
• Compressor can
surge due to:
– Transmitter calibration
shift
– Sticky antisurge valve
or actuator
– Partially blocked
antisurge valve or
recycle line
– Unusually large
process upset
Antisurge Controller Operation Protection #3
The Safety On® Response (SOL)
• If Operating Point
crosses the Safety On®
Line the compressor is
in surge
Rc
qr
2
SLL - Surge Limit Line
RTL - Recycle Trip® Line
SCL - Surge Control Line
• The Safety On®
response shifts the
SCL and the RTL to
the right
New SCL
New RTL
• Additional safety or
surge margin is added
• PI control and
Recycle Trip® will
stabilize the machine
on the new SCL
SOL - Safety On® Line
©
2008
Compressor
Controls
Corporation
12
1
UIC
VSDS
Compressor
1
FT
1
PsT
1
PdT
• The antisurge controller can be configured to limit:
- Maximum discharge pressure (Pd)
- Minimum suction pressure (Ps)
- Both maximum Pd and minimum Ps
• This does NOT conflict with antisurge protection
Discharge
Suction
Limiting Ps or Pd using the
Antisurge Controller
©
2008
Compressor
Controls
Corporation
13
Disturbance comes from the
discharge side
• Pd,2 increases
• Ps,2 remains constant
• Rc,2 increases
• Section 2 moves towards surge
Disturbance
• The system is oscillating
• Slowing down the
controller tuning would
lead to:
- Increased risk of surge
• Compressor damage
• Process trips
- Bigger surge margins
• Energy waste
Interacting Antisurge Control Loops
Rc,2
qr,2
2
R
Rc,1
qr,1
2
R
R
R
Antisurge controller UIC-1 will
open the recycle valve to protect
section 1 against surge
• Pd,1 decreases
• Ps,1 increases
• Rc,1 decreases
• Section 1 moves away from surge
Opening of recycle valve on section 1
caused Pd,1 = Ps,2 to decrease
Result:
• Ps,2 decreases
• Pd,2 remains constant
• Rc,2 increases
• Section 2 moves towards surge
Antisurge controller UIC-2 will open
the recycle valve to protect section 2
against surge
• Pd,2 decreases
• Ps,2 increases
• Rc,2 decreases
• Section 2 moves away from surge
Opening of recycle valve on section 2
caused Ps,2 = Pd,1 to increase
Result:
• Pd,1 increases
• Ps,1 remains constant
• Rc,1 increases
• Section 1 moves towards surge
1
PIC
2
UIC
1
UIC
VSDS
Section 1 Section 2
©
2008
Compressor
Controls
Corporation
14
Performance
Control
©
2008
Compressor
Controls
Corporation
15
• Also called:
– Throughput control
– Capacity control
– Process control
• Matches the compressor throughput to the
load
• Can be based on controlling:
– Discharge pressure
– Suction pressure
– Net flow to the user
Compressor Performance Control
©
2008
Compressor
Controls
Corporation
16
PIC - SP
• Compressor operates in
point A
Pd
qr
2
Shaft
power
qr
2
Curve 1
A
Rprocess + Rvalve
• Required power in point
A is P1
Curve 1
P1
• Pressure is controlled by
blow-off
• Point B represents the point
that would deliver the
pressure for Rprocess
Curve 2
Rprocess
B
• Required power in point
B is P2
Curve 2
P2
• Power loss is P1 - P2
• Qloss represents energy
waste
Qloss
Notes:
• Most inefficient control
method
• Regularly found in plant air
systems
• Rare in other systems
• Not recommended
• Curve 2 represents:
• Lower speed on variable
speed systems
• IGVs closed on variable
geometry compressors
• Inlet throttle valve closed on
fixed speed compressors
Performance Control
by blow-off or recycle
PT
1
PIC
1
Process
©
2008
Compressor
Controls
Corporation
17
• Compressor operates
in point A
Pd
qr
2
Shaft
power
qr
2
Curve 1
A
Rprocess + Rvalve
• Required power is P1
Curve 1
P1
• Pressure is
controlled by
pressure drop over
valve
PIC - SP
Pressure loss
across valve
• Opening of valve
would reduce
resistance to Rprocess
Rprocess
• Lower resistance
would require less
speed and power
Curve 2
Curve 2
P2
• Power loss is P1 - P2
Notes:
• Extremely inefficient
(consumes approximately the
same power for every load)
• Rarely used
• Not recommended
• Curve 2 represents:
• Lower speed on variable
speed systems
• IGVs closed on variable
geometry compressors
• Inlet throttle valve closed on
fixed speed compressors
Performance Control
by discharge throttling
PT
1
PIC
1
Process
©
2008
Compressor
Controls
Corporation
18
• Inlet valve
manipulates suction
pressure
Pd
qr
2
Shaft
power
qr
2
• Changing suction
pressure generates a
family of curves
Suction valve open
Suction valve throttled
• Pressure is controlled
by inlet valve position
PIC - SP
• Compressor operates
in point A for given
Rprocess
A
Rprocess
• Required power is P1
P1
Notes
• Common on electric
motor machines
• Much more efficient
than discharge
throttling
• Power consumed
changes proportional
to the load
• Throttle losses are
across suction valve
Performance Control
by suction throttling
PT
1
PIC
1
Process
©
2008
Compressor
Controls
Corporation
19
• Change of guide vanes
angle a results in
different compressor
geometry
Pd
qr
2
Shaft
power
qr
2
• Different geometry
means different
performance curve
amin
aOP
amax
• Pressure is controlled
by inlet guide vane
position
PIC - SP
• Compressor operates
in point A for given
Rprocess
A
Rprocess
• Required power is P1
P1
P
T
1
PI
C1
Process
Notes:
• Improved turndown
• More efficient than
suction throttling
• Power consumed is
proportional to the load
• Power loss on inlet
throttling is eliminated
Performance Control
by adjustable guide vanes
©
2008
Compressor
Controls
Corporation
20
• Changing speed
generates a family of
curves
Pd
qr
2
Shaft
power
qr
2
Nmin
NOP
Nmax
• Pressure is controlled
by speed of rotation
PIC - SP
• Compressor operates
in point A for given
Rprocess
A
Rprocess
• Required power is P1
P1
P
T
1
PI
C
1
Process
SI
C
1
Notes
• Most efficient:
(Power  f(N)3)
• Steam turbine, gas
turbine or variable
speed electric motor
• Typically capital
investment higher than
with other systems
• No throttle losses
Performance Control
by speed variation
©
2008
Compressor
Controls
Corporation
21
• While controlling one primary variable, constrain the
performance control on another variable
• Exceeding limits will lead to machine or process damage
• Performance controller controls one variable and can limit
two other variables.
Limiting control to keep the
machine in its stable operating zone
CONTROL BUT DO NOT EXCEED
Discharge Pressure Max. Motor Current
Suction Pressure Max. Discharge Pressure
Net Flow Min. Suction Pressure
Suction Pressure Max. Discharge Temperature
©
2008
Compressor
Controls
Corporation
22
Loadsharing
Control
©
2008
Compressor
Controls
Corporation
23
Compressor networks
Control system objectives for
compressors in parallel:
• Maintain the primary performance variable
(pressure or flow)
• Optimally divide the load between the
compressors in the network, while:
– Minimizing risk of surge
– Minimizing energy consumption
– Minimizing disturbance of starting and stopping
individual compressors
• Compressors are often operated in parallel
and sometimes in series
©
2008
Compressor
Controls
Corporation
24
Compressor networks
• The purposes of networks include:
– Redundancy
– Flexibility
– Incremental capacity additions
• Often each compressor is controlled, but the
network is ignored
• Compressor manufacturers often focus on
individual machines.
• A “network view” of the application is
essential to achieve good surge protection
and good performance control of the
network.
©
2008
Compressor
Controls
Corporation
25
Notes
• All controllers are
coordinating
control responses
via a serial network
• Minimizes recycle
under all operating
conditions
Process
1
UIC
VSDS
Compressor 1
VSDS
Compressor 2
Suction
header
1
LSIC
2
UIC
out
RSP
Serial
network
out
RSP
2
LSIC
1
MPIC
Serial
network
Serial
network
Equidistant Loadsharing
Flow Diagram for Control Process
©
2008
Compressor
Controls
Corporation
26
• Machines operate at same Rc since suction and
discharge of both machines are tied together
PIC-SP
• The DEV is a dimensionless number
representing the distance between the
operating point and the Surge Control Line
• Lines of equal DEV can be plotted on the
performance curves as shown
0.1
0.2
0.3
DEV = 0
0.1
0.2
0.3
• Machines are kept at the same relative distance
to the Surge Control Line (SCL)
• This means in practice the same DEV for both
machines
DEV1 DEV2
• Recycle will only start when all machines are
on their SCL
• Since DEV is dimensionless all sorts of
machines can be mixed: small, big, axials,
centrifugals
• The DEV will be the same for all machines
but they will operate at different speeds and
flow rates
SCL = Surge Control Line
Rc,1
qr,1
2
Rc,2
qr,2
2
Compressor 1 Compressor 2
Dev1 = Dev2
Q1 = Q2
N1 = N2
Notes:
• Maximum turndown (energy savings) without recycle or blow-off
• Minimizes the risk of surge since all machines absorb part of the
disturbance
• Automatically adapts to different size machines
• CCC patented algorithm
Equidistant Loadsharing
Parallel Compressor Control
©
2008
Compressor
Controls
Corporation
27
Simplified P&ID for
Compressors Operating in Series

More Related Content

Similar to 9. What is surge-1.ppt Surging protection techniques

First fare 2010 pneumatics presentation
First fare 2010 pneumatics presentationFirst fare 2010 pneumatics presentation
First fare 2010 pneumatics presentation
Oregon FIRST Robotics
 
2- VCRSvcrs vapour compression refrigeration sustem.ppt
2- VCRSvcrs vapour compression refrigeration sustem.ppt2- VCRSvcrs vapour compression refrigeration sustem.ppt
2- VCRSvcrs vapour compression refrigeration sustem.ppt
SHIVAMSOMANI10
 

Similar to 9. What is surge-1.ppt Surging protection techniques (20)

Compressor fundamentals
Compressor fundamentalsCompressor fundamentals
Compressor fundamentals
 
Sample Question and answer for power plants
Sample Question and answer for power plantsSample Question and answer for power plants
Sample Question and answer for power plants
 
Presentation on Meter Regulating Skid(MRS)
Presentation on Meter Regulating Skid(MRS)Presentation on Meter Regulating Skid(MRS)
Presentation on Meter Regulating Skid(MRS)
 
Presentation on mrs
Presentation on mrsPresentation on mrs
Presentation on mrs
 
Thermopack ppt
Thermopack pptThermopack ppt
Thermopack ppt
 
Psv scenario-and-calculation
Psv scenario-and-calculationPsv scenario-and-calculation
Psv scenario-and-calculation
 
Retrocommissioning Works
Retrocommissioning WorksRetrocommissioning Works
Retrocommissioning Works
 
First fare 2010 pneumatics presentation
First fare 2010 pneumatics presentationFirst fare 2010 pneumatics presentation
First fare 2010 pneumatics presentation
 
Hvac - presentation (Air conditioning presentation)
Hvac - presentation (Air conditioning presentation) Hvac - presentation (Air conditioning presentation)
Hvac - presentation (Air conditioning presentation)
 
PID Control of Runaway Processes - Greg McMillan Deminar
PID Control of Runaway Processes - Greg McMillan DeminarPID Control of Runaway Processes - Greg McMillan Deminar
PID Control of Runaway Processes - Greg McMillan Deminar
 
compressor Operation pdf.pdf
compressor Operation pdf.pdfcompressor Operation pdf.pdf
compressor Operation pdf.pdf
 
Compressor operation.pdf
Compressor operation.pdfCompressor operation.pdf
Compressor operation.pdf
 
PSV DETAILS.pdf
PSV DETAILS.pdfPSV DETAILS.pdf
PSV DETAILS.pdf
 
Pressure Relief valve sizing and design
Pressure Relief valve sizing and designPressure Relief valve sizing and design
Pressure Relief valve sizing and design
 
PSV Calculation and Philosophy.pdf
PSV Calculation and Philosophy.pdfPSV Calculation and Philosophy.pdf
PSV Calculation and Philosophy.pdf
 
Compressors
CompressorsCompressors
Compressors
 
Palestra Dietrich warmbier
Palestra Dietrich warmbierPalestra Dietrich warmbier
Palestra Dietrich warmbier
 
Optimum overhaul of pumps 2014
Optimum overhaul of pumps 2014Optimum overhaul of pumps 2014
Optimum overhaul of pumps 2014
 
2- VCRSvcrs vapour compression refrigeration sustem.ppt
2- VCRSvcrs vapour compression refrigeration sustem.ppt2- VCRSvcrs vapour compression refrigeration sustem.ppt
2- VCRSvcrs vapour compression refrigeration sustem.ppt
 
Compressor
CompressorCompressor
Compressor
 

Recently uploaded

01-vogelsanger-stanag-4178-ed-2-the-new-nato-standard-for-nitrocellulose-test...
01-vogelsanger-stanag-4178-ed-2-the-new-nato-standard-for-nitrocellulose-test...01-vogelsanger-stanag-4178-ed-2-the-new-nato-standard-for-nitrocellulose-test...
01-vogelsanger-stanag-4178-ed-2-the-new-nato-standard-for-nitrocellulose-test...
AshwaniAnuragi1
 

Recently uploaded (20)

Presentation on Slab, Beam, Column, and Foundation/Footing
Presentation on Slab,  Beam, Column, and Foundation/FootingPresentation on Slab,  Beam, Column, and Foundation/Footing
Presentation on Slab, Beam, Column, and Foundation/Footing
 
01-vogelsanger-stanag-4178-ed-2-the-new-nato-standard-for-nitrocellulose-test...
01-vogelsanger-stanag-4178-ed-2-the-new-nato-standard-for-nitrocellulose-test...01-vogelsanger-stanag-4178-ed-2-the-new-nato-standard-for-nitrocellulose-test...
01-vogelsanger-stanag-4178-ed-2-the-new-nato-standard-for-nitrocellulose-test...
 
litvinenko_Henry_Intrusion_Hong-Kong_2024.pdf
litvinenko_Henry_Intrusion_Hong-Kong_2024.pdflitvinenko_Henry_Intrusion_Hong-Kong_2024.pdf
litvinenko_Henry_Intrusion_Hong-Kong_2024.pdf
 
Geometric constructions Engineering Drawing.pdf
Geometric constructions Engineering Drawing.pdfGeometric constructions Engineering Drawing.pdf
Geometric constructions Engineering Drawing.pdf
 
Databricks Generative AI Fundamentals .pdf
Databricks Generative AI Fundamentals  .pdfDatabricks Generative AI Fundamentals  .pdf
Databricks Generative AI Fundamentals .pdf
 
Filters for Electromagnetic Compatibility Applications
Filters for Electromagnetic Compatibility ApplicationsFilters for Electromagnetic Compatibility Applications
Filters for Electromagnetic Compatibility Applications
 
Involute of a circle,Square, pentagon,HexagonInvolute_Engineering Drawing.pdf
Involute of a circle,Square, pentagon,HexagonInvolute_Engineering Drawing.pdfInvolute of a circle,Square, pentagon,HexagonInvolute_Engineering Drawing.pdf
Involute of a circle,Square, pentagon,HexagonInvolute_Engineering Drawing.pdf
 
Databricks Generative AI FoundationCertified.pdf
Databricks Generative AI FoundationCertified.pdfDatabricks Generative AI FoundationCertified.pdf
Databricks Generative AI FoundationCertified.pdf
 
DBMS-Report on Student management system.pptx
DBMS-Report on Student management system.pptxDBMS-Report on Student management system.pptx
DBMS-Report on Student management system.pptx
 
Developing a smart system for infant incubators using the internet of things ...
Developing a smart system for infant incubators using the internet of things ...Developing a smart system for infant incubators using the internet of things ...
Developing a smart system for infant incubators using the internet of things ...
 
analog-vs-digital-communication (concept of analog and digital).pptx
analog-vs-digital-communication (concept of analog and digital).pptxanalog-vs-digital-communication (concept of analog and digital).pptx
analog-vs-digital-communication (concept of analog and digital).pptx
 
NO1 Best Powerful Vashikaran Specialist Baba Vashikaran Specialist For Love V...
NO1 Best Powerful Vashikaran Specialist Baba Vashikaran Specialist For Love V...NO1 Best Powerful Vashikaran Specialist Baba Vashikaran Specialist For Love V...
NO1 Best Powerful Vashikaran Specialist Baba Vashikaran Specialist For Love V...
 
History of Indian Railways - the story of Growth & Modernization
History of Indian Railways - the story of Growth & ModernizationHistory of Indian Railways - the story of Growth & Modernization
History of Indian Railways - the story of Growth & Modernization
 
Augmented Reality (AR) with Augin Software.pptx
Augmented Reality (AR) with Augin Software.pptxAugmented Reality (AR) with Augin Software.pptx
Augmented Reality (AR) with Augin Software.pptx
 
NEWLETTER FRANCE HELICES/ SDS SURFACE DRIVES - MAY 2024
NEWLETTER FRANCE HELICES/ SDS SURFACE DRIVES - MAY 2024NEWLETTER FRANCE HELICES/ SDS SURFACE DRIVES - MAY 2024
NEWLETTER FRANCE HELICES/ SDS SURFACE DRIVES - MAY 2024
 
Circuit Breakers for Engineering Students
Circuit Breakers for Engineering StudentsCircuit Breakers for Engineering Students
Circuit Breakers for Engineering Students
 
Basics of Relay for Engineering Students
Basics of Relay for Engineering StudentsBasics of Relay for Engineering Students
Basics of Relay for Engineering Students
 
Maximizing Incident Investigation Efficacy in Oil & Gas: Techniques and Tools
Maximizing Incident Investigation Efficacy in Oil & Gas: Techniques and ToolsMaximizing Incident Investigation Efficacy in Oil & Gas: Techniques and Tools
Maximizing Incident Investigation Efficacy in Oil & Gas: Techniques and Tools
 
8th International Conference on Soft Computing, Mathematics and Control (SMC ...
8th International Conference on Soft Computing, Mathematics and Control (SMC ...8th International Conference on Soft Computing, Mathematics and Control (SMC ...
8th International Conference on Soft Computing, Mathematics and Control (SMC ...
 
Call for Papers - Journal of Electrical Systems (JES), E-ISSN: 1112-5209, ind...
Call for Papers - Journal of Electrical Systems (JES), E-ISSN: 1112-5209, ind...Call for Papers - Journal of Electrical Systems (JES), E-ISSN: 1112-5209, ind...
Call for Papers - Journal of Electrical Systems (JES), E-ISSN: 1112-5209, ind...
 

9. What is surge-1.ppt Surging protection techniques

  • 2. © 2008 Compressor Controls Corporation 2 Stable zone of operation Developing the compressor curve Minimum speed Power limit Maximum speed Process limit Qs, vol Adding control margins Stonewall or choke limit Surge limit Rc Actual available operating zone
  • 3. © 2008 Compressor Controls Corporation 3 • Flow reverses in 20 to 50 milliseconds • Surge cycles at a rate of 0.3 s to 3 s per cycle • Compressor vibrates • Temperature rises • “Whooshing” noise • Trips may occur • Conventional instruments and human operators may fail to recognize surge Surge description
  • 4. © 2008 Compressor Controls Corporation 4 Some surge consequences • Unstable flow and pressure • Damage in sequence with increasing severity to seals, bearings, impellers, shaft • Increased seal clearances and leakage • Lower energy efficiency • Reduced compressor life
  • 5. © 2008 Compressor Controls Corporation 5 • From A to B…….20 - 50 ms…………….. Drop into surge • From C to D…….20 - 120 ms…………… Jump out of surge • A-B-C-D-A……….0.3 - 3 seconds……… Surge cycle • Compressor reaches surge point A • Compressor loses its ability to make pressure • Suddenly Pd drops and thus Pv > Pd • Compressor surges -“Plane goes to stall” Qs, vol Pd Machine shutdown no flow, no pressure • Electro motor is started • Machine accelerates to nominal speed • Compressor reaches performance curve Note: Flow goes up faster because pressure is the integral of flow • Pressure builds • Resistance goes up • Compressor “rides” the curve • Pd = Pv + Rlosses • Because Pv > Pd the flow reverses • Compressor operating point goes to point B • Result of flow reversal is that pressure goes down • Pressure goes down => less negative flow • Operating point goes to point C • System pressure is going down • Compressor is again able to overcome Pv • Compressor “jumps” back to performance curve and goes to point D • Forward flow is re-established Pd = Compressor discharge pressure Pv = Vessel pressure Rlosses = Resistance losses over pipe • Compressor starts to build pressure • Compressor “rides” curve towards surge • Point A is reached • The surge cycle is complete Developing the surge cycle on the compressor curve Pd Pv Rlosses B A C D
  • 6. © 2008 Compressor Controls Corporation 6 Factors leading to onset of surge • Startup • Shutdown • Operation at reduced throughput • Operation at heavy throughput with: – Trips – Power loss – Operator errors – Process upsets – Load changes – Gas composition changes – Cooler problems – Filter or strainer problems – Driver problems • Surge is not limited to times of reduced throughput. • Surge can occur at full operation
  • 8. © 2008 Compressor Controls Corporation 8 Surge parameter based on invariant coordinates Rc and qr – Flow measured in suction (DPo) – Ps and Pd transmitters used to calculate Rc • The antisurge controller UIC-1 protects the compressor against surge by opening the recycle valve 1 UIC VSDS Compressor 1 FT 1 PsT 1 PdT Discharge Suction • Opening of the recycle valve lowers the resistance felt by the compressor • This takes the compressor away from surge Basic Antisurge Control System 2 Rc qr Rprocess Rprocess+valve
  • 9. © 2008 Compressor Controls Corporation 9 A Rc B • When the operating point crosses the SCL, PI control will open the recycle valve • PI control will give adequate protection for small disturbances SLL = Surge Limit Line SCL = Surge Control Line qr 2 Antisurge Controller Operation Protection #1 The Surge Control Line (SCL) • PI control will give stable control during steady state recycle operation • Slow disturbance example
  • 10. © 2008 Compressor Controls Corporation 10 Antisurge Controller Operation Protection #2 The Recycle Trip® Line (RTL) Benefits: – Energy savings due to smaller surge margins needed – Compressor has more turndown before recycle or blow-off – Surge can be prevented for virtually any disturbance • Disturbance arrives - the operating point moves towards the SCL SLL = Surge Limit Line RTL= Recycle Trip® Line SCL = Surge Control Line Output to Valve Time • When the operating point reaches the SCL, the PI controller opens the a/s valve based on its proportional and integral action. • The operating point overshoots the SCL until it reaches RTL • When the operating point hits RTL the conclusion is: – We are close to surge – The PI controller is too slow to catch the disturbance – Move the valve now! • An open loop response is triggered • Operating point moves back to the safe side of RTL – The Open-loop function should be ramped out – PI controller integrates to stabilize the operating point on the SCL Recycle Trip® Response PI Control Response • Total response of the controller is the sum of the PI control and the Recycle Trip® action PI Control Recycle Trip® Action + To antisurge valve Total Response Rc Q 2 OP
  • 11. © 2008 Compressor Controls Corporation 11 Additional surge margin • Benefits of Safety On® response: - Continuous surging is avoided - Operators are alarmed about surge • Compressor can surge due to: – Transmitter calibration shift – Sticky antisurge valve or actuator – Partially blocked antisurge valve or recycle line – Unusually large process upset Antisurge Controller Operation Protection #3 The Safety On® Response (SOL) • If Operating Point crosses the Safety On® Line the compressor is in surge Rc qr 2 SLL - Surge Limit Line RTL - Recycle Trip® Line SCL - Surge Control Line • The Safety On® response shifts the SCL and the RTL to the right New SCL New RTL • Additional safety or surge margin is added • PI control and Recycle Trip® will stabilize the machine on the new SCL SOL - Safety On® Line
  • 12. © 2008 Compressor Controls Corporation 12 1 UIC VSDS Compressor 1 FT 1 PsT 1 PdT • The antisurge controller can be configured to limit: - Maximum discharge pressure (Pd) - Minimum suction pressure (Ps) - Both maximum Pd and minimum Ps • This does NOT conflict with antisurge protection Discharge Suction Limiting Ps or Pd using the Antisurge Controller
  • 13. © 2008 Compressor Controls Corporation 13 Disturbance comes from the discharge side • Pd,2 increases • Ps,2 remains constant • Rc,2 increases • Section 2 moves towards surge Disturbance • The system is oscillating • Slowing down the controller tuning would lead to: - Increased risk of surge • Compressor damage • Process trips - Bigger surge margins • Energy waste Interacting Antisurge Control Loops Rc,2 qr,2 2 R Rc,1 qr,1 2 R R R Antisurge controller UIC-1 will open the recycle valve to protect section 1 against surge • Pd,1 decreases • Ps,1 increases • Rc,1 decreases • Section 1 moves away from surge Opening of recycle valve on section 1 caused Pd,1 = Ps,2 to decrease Result: • Ps,2 decreases • Pd,2 remains constant • Rc,2 increases • Section 2 moves towards surge Antisurge controller UIC-2 will open the recycle valve to protect section 2 against surge • Pd,2 decreases • Ps,2 increases • Rc,2 decreases • Section 2 moves away from surge Opening of recycle valve on section 2 caused Ps,2 = Pd,1 to increase Result: • Pd,1 increases • Ps,1 remains constant • Rc,1 increases • Section 1 moves towards surge 1 PIC 2 UIC 1 UIC VSDS Section 1 Section 2
  • 15. © 2008 Compressor Controls Corporation 15 • Also called: – Throughput control – Capacity control – Process control • Matches the compressor throughput to the load • Can be based on controlling: – Discharge pressure – Suction pressure – Net flow to the user Compressor Performance Control
  • 16. © 2008 Compressor Controls Corporation 16 PIC - SP • Compressor operates in point A Pd qr 2 Shaft power qr 2 Curve 1 A Rprocess + Rvalve • Required power in point A is P1 Curve 1 P1 • Pressure is controlled by blow-off • Point B represents the point that would deliver the pressure for Rprocess Curve 2 Rprocess B • Required power in point B is P2 Curve 2 P2 • Power loss is P1 - P2 • Qloss represents energy waste Qloss Notes: • Most inefficient control method • Regularly found in plant air systems • Rare in other systems • Not recommended • Curve 2 represents: • Lower speed on variable speed systems • IGVs closed on variable geometry compressors • Inlet throttle valve closed on fixed speed compressors Performance Control by blow-off or recycle PT 1 PIC 1 Process
  • 17. © 2008 Compressor Controls Corporation 17 • Compressor operates in point A Pd qr 2 Shaft power qr 2 Curve 1 A Rprocess + Rvalve • Required power is P1 Curve 1 P1 • Pressure is controlled by pressure drop over valve PIC - SP Pressure loss across valve • Opening of valve would reduce resistance to Rprocess Rprocess • Lower resistance would require less speed and power Curve 2 Curve 2 P2 • Power loss is P1 - P2 Notes: • Extremely inefficient (consumes approximately the same power for every load) • Rarely used • Not recommended • Curve 2 represents: • Lower speed on variable speed systems • IGVs closed on variable geometry compressors • Inlet throttle valve closed on fixed speed compressors Performance Control by discharge throttling PT 1 PIC 1 Process
  • 18. © 2008 Compressor Controls Corporation 18 • Inlet valve manipulates suction pressure Pd qr 2 Shaft power qr 2 • Changing suction pressure generates a family of curves Suction valve open Suction valve throttled • Pressure is controlled by inlet valve position PIC - SP • Compressor operates in point A for given Rprocess A Rprocess • Required power is P1 P1 Notes • Common on electric motor machines • Much more efficient than discharge throttling • Power consumed changes proportional to the load • Throttle losses are across suction valve Performance Control by suction throttling PT 1 PIC 1 Process
  • 19. © 2008 Compressor Controls Corporation 19 • Change of guide vanes angle a results in different compressor geometry Pd qr 2 Shaft power qr 2 • Different geometry means different performance curve amin aOP amax • Pressure is controlled by inlet guide vane position PIC - SP • Compressor operates in point A for given Rprocess A Rprocess • Required power is P1 P1 P T 1 PI C1 Process Notes: • Improved turndown • More efficient than suction throttling • Power consumed is proportional to the load • Power loss on inlet throttling is eliminated Performance Control by adjustable guide vanes
  • 20. © 2008 Compressor Controls Corporation 20 • Changing speed generates a family of curves Pd qr 2 Shaft power qr 2 Nmin NOP Nmax • Pressure is controlled by speed of rotation PIC - SP • Compressor operates in point A for given Rprocess A Rprocess • Required power is P1 P1 P T 1 PI C 1 Process SI C 1 Notes • Most efficient: (Power  f(N)3) • Steam turbine, gas turbine or variable speed electric motor • Typically capital investment higher than with other systems • No throttle losses Performance Control by speed variation
  • 21. © 2008 Compressor Controls Corporation 21 • While controlling one primary variable, constrain the performance control on another variable • Exceeding limits will lead to machine or process damage • Performance controller controls one variable and can limit two other variables. Limiting control to keep the machine in its stable operating zone CONTROL BUT DO NOT EXCEED Discharge Pressure Max. Motor Current Suction Pressure Max. Discharge Pressure Net Flow Min. Suction Pressure Suction Pressure Max. Discharge Temperature
  • 23. © 2008 Compressor Controls Corporation 23 Compressor networks Control system objectives for compressors in parallel: • Maintain the primary performance variable (pressure or flow) • Optimally divide the load between the compressors in the network, while: – Minimizing risk of surge – Minimizing energy consumption – Minimizing disturbance of starting and stopping individual compressors • Compressors are often operated in parallel and sometimes in series
  • 24. © 2008 Compressor Controls Corporation 24 Compressor networks • The purposes of networks include: – Redundancy – Flexibility – Incremental capacity additions • Often each compressor is controlled, but the network is ignored • Compressor manufacturers often focus on individual machines. • A “network view” of the application is essential to achieve good surge protection and good performance control of the network.
  • 25. © 2008 Compressor Controls Corporation 25 Notes • All controllers are coordinating control responses via a serial network • Minimizes recycle under all operating conditions Process 1 UIC VSDS Compressor 1 VSDS Compressor 2 Suction header 1 LSIC 2 UIC out RSP Serial network out RSP 2 LSIC 1 MPIC Serial network Serial network Equidistant Loadsharing Flow Diagram for Control Process
  • 26. © 2008 Compressor Controls Corporation 26 • Machines operate at same Rc since suction and discharge of both machines are tied together PIC-SP • The DEV is a dimensionless number representing the distance between the operating point and the Surge Control Line • Lines of equal DEV can be plotted on the performance curves as shown 0.1 0.2 0.3 DEV = 0 0.1 0.2 0.3 • Machines are kept at the same relative distance to the Surge Control Line (SCL) • This means in practice the same DEV for both machines DEV1 DEV2 • Recycle will only start when all machines are on their SCL • Since DEV is dimensionless all sorts of machines can be mixed: small, big, axials, centrifugals • The DEV will be the same for all machines but they will operate at different speeds and flow rates SCL = Surge Control Line Rc,1 qr,1 2 Rc,2 qr,2 2 Compressor 1 Compressor 2 Dev1 = Dev2 Q1 = Q2 N1 = N2 Notes: • Maximum turndown (energy savings) without recycle or blow-off • Minimizes the risk of surge since all machines absorb part of the disturbance • Automatically adapts to different size machines • CCC patented algorithm Equidistant Loadsharing Parallel Compressor Control

Editor's Notes

  1. 1
  2. 2
  3. 3
  4. 4
  5. 5
  6. 6
  7. 7
  8. 8
  9. 9
  10. 10
  11. 11
  12. 12
  13. 13
  14. 14
  15. 15
  16. 16
  17. 17
  18. 18
  19. 19
  20. 20
  21. 21
  22. 22
  23. 23
  24. 24
  25. 25
  26. 26
  27. 27