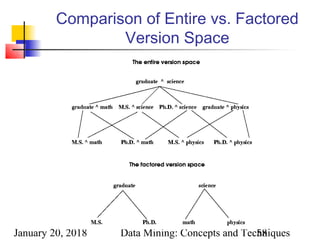
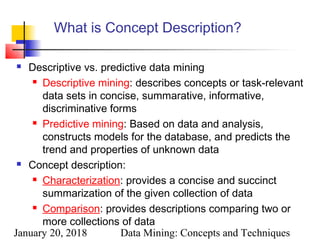
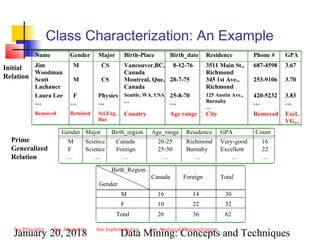
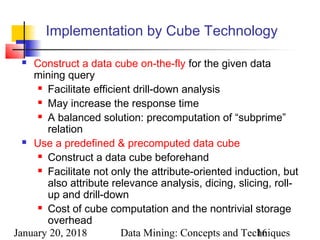
This document summarizes Chapter 5 of the textbook "Data Mining: Concepts and Techniques". It discusses concept description, which involves characterizing data through generalization, summarization, and comparison of different classes. Key aspects covered include data cube approaches to characterization, attribute-oriented induction for generalization, analytical characterization of attribute relevance, and presenting generalized results through cross-tabulation, visualization, and rules. Implementation can utilize pre-computed data cubes to enable efficient analysis operations like drill-down.
![January 20, 2018 Data Mining: Concepts and Techniques
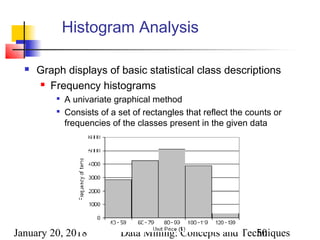
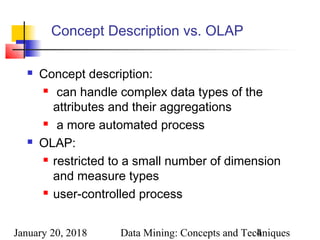
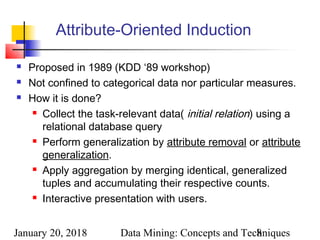
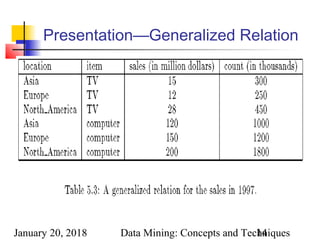
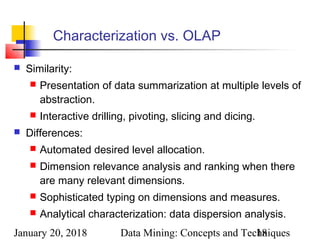
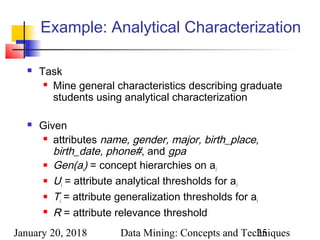
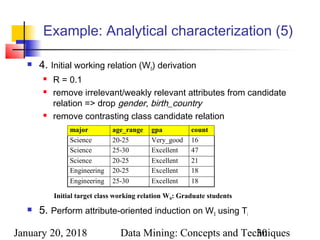
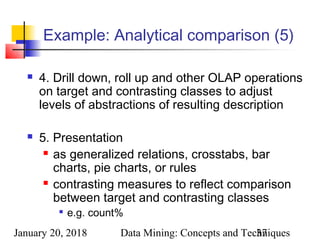
Presentation of Generalized Results
Generalized relation:
Relations where some or all attributes are generalized, with counts
or other aggregation values accumulated.
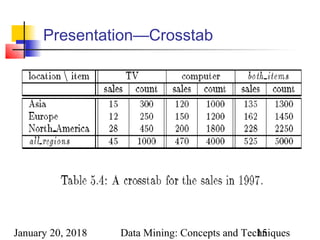
Cross tabulation:
Mapping results into cross tabulation form (similar to contingency
tables).
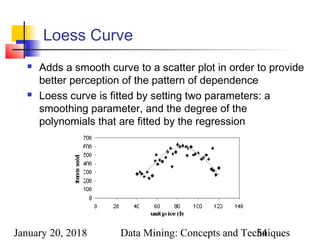
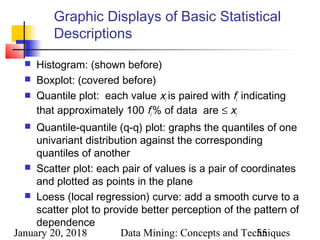
Visualization techniques:
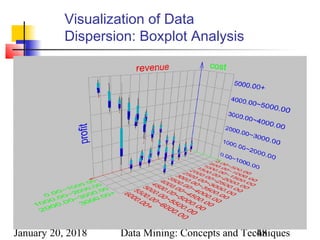
Pie charts, bar charts, curves, cubes, and other visual forms.
Quantitative characteristic rules:
Mapping generalized result into characteristic rules with quantitative
information associated with it, e.g.,
.%]47:["")(_%]53:["")(_
)()(
tforeignxregionbirthtCanadaxregionbirth
xmalexgrad
=∨=
⇒∧](https://image.slidesharecdn.com/5desc-180120120231/85/5desc-13-320.jpg)
![January 20, 2018 Data Mining: Concepts and Techniques38
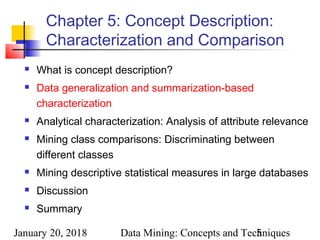
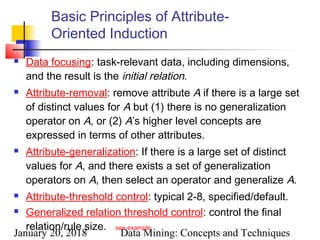
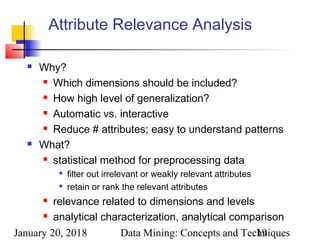
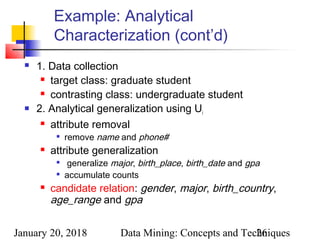
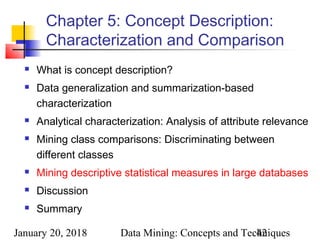
Quantitative Discriminant Rules
Cj = target class
qa = a generalized tuple covers some tuples of class
but can also cover some tuples of contrasting class
d-weight
range: [0, 1]
quantitative discriminant rule form
∑=
∈
∈
=− m
i
ia
ja
)Ccount(q
)Ccount(q
weightd
1
d_weight]:[dX)condition(ss(X)target_claX, ⇐∀](https://image.slidesharecdn.com/5desc-180120120231/85/5desc-38-320.jpg)
![January 20, 2018 Data Mining: Concepts and Techniques39
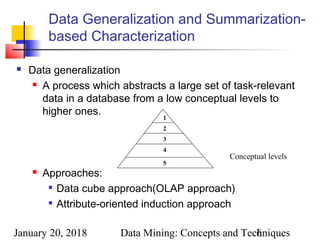
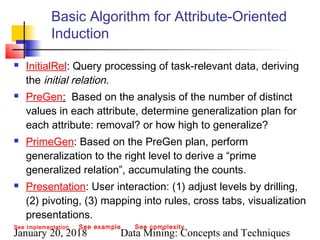
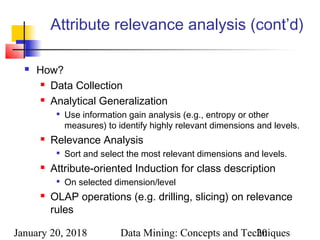
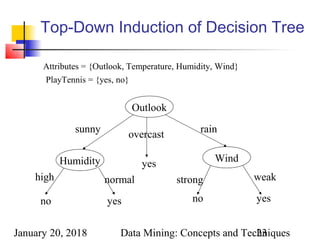
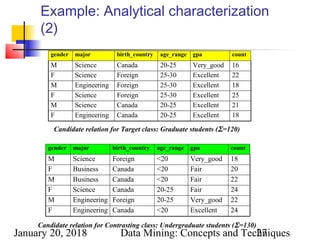
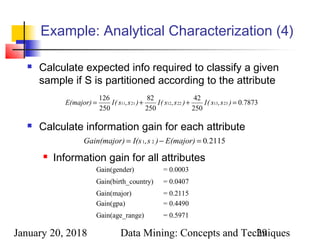
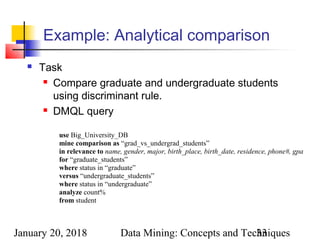
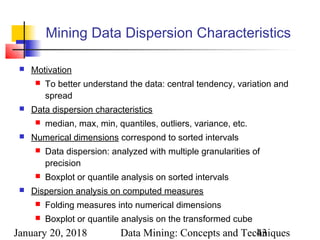
Example: Quantitative Discriminant
Rule
Quantitative discriminant rule
where 90/(90+120) = 30%
Status Birth_country Age_range Gpa Count
Graduate Canada 25-30 Good 90
Undergraduate Canada 25-30 Good 210
Count distribution between graduate and undergraduate students for a generalized tuple
%]30:["")("3025")(_"")(_
)(_,
dgoodXgpaXrangeageCanadaXcountrybirth
XstudentgraduateX
=∧−=∧=
⇐∀](https://image.slidesharecdn.com/5desc-180120120231/85/5desc-39-320.jpg)
![January 20, 2018 Data Mining: Concepts and Techniques40
Class Description
Quantitative characteristic rule
necessary
Quantitative discriminant rule
sufficient
Quantitative description rule
necessary and sufficient
]w:d,w:[t...]w:d,w:[t nn111 ′∨∨′
⇔∀
(X)condition(X)condition
ss(X)target_claX,
n
d_weight]:[dX)condition(ss(X)target_claX, ⇐∀
t_weight]:[tX)condition(ss(X)target_claX, ⇒∀](https://image.slidesharecdn.com/5desc-180120120231/85/5desc-40-320.jpg)
![January 20, 2018 Data Mining: Concepts and Techniques41
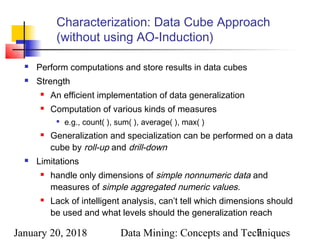
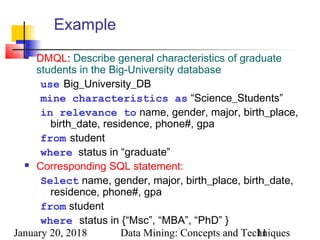
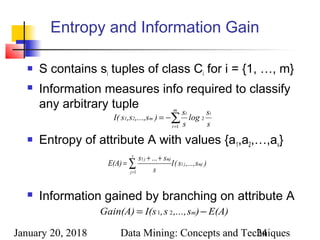
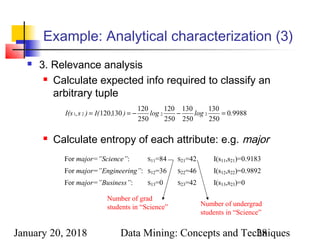
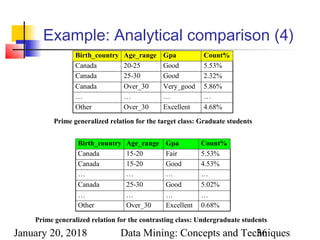
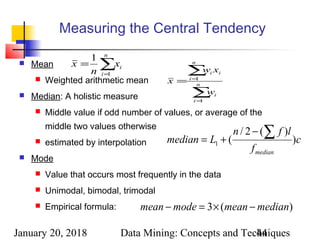
Example: Quantitative Description
Rule
Quantitative description rule for target class Europe
Location/item TV Computer Both_items
Count t-wt d-wt Count t-wt d-wt Count t-wt d-wt
Europe 80 25% 40% 240 75% 30% 320 100% 32%
N_Am 120 17.65% 60% 560 82.35% 70% 680 100% 68%
Both_
regions
200 20% 100% 800 80% 100% 1000 100% 100%
Crosstab showing associated t-weight, d-weight values and total number (in thousands) of TVs and
computers sold at AllElectronics in 1998
30%]:d75%,:[t40%]:d25%,:[t )computer""(item(X))TV""(item(X)
Europe(X)X,
=∨=
⇔∀](https://image.slidesharecdn.com/5desc-180120120231/85/5desc-41-320.jpg)
![January 20, 2018 Data Mining: Concepts and Techniques45
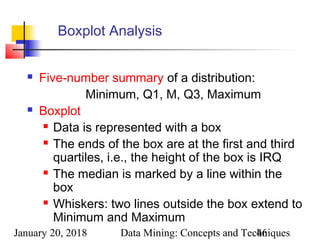
Measuring the Dispersion of Data
Quartiles, outliers and boxplots
Quartiles: Q1 (25th
percentile), Q3 (75th
percentile)
Inter-quartile range: IQR = Q3 –Q1
Five number summary: min, Q1, M,Q3, max
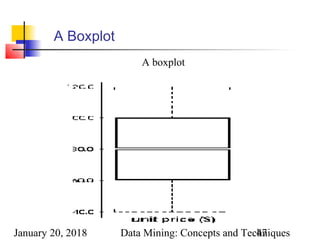
Boxplot: ends of the box are the quartiles, median is marked,
whiskers, and plot outlier individually
Outlier: usually, a value higher/lower than 1.5 x IQR
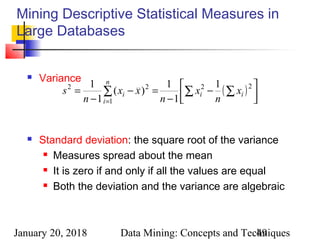
Variance and standard deviation
Variance s2
: (algebraic, scalable computation)
Standard deviation s is the square root of variance s2
∑ ∑∑ = ==
−
−
=−
−
=
n
i
n
i
ii
n
i
i x
n
x
n
xx
n
s
1 1
22
1
22
])(
1
[
1
1
)(
1
1](https://image.slidesharecdn.com/5desc-180120120231/85/5desc-45-320.jpg)