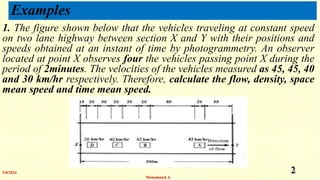
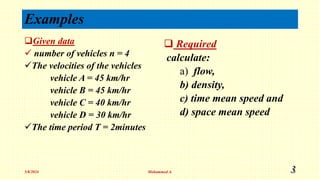
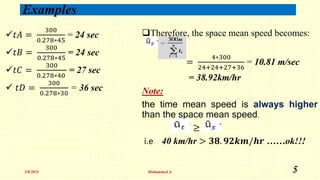
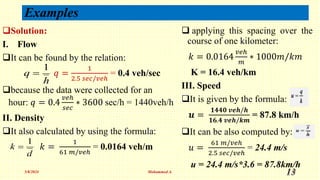
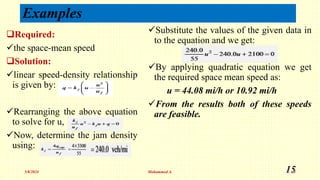
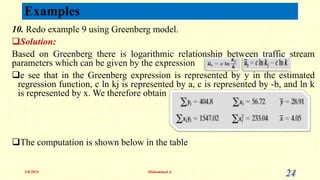
Examples
1. Fundamentals of traffic Flow
5/8/2024 Mohammed A. 1
Examples
1. The figure shown below that the vehicles traveling at constant speed
on two lane highway between section X and Y with their positions and
speeds obtained at an instant of time by photogrammetry. An observer
located at point X observes four the vehicles passing point X during the
period of 2minutes. The velocities of the vehicles measured as 45, 45, 40
and 30 km/hr respectively. Therefore, calculate the flow, density, space
mean speed and time mean speed.
5/8/2024
Mohammed A.
2
Examples
Given data
 number of vehicles n = 4
The velocities of the vehicles
vehicle A = 45 km/hr
vehicle B = 45 km/hr
vehicle C = 40 km/hr
vehicle D = 30 km/hr
The time period T = 2minutes
 Required
calculate:
a) flow,
b) density,
c) time mean speed and
d) space mean speed
5/8/2024 Mohammed A. 3
Examples
Solution
a) Flow
The flow can be expressed by the
formula:
𝑞 =
4∗3600
2∗60
= 120 veh/hr
b) Density
It can be given by the formula:
𝐾 =
4∗1000
300
= 13.3 veh/km
c) time mean speed
It can be found by the equations:
𝑈𝑡 =
45+45+40+30
4
= 40 km/hr
d) space mean speed
It can be also found by:
L is the distance between X and Y.
Now, the time ti takes the ith vehicle
to travel from X toY at speed ui can
be found by:𝒕𝒊 =
𝑳
𝑼𝒊
5/8/2024 Mohammed A. 4
Examples
𝑡𝐴 =
300
0.278∗45
= 24 sec
𝑡𝐵 =
300
0.278∗45
= 24 sec
𝑡𝐶 =
300
0.278∗40
= 27 sec
 𝑡𝐷 =
300
0.278∗30
= 36 sec
Therefore, the space mean speed becomes:
=
4∗300
24+24+27+36
= 10.81 m/sec
= 38.92km/hr
Note:
the time mean speed is always higher
than the space mean speed.
≥
i.e 40 km/hr > 𝟑𝟖. 𝟗𝟐𝒌𝒎/𝒉𝒓 ……ok!!!
5/8/2024 Mohammed A. 5
Examples
2. Two set of vehicles are timed over a kilometer, and the flows are also recorded.
In the first sets, four vehicles are take 52,56,63 and 69 seconds when the flow is
1500 veh/hr. In the second set, four vehicles are take 70,77,74 and 79 seconds
when the flow is 1920 veh/hr. These vehicles have been timed over space, then
calculate the density, space mean speed, free flow speed, jam density and capacity
for the given two sets of vehicles?
Given:
Data for the first set of vehicles: Data for the 2nd set of vehicles:
Number of vehicles, n = 4 Number of vehicles, n = 4
Timed over a kilometer, ti Timed over a kilometer, ti
52,56,63 and 69 seconds 70,77,74 and 79 seconds
The flow, q = 1500 veh/hr. The flow, q = 1920 veh/hr.
5/8/2024 Mohammed A. 6
Examples
Required:
1. the density,
2. space mean speed,
3. free flow speed,
4. jam density and
5. capacity
Solution:
1. the density,
It can be found by:
 =
52+56+63+69
4
= 60 sec. for the 1st set of vehicles
 =
70+77+74+79
4
= 75 sec. for 2nd set of vehicles
Now, the density for both sets of vehicles can be:
𝑘 = 1500 ∗
60
3600
= 25 veh/km for 1st set of vehicles
𝑘 = 1920 ∗
75
3600
= 40 veh/km for 2nd set of vehicles
5/8/2024 Mohammed A. 7
Examples
2. space mean speed
It can be given by the relations:
=
𝑞
𝑘
=
1500
25
= 60 km/hr 1st set
=
1920
40
= 48 km/hr 2nd set of vehicle
3. free flow speed
In order to determine the free flow speed we
Need to develop the equation using Green shield
model:
Now, substituting the values of
speed and density into the equation
and get the required values.
60Kj = Uf*Kj- 25Uf……..1
48Kj = Uf*Kj- 40Uf……..2
Multiplying equation 1 by 8 and
equation 2 by -5 and we get:
480Kj = 8UfKj – 200Uf….1
-240Kj = -5UfKj + 200Uf….2
Add the two equations and we get:
240Kj = 3UfKj
 Uf = 80 km/hr.
5/8/2024 Mohammed A. 8










j
f
k
k
u
u 1
Examples
4. jam density
To determine jam density substitute
the value of free flow speed into
equation 1 and we get:
60Kj = UfKj- 25Uf…1
Kj = 100 veh/km
5. Capacity
It can be calculated by:
𝑞𝑐𝑎𝑝 =
100 ∗ 80
4
qcap = 2000 veh/hr.
5/8/2024 Mohammed A. 9
4
f
j
cap
cap
cap
u
k
u
k
q 

Examples
3. The speeds of five vehicles were measured (with radar) at the
midpoint of a 0.5-mile section of roadway. The speeds for vehicles 1,
2, 3, 4, and 5 were 44, 42, 51, 49, and 46 mi/h, respectively.
Assuming all vehicles were traveling at constant speed over this
roadway section, calculate the time-mean and space-mean speeds.
Given data
5/8/2024 Mohammed A. 10
Vehicles Speeds (mi/hr)
1 44
2 42
3 51
4 49
5 46
Examples
Required:
a) Time mean speed
b) Space mean speed
Solution:
The time mean speed is given by:
=
44+42+51+49+46
5
= 46.4 mi/hr
 the space mean speed is given by:
ok!!!
=
𝟓
𝟏
𝟒𝟒
+
𝟏
𝟒𝟐
+
𝟏
𝟓𝟏
+
𝟏
𝟒𝟗
+
𝟏
𝟒𝟔
= 46.17 mi/hr
5/8/2024 Mohammed A. 11
s
t v
v 
Examples
4. Vehicle time headways and spacing were measured at a point along a
highway, from a single lane, over the course of an hour. The average values
were calculated as 2.5 s/veh for headway and 200 ft/veh (61 m/veh) for
spacing. Calculate the, flow, density and speed of the traffic.
Given Data:
Average headway = 2.5 sec/veh
Average spacing = 200 ft/veh or 61m/veh
Required:
I. Flow
II. Density and
III. speed
5/8/2024 Mohammed A. 12
Examples
Solution:
I. Flow
It can be found by the relation:
𝑞 =
1
2.5 𝑠𝑒𝑐/𝑣𝑒ℎ
= 0.4 veh/sec
because the data were collected for an
hour: 𝑞 = 0.4
𝑣𝑒ℎ
𝑠𝑒𝑐
∗ 3600 sec/h = 1440veh/h
II. Density
It also calculated by using the formula:
𝑘 =
1
61 𝑚/𝑣𝑒ℎ
= 0.0164 veh/m
 applying this spacing over the
course of one kilometer:
𝑘 = 0.0164
𝑣𝑒ℎ
𝑚
∗ 1000𝑚/𝑘𝑚
K = 16.4 veh/km
III. Speed
It is given by the formula:
𝒖 =
𝟏𝟒𝟒𝟎 𝒗𝒆𝒉/𝒉
𝟏𝟔.𝟒 𝒗𝒆𝒉/𝒌𝒎
= 87.8 km/h
It can be also computed by:
𝑢 =
61 𝑚/𝑣𝑒ℎ
2.5 𝑠𝑒𝑐/𝑣𝑒ℎ
= 24.4 m/s
u = 24.4 m/s*3.6 = 87.8km/h
5/8/2024 Mohammed A. 13
h
q
1

d
k
1

Examples
5. A section of highway is known to have a free-flow speed of 55 mi/h and a
capacity of 3300 veh/h. In a given hour, 2100 vehicles were counted at a
specified point along this highway section. If the linear speed-density
relationship applies, what would you estimate the space-mean speed of these
2100 vehicles to be?
Given data:
Uf = 55 mi/hr
qcap = 3300 veh/h
q = 2100 veh in a given hour
5/8/2024 Mohammed A. 14
Examples
Required:
the space-mean speed
Solution:
linear speed-density relationship
is given by:
Rearranging the above equation
to solve for u,
Now, determine the jam density
using:
Substitute the values of the given data in
to the equation and we get:
By applying quadratic equation we get
the required space mean speed as:
u = 44.08 mi/h or 10.92 mi/h
From the results both of these speeds
are feasible.
5/8/2024 Mohammed A. 15
Examples
6. Consider Greenshield’s linear speed-density model U= 55 – 0.45K , then drive
flow-density relationships, and calculate Free flow speed, Jam density and
Capacity.(where speed is in mi/hr, density veh/mi and flow veh/hr).
Given data
Linear speed- density model, U = 55 – 0.45K
Required
Drive flow- density relationships
Free flow speed
Jam density
capacity
5/8/2024 Mohammed A. 16
Examples
Solution
Derivation of flow- density relationships
U= 55 – 0.45K but q = u*k, u = q/k substitute
(q/k) = 55 – 0.45K finally we get,
q = 55k – 0.45k^2 it is parabolic relationship
Free flow speed
Free flow speed occurs when the density is zero.
U= 55 – 0.45K, k=0
Uf = 55 – 0.45 *0
Uf = 55 mi/hr
Jam density
Jam density occurs when speed is
zero.
U= 55 – 0.45K, u = 0
0 = 55 – 0.45*Kj
Kj = 55/0.45 = 122.22 veh/mi
capacity
It is computed by:
𝑞 =
55 ∗122.22
4
=1680.53 veh/hr/ln
5/8/2024 Mohammed A. 17
4
f
j
cap
cap
cap
u
k
u
k
q 

Examples
8.A section of highway has the following speed-flow relationship:
q+100u = 300u -4u^2, then calculate the following:
a) free flow speed
b) density at capacity
c) capacity
d) the flow rate corresponding to a density of 80vpm.
5/8/2024 Mohammed A. 18
Examples
5/8/2024 Mohammed A. 19
9. The data shown below were obtained on a highway. Use regression analysis to
develop Greenshields model/equation based on the given data shown below in
the table.
5/8/2024 Mohammed A. 20
Examples
Solution:
Based on Greenshield model there is a linear relation ship between traffic stream
parameters. Therefore, in order to determine the equation we use linear regression
with the general form shown below.
Where, a and b are regression constant which is given by the formula:
The computation is shown below in the table
5/8/2024 Mohammed A. 21
Examples
5/8/2024 Mohammed A. 22
Examples
 we see that the speed in the Greenshields expression is represented by y in the
estimated regression function, the mean free speed uf is represented by a, and
the value of the mean free speed uf divided by the jam density kj is represented
by -b. We therefore obtain:
Finally the required regression equation becomes: y = 62.68 – 0.53x
Where, y represents space mean speed and x represents density and we get
5/8/2024 Mohammed A. 23
Examples
10. Redo example 9 using Greenberg model.
Solution:
Based on Greenberg there is logarithmic relationship between traffic stream
parameters which can be given by the expression
e see that in the Greenberg expression is represented by y in the estimated
regression function, c ln kj is represented by a, c is represented by -b, and ln k
is represented by x. We therefore obtain
The computation is shown below in the table
5/8/2024 Mohammed A. 24
Examples
5/8/2024 Mohammed A. 25
Examples
 Since a =145.06 and b = -28.68, the speed for maximum flow is c = 28.68 mi/h. Finally,
Then we get the equation
5/8/2024 Mohammed A. 26
Examples
11. A driver takes 3.5 s to react a complex situation while traveling at a speed of
60 km/hr. how far does the vehicle travel before the driver initiates a physical
response to the situation?
Solution:
The vehicle will travel : dr = 0.278vt, where
v = 60km/h
t = 3.5s
Therefore, the distance traveled by the vehicle cab be:
dr = 0.278*60*3.5
= 58.4 m
5/8/2024 Mohammed A. 27
Examples
5/8/2024 Mohammed A. 28
Examples
5/8/2024 Mohammed A. 29

501098357-Examples for Transportation engineering problems.pptx

  • 1.
    Examples 1. Fundamentals oftraffic Flow 5/8/2024 Mohammed A. 1
  • 2.
    Examples 1. The figureshown below that the vehicles traveling at constant speed on two lane highway between section X and Y with their positions and speeds obtained at an instant of time by photogrammetry. An observer located at point X observes four the vehicles passing point X during the period of 2minutes. The velocities of the vehicles measured as 45, 45, 40 and 30 km/hr respectively. Therefore, calculate the flow, density, space mean speed and time mean speed. 5/8/2024 Mohammed A. 2
  • 3.
    Examples Given data  numberof vehicles n = 4 The velocities of the vehicles vehicle A = 45 km/hr vehicle B = 45 km/hr vehicle C = 40 km/hr vehicle D = 30 km/hr The time period T = 2minutes  Required calculate: a) flow, b) density, c) time mean speed and d) space mean speed 5/8/2024 Mohammed A. 3
  • 4.
    Examples Solution a) Flow The flowcan be expressed by the formula: 𝑞 = 4∗3600 2∗60 = 120 veh/hr b) Density It can be given by the formula: 𝐾 = 4∗1000 300 = 13.3 veh/km c) time mean speed It can be found by the equations: 𝑈𝑡 = 45+45+40+30 4 = 40 km/hr d) space mean speed It can be also found by: L is the distance between X and Y. Now, the time ti takes the ith vehicle to travel from X toY at speed ui can be found by:𝒕𝒊 = 𝑳 𝑼𝒊 5/8/2024 Mohammed A. 4
  • 5.
    Examples 𝑡𝐴 = 300 0.278∗45 = 24sec 𝑡𝐵 = 300 0.278∗45 = 24 sec 𝑡𝐶 = 300 0.278∗40 = 27 sec  𝑡𝐷 = 300 0.278∗30 = 36 sec Therefore, the space mean speed becomes: = 4∗300 24+24+27+36 = 10.81 m/sec = 38.92km/hr Note: the time mean speed is always higher than the space mean speed. ≥ i.e 40 km/hr > 𝟑𝟖. 𝟗𝟐𝒌𝒎/𝒉𝒓 ……ok!!! 5/8/2024 Mohammed A. 5
  • 6.
    Examples 2. Two setof vehicles are timed over a kilometer, and the flows are also recorded. In the first sets, four vehicles are take 52,56,63 and 69 seconds when the flow is 1500 veh/hr. In the second set, four vehicles are take 70,77,74 and 79 seconds when the flow is 1920 veh/hr. These vehicles have been timed over space, then calculate the density, space mean speed, free flow speed, jam density and capacity for the given two sets of vehicles? Given: Data for the first set of vehicles: Data for the 2nd set of vehicles: Number of vehicles, n = 4 Number of vehicles, n = 4 Timed over a kilometer, ti Timed over a kilometer, ti 52,56,63 and 69 seconds 70,77,74 and 79 seconds The flow, q = 1500 veh/hr. The flow, q = 1920 veh/hr. 5/8/2024 Mohammed A. 6
  • 7.
    Examples Required: 1. the density, 2.space mean speed, 3. free flow speed, 4. jam density and 5. capacity Solution: 1. the density, It can be found by:  = 52+56+63+69 4 = 60 sec. for the 1st set of vehicles  = 70+77+74+79 4 = 75 sec. for 2nd set of vehicles Now, the density for both sets of vehicles can be: 𝑘 = 1500 ∗ 60 3600 = 25 veh/km for 1st set of vehicles 𝑘 = 1920 ∗ 75 3600 = 40 veh/km for 2nd set of vehicles 5/8/2024 Mohammed A. 7
  • 8.
    Examples 2. space meanspeed It can be given by the relations: = 𝑞 𝑘 = 1500 25 = 60 km/hr 1st set = 1920 40 = 48 km/hr 2nd set of vehicle 3. free flow speed In order to determine the free flow speed we Need to develop the equation using Green shield model: Now, substituting the values of speed and density into the equation and get the required values. 60Kj = Uf*Kj- 25Uf……..1 48Kj = Uf*Kj- 40Uf……..2 Multiplying equation 1 by 8 and equation 2 by -5 and we get: 480Kj = 8UfKj – 200Uf….1 -240Kj = -5UfKj + 200Uf….2 Add the two equations and we get: 240Kj = 3UfKj  Uf = 80 km/hr. 5/8/2024 Mohammed A. 8           j f k k u u 1
  • 9.
    Examples 4. jam density Todetermine jam density substitute the value of free flow speed into equation 1 and we get: 60Kj = UfKj- 25Uf…1 Kj = 100 veh/km 5. Capacity It can be calculated by: 𝑞𝑐𝑎𝑝 = 100 ∗ 80 4 qcap = 2000 veh/hr. 5/8/2024 Mohammed A. 9 4 f j cap cap cap u k u k q  
  • 10.
    Examples 3. The speedsof five vehicles were measured (with radar) at the midpoint of a 0.5-mile section of roadway. The speeds for vehicles 1, 2, 3, 4, and 5 were 44, 42, 51, 49, and 46 mi/h, respectively. Assuming all vehicles were traveling at constant speed over this roadway section, calculate the time-mean and space-mean speeds. Given data 5/8/2024 Mohammed A. 10 Vehicles Speeds (mi/hr) 1 44 2 42 3 51 4 49 5 46
  • 11.
    Examples Required: a) Time meanspeed b) Space mean speed Solution: The time mean speed is given by: = 44+42+51+49+46 5 = 46.4 mi/hr  the space mean speed is given by: ok!!! = 𝟓 𝟏 𝟒𝟒 + 𝟏 𝟒𝟐 + 𝟏 𝟓𝟏 + 𝟏 𝟒𝟗 + 𝟏 𝟒𝟔 = 46.17 mi/hr 5/8/2024 Mohammed A. 11 s t v v 
  • 12.
    Examples 4. Vehicle timeheadways and spacing were measured at a point along a highway, from a single lane, over the course of an hour. The average values were calculated as 2.5 s/veh for headway and 200 ft/veh (61 m/veh) for spacing. Calculate the, flow, density and speed of the traffic. Given Data: Average headway = 2.5 sec/veh Average spacing = 200 ft/veh or 61m/veh Required: I. Flow II. Density and III. speed 5/8/2024 Mohammed A. 12
  • 13.
    Examples Solution: I. Flow It canbe found by the relation: 𝑞 = 1 2.5 𝑠𝑒𝑐/𝑣𝑒ℎ = 0.4 veh/sec because the data were collected for an hour: 𝑞 = 0.4 𝑣𝑒ℎ 𝑠𝑒𝑐 ∗ 3600 sec/h = 1440veh/h II. Density It also calculated by using the formula: 𝑘 = 1 61 𝑚/𝑣𝑒ℎ = 0.0164 veh/m  applying this spacing over the course of one kilometer: 𝑘 = 0.0164 𝑣𝑒ℎ 𝑚 ∗ 1000𝑚/𝑘𝑚 K = 16.4 veh/km III. Speed It is given by the formula: 𝒖 = 𝟏𝟒𝟒𝟎 𝒗𝒆𝒉/𝒉 𝟏𝟔.𝟒 𝒗𝒆𝒉/𝒌𝒎 = 87.8 km/h It can be also computed by: 𝑢 = 61 𝑚/𝑣𝑒ℎ 2.5 𝑠𝑒𝑐/𝑣𝑒ℎ = 24.4 m/s u = 24.4 m/s*3.6 = 87.8km/h 5/8/2024 Mohammed A. 13 h q 1  d k 1 
  • 14.
    Examples 5. A sectionof highway is known to have a free-flow speed of 55 mi/h and a capacity of 3300 veh/h. In a given hour, 2100 vehicles were counted at a specified point along this highway section. If the linear speed-density relationship applies, what would you estimate the space-mean speed of these 2100 vehicles to be? Given data: Uf = 55 mi/hr qcap = 3300 veh/h q = 2100 veh in a given hour 5/8/2024 Mohammed A. 14
  • 15.
    Examples Required: the space-mean speed Solution: linearspeed-density relationship is given by: Rearranging the above equation to solve for u, Now, determine the jam density using: Substitute the values of the given data in to the equation and we get: By applying quadratic equation we get the required space mean speed as: u = 44.08 mi/h or 10.92 mi/h From the results both of these speeds are feasible. 5/8/2024 Mohammed A. 15
  • 16.
    Examples 6. Consider Greenshield’slinear speed-density model U= 55 – 0.45K , then drive flow-density relationships, and calculate Free flow speed, Jam density and Capacity.(where speed is in mi/hr, density veh/mi and flow veh/hr). Given data Linear speed- density model, U = 55 – 0.45K Required Drive flow- density relationships Free flow speed Jam density capacity 5/8/2024 Mohammed A. 16
  • 17.
    Examples Solution Derivation of flow-density relationships U= 55 – 0.45K but q = u*k, u = q/k substitute (q/k) = 55 – 0.45K finally we get, q = 55k – 0.45k^2 it is parabolic relationship Free flow speed Free flow speed occurs when the density is zero. U= 55 – 0.45K, k=0 Uf = 55 – 0.45 *0 Uf = 55 mi/hr Jam density Jam density occurs when speed is zero. U= 55 – 0.45K, u = 0 0 = 55 – 0.45*Kj Kj = 55/0.45 = 122.22 veh/mi capacity It is computed by: 𝑞 = 55 ∗122.22 4 =1680.53 veh/hr/ln 5/8/2024 Mohammed A. 17 4 f j cap cap cap u k u k q  
  • 18.
    Examples 8.A section ofhighway has the following speed-flow relationship: q+100u = 300u -4u^2, then calculate the following: a) free flow speed b) density at capacity c) capacity d) the flow rate corresponding to a density of 80vpm. 5/8/2024 Mohammed A. 18
  • 19.
  • 20.
    9. The datashown below were obtained on a highway. Use regression analysis to develop Greenshields model/equation based on the given data shown below in the table. 5/8/2024 Mohammed A. 20 Examples
  • 21.
    Solution: Based on Greenshieldmodel there is a linear relation ship between traffic stream parameters. Therefore, in order to determine the equation we use linear regression with the general form shown below. Where, a and b are regression constant which is given by the formula: The computation is shown below in the table 5/8/2024 Mohammed A. 21 Examples
  • 22.
  • 23.
     we seethat the speed in the Greenshields expression is represented by y in the estimated regression function, the mean free speed uf is represented by a, and the value of the mean free speed uf divided by the jam density kj is represented by -b. We therefore obtain: Finally the required regression equation becomes: y = 62.68 – 0.53x Where, y represents space mean speed and x represents density and we get 5/8/2024 Mohammed A. 23 Examples
  • 24.
    10. Redo example9 using Greenberg model. Solution: Based on Greenberg there is logarithmic relationship between traffic stream parameters which can be given by the expression e see that in the Greenberg expression is represented by y in the estimated regression function, c ln kj is represented by a, c is represented by -b, and ln k is represented by x. We therefore obtain The computation is shown below in the table 5/8/2024 Mohammed A. 24 Examples
  • 25.
    5/8/2024 Mohammed A.25 Examples  Since a =145.06 and b = -28.68, the speed for maximum flow is c = 28.68 mi/h. Finally, Then we get the equation
  • 26.
    5/8/2024 Mohammed A.26 Examples 11. A driver takes 3.5 s to react a complex situation while traveling at a speed of 60 km/hr. how far does the vehicle travel before the driver initiates a physical response to the situation? Solution: The vehicle will travel : dr = 0.278vt, where v = 60km/h t = 3.5s Therefore, the distance traveled by the vehicle cab be: dr = 0.278*60*3.5 = 58.4 m
  • 27.
  • 28.
  • 29.