This document provides information about induced draft fans and false air calculation at a cement plant. It discusses the types of fans used, including centrifugal and axial fans. It describes the basic fan laws around how fan performance is affected by speed, air density, and diameter. The document outlines the common equipment used for measurements. It provides the calculations for density, velocity, volumetric air flow, pressure, power, and efficiency. Finally, it discusses ways to improve fan performance and minimize false air in ducts.

![11 | P a g e
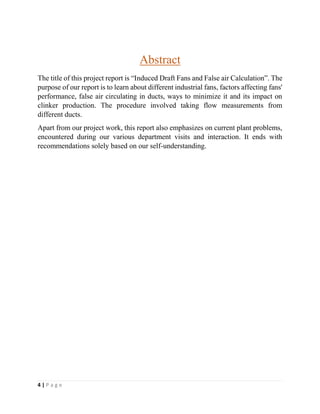
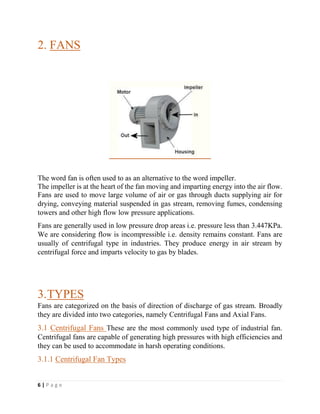
7. Calculations Involved
7.1 Density
Here we use two types of density, given normal density [normal] and corrected
density [corrected]. Normal density is calculated by analyzing flue gas.
Gas % Mole
Fraction
Density at STP
CO2 28 0.201 1.964
N2 67.29 0.760 1.25
O2 3.90 0.037 1.428
H2O 0 0 0.80
CO Negligible 0 1.25
Density of mixture= 0.201*1.964 + 0.760*1.25 + 0.037*1.428
= 1.39 Kg/Nm^3.
Corrected density
corrected = normal * Tc * Pc
Where Tc = 273/ (273+T (flue gas))
Pc = (9986 + P(s))/10330
Duct Density(kg/m3
) Tc Pc Corrected Density(kg/m3
)
1 1.39 0.48 0.91 0.607
2 1.39 0.50 0.91 0.632
7.2 Velocity
Velocity of air in duct is calculated by
= ½*corrected*V2
= Avg.P(d)
Vel = K*((2*9.81*avP(d))/(s))0.5
Where k is pitot constant provided by manufacturer, here its 0.8490](https://image.slidesharecdn.com/958ad98e-1ef6-4862-a177-cad4d8a45075-160720192406/85/2014A1PS499H_AKASHAGRAWAL_final-project-11-320.jpg)
![23 | P a g e
electricity production will definitely be more costly, why we don’t switch to latest
technology. Eventually, it might take few years to compensate for switching cost.
10.2 Thermal Power Plant
In this department, we have learned that how electricity is produced for factory and
township with two sets of turbine. The only objective is to run turbine at 3000rpm
by impact of dry steam. And to carry out same, a sequential process is followed.
Problem: - Recently, Line 1 unit was intentionally shut down but at time of start-
up, boiler tube cracked.
Interpretation: - Boiler tubes have become thin, occasional puncture forces to shut
down. Again it takes lots of fuel to light up [reach up to 550'C].
Solution: - Thickness of tubes should be regularly checked. Identification of old
tubes and its replacement would solve the problem.
Apart from this, a back turbine can be installed which could utilize low pressure
steam and generate few Megawatts of energy. Although its feasibility can only be
analyzed by experts.](https://image.slidesharecdn.com/958ad98e-1ef6-4862-a177-cad4d8a45075-160720192406/85/2014A1PS499H_AKASHAGRAWAL_final-project-23-320.jpg)