4. slope interceptsliderstouchpad
•
0 likes•87 views

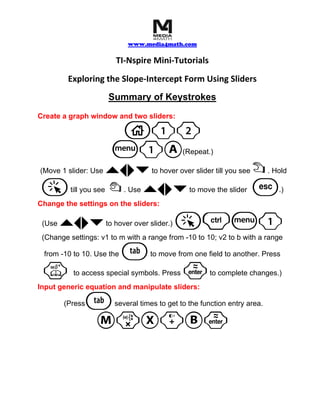
This document provides instructions for exploring the slope-intercept form of a line using sliders on a TI-Nspire graphing calculator. It describes how to create a graph window and two sliders labeled m and b, then input the generic equation y=mx+b and manipulate the sliders to adjust the slope and y-intercept and observe the resulting changes to the line on the graph. The sliders can be moved to set m from -10 to 10 and b from -10 to 10, allowing interactive exploration of different slope-intercept equations.

Recommended
More Related Content
What's hot
What's hot (16)
Similar to 4. slope interceptsliderstouchpad
Similar to 4. slope interceptsliderstouchpad (11)
More from Media4math
More from Media4math (20)
Recently uploaded
Recently uploaded (20)
4. slope interceptsliderstouchpad
- 1. www.media4math.com TI-Nspire Mini-Tutorials Exploring the Slope-Intercept Form Using Sliders Summary of Keystrokes Create a graph window and two sliders: 1 b1A (Repeat.) (Move 1 slider: Use `¡¢¤ to hover over slider till you see ÷ . Hold a till you see { `¡¢¤ . Use to move the slider d .) Change the settings on the sliders: (Use `¡¢¤ to hover over slider.) (Change settings: v1 to m with a range from -10 to 10; v2 to b with a range from -10 to 10. Use the e to move from one field to another. Press k to access special symbols. Press · to complete changes.) Input generic equation and manipulate sliders: (Press e several times to get to the function entry area.