
Uploaded byMedia4math
1 exploring sineswithsliders
This document provides instructions for creating a graphing window with three sliders in TI-Nspire and using the sliders to manipulate a sine graph. The steps include: creating a graphing window and three sliders; moving two sliders by hovering over them and pressing arrow keys; changing the settings of the sliders to specific ranges; and inputting a generic sine function using the slider values.
More Related Content


Similar to 1 exploring sineswithsliders


1 exploring sineswithsliders
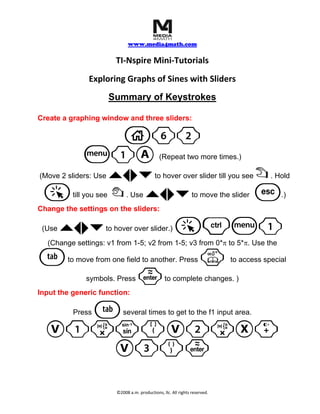
- 1. www.media4math.com TI‐Nspire Mini‐Tutorials Exploring Graphs of Sines with Sliders Summary of Keystrokes Create a graphing window and three sliders: c62 b1A (Repeat two more times.) `¡¢¤ (Move 2 sliders: Use to hover over slider till you see ÷ . Hold a { `¡¢¤till you see . Use to move the slider d .) Change the settings on the sliders: (Use `¡¢¤ to hover over slider.) a/b1 (Change settings: v1 from 1-5; v2 from 1-5; v3 from 0*π to 5*π. Use the e to move from one field to another. Press k to access special symbols. Press · to complete changes. ) Input the generic function: e Press several times to get to the f1 input area. V1rm(V2rX+ V3)· ©2008 a.m. productions, llc. All rights reserved.