
Uploaded byMedia4math
627 views
8. exploring sineswithsliderstouchpad
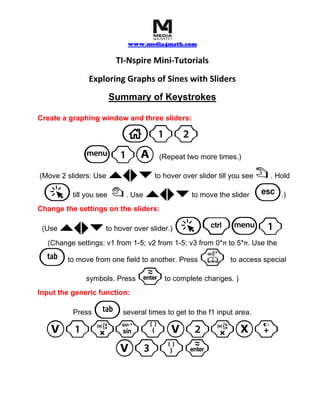
This document provides instructions for creating a graphing window with three sliders in TI-Nspire and using the sliders to manipulate the graph of a sine function. The sliders control the amplitude, horizontal shift, and phase shift of the sine function. Users can explore how changing the slider values affects the graph of the function.
More Related Content


What's hot


Viewers also liked


Similar to 8. exploring sineswithsliderstouchpad


More from Media4math


Recently uploaded


8. exploring sineswithsliderstouchpad
- 1. www.media4math.com TI-Nspire Mini-Tutorials Exploring Graphs of Sines with Sliders Summary of Keystrokes Create a graphing window and three sliders: 1 b1A (Repeat two more times.) `¡¢¤ (Move 2 sliders: Use to hover over slider till you see ÷. Hold a { `¡¢¤till you see . Use to move the slider d .) Change the settings on the sliders: (Use `¡¢¤ to hover over slider.) (Change settings: v1 from 1-5; v2 from 1-5; v3 from 0*π to 5*π. Use the e to move from one field to another. Press k to access special symbols. Press · to complete changes. ) Input the generic function: e Press several times to get to the f1 input area. V1rm(V2rX+ V3)·